Viability of local vaccine production in
developing countries:
An economic analysis of cost
structures, revenue sizes, market
shares and vaccine prices
Syarifah Liza Munira, SE, MPP
February 2017
A thesis submitted for the degree of Doctor of Philosophy of
The Australian National University
© Copyright by Syarifah Liza Munira, 2017
3
Statement of Originality
I declare that this thesis is the result of original research, and has not been submitted
in whole or in part to this, or any other university, for the attainment of a formal
qualification. The questionnaire in the appendix of Chapter 3 was developed by the
author under close supervision of two senior vaccine experts in WHO. Except where
otherwise acknowledged in the text, this thesis represents my own original work.
5
Acknowledgements
Each PhD journey is unique. Mine is coloured by continuous changes that one would perhaps expect yet not fully anticipate from committing to a journey of four years. The completion of this thesis owes greatly to the support and assistance of many people, which I would like to acknowledge.
Not often is a PhD bestowed with two different Chair supervisors, and I am deeply indebted to both. During the first half of my PhD candidature, my Chair supervisor was Professor James R.G. Butler, who had given me the grounding, support and flexibility which laid the foundation of my research. For the second half of my candidature, my Chair supervisor was Professor Archie Clements. His encouragement, dedication and patience is what led the completion of my PhD research. I am so grateful for his support, careful eye and insightful feedback. I feel my thesis has had the best of two worlds, for this I am truly blessed.
This thesis has benefitted greatly from the members of my PhD supervisory panel, Dr Martin Friede, Louise Carter, Dr Ines Atmosukarto and Dr Yijuan Chen. I am grateful for their timely advice, vast experience and constructive feedback which shaped the thesis analysis. A special thank you to Mba Ines for the many discussions and encouragements that she provided; and to Martin for allowing me to work with his TTi team at WHO/HQ. His team housed my internship and research visit, and allowed me to tap into their network. In particular is Dr.Jan Hendriks, who had kindly co-supervised my visit at WHO/HQ given the challenges of the Ebola pandemic needing Martin’s attention at the time.
6
Research requires data, yet not all data is available publicly. I would like to thank the participation of the ten questionnaire respondents as well as the four vaccine manufacturers that I interviewed. I am grateful for the kind support and assistance from Laure Dumolard at WHO-HQ and Dr Valentin Todorov from UNIDO by providing me access to data that my PhD has drawn its analysis from. I am grateful for the kind support of the staff, consultants and partners in WHO, GAVI, UNIDO, PATH that I had communicated with during the three month fieldwork in Geneva and afterwards. Their time, insight and suggestions have helped sharpen my analysis and understanding of developing country vaccine manufacturing.
During the course of my PhD I have drawn upon numerous insights from the conferences that I attended and presented, as well as a Summer course on vaccines at the LSHTM where I was fortunate to consult with Professor Anne Mills, Professor Kim Mullholland, and Dr Ulla Griffiths. I am particularly grateful for the many mentors, past and present, which lent their support and generous feedback during the formation and conduct of the thesis research. In particular are Dr Julie Milstien, Dr Sarah Barber, and Professor Hal Hill. Many field experts have also been generous in lending their insights. Among them are Dr Raymond Hutubessy, Dr Miloud Kaddar, Alastair West and Dr Robert Sparrow. I would also like to thank Dr Alice Richardson and Dr Pauline Ding for their consultations on the statistical aspects of my data analysis; Dr Shea Andrews for providing a better understanding of multilevel and mixed-model regression models, Dr Jane Desborough for introducing me to the convergent design method as well as the Research Training team, and ASLC at ANU for their research skills and trainings.
7
To my family, particularly to my two pillars of strength, Bunda and Abah, I owe the world over. My dad’s own PhD journey is a source of inspiration that I have drawn upon throughout my PhD. My mother, I cannot thank enough for each and every day that I would draw upon her wisdom, prayers, patience and love. She is a source of inspiration and strength. I do not have enough words to thank them both. I am most humbled by the support and encouragement from my siblings, Abang, Taufik, Ayed and their families, as well as my mother in law, Mama Nahdiar. Though we are all geographically spread, their love and support has been very much felt.
I would like to acknowledge my husband Kiki, and thank him for his incredible faith, continuous encouragement and full support in me pursuing my research. This PhD thesis would definitely not have materialised otherwise. My husband and I had planned our PhDs to be done one after the other. Though the process may have skewed a bit from what we had envisioned it to be, I feel that the 7.5 year PhD journey we’ve had in total, has certainly taught us greatly. Knowing that I have another researcher’s back, especially one with love, has been a powerful source of strength. I am eternally grateful for his support. To my thoughtful and inquisitive son, Omar. I am thankful beyond words for your support and companionship. Arriving in Canberra at the tender age of 2, braving the childcare system cold turkey, in an even more foreign country than your birthplace. You have taught me the meaning of unconditional love and having faith in me despite not knowing what a PhD or thesis actually means. I hope that one day you may understand why at times I was not there to accompany you.
9
Abstract
Over half of the vaccines used in developing countries’ immunisation programs are
supplied by developing country manufacturers. The viability of vaccine production in
developing countries play a significant role in securing the global capacity of vaccine
supplies. These producers however, face challenges in balancing between meeting the
needs of the large population sizes and high disease burden typically found in
developing country markets with uncertainties in demand forecasting and low
profitability. Economic studies on the viability of vaccine production in developing
countries are limited. An identification and better understanding of the critical elements
influencing local vaccine production is crucial and timely, given the present need to
secure and enhance the capacity of global vaccine supplies in the face of emerging
and re-emerging diseases.
This thesis focuses on the viability of local vaccine production in developing countries
by conducting three assessments on cost structures, revenue sizes and percent market
shares, and vaccine prices. The objective of the first assessment, cost structure, is to
address the supply-side barriers of local vaccine production. In the second
assessment, the research utilises revenue sizes and percent market shares as a proxy
of viability and quantifies the influence of vaccine viability factors on developing country
vaccine production. The third assessment on vaccine prices addresses the demand
side barriers to vaccines produced by developing countries and observes the influence
of procurement factors on prices of vaccines produced by developing countries.
For the first assessment, on cost structures, primary data were collected from existing
vaccine producers in developing countries and analysed using a cost-analysis method.
Three hypothetical scenarios using different production scale and scope were applied
10
scope of production are essential in achieving and sustaining viability. The findings
also showed that the main factors influencing viability were strong domestic sales and
consistent supply, this also holds for companies planning to expand into export
markets. Further, a step-cost characteristic for fixed costs, and failure rates ranging
between 2% to 45%, were identified.
In the second assessment, factors were assessed for their influence on revenue sizes
and percent market shares of vaccine products supplied by developing country
manufacturers for immunisation programs. A multilevel regression model was built
using a hierarchical dataset for years 2012 – 2014, for the overall global market as well
as the domestic and export markets specifically. The findings showed that revenue
sizes were influenced by national income levels, consistent production supplies and
the ability to meet the needs of immunisation programs in procuring countries. While
factors identified as influencing percent market share were: having consistent
production, the ability to meet the needs of immunisation programs in procuring
countries as well as having vaccines with prequalification status. The third assessment,
on vaccine prices, was based on a mixed effects regression on a panel dataset of
vaccine prices for years 2005 to 2015. The analysis found that procurement volume,
method and size of vaccine formulation were influential in determining vaccine prices,
for both traditional and modern technology types.
The overall findings suggest that the cost of producing vaccines in developing countries
are an average of $2.05 per dose ranging between US$0.92 and $4.40. These
estimates are within the cost range suggested for multinational companies (Mercer
Management Consulting (2002): $0.05 to $3-4 per dose). Whilst the vaccine markets
that developing country producers face are not premium markets like those found in
high-income countries, this is likely compensated by the vast size of these markets and
the lack of domestic competition. Their production viability however becomes
11
produce newer technology vaccines. It is in these situations where knowledge of critical
factors becomes important.
This thesis not only adds to what is known about the viability of vaccine production in
developing countries, but also provides robust evidence for developing countries and
global health advocates to understand better the factors driving viability in regards to
costs, revenue sizes and percent market shares as well as prices. This may allow
policymakers to navigate and develop policies that can further support local vaccine
producers and other developing countries that are considering investing into local
13
Table of Contents
Statement of Originality ... 3
Acknowledgements ... 5
Abstract ... 9
Table of Contents ... 13
List of Figures ... 17
List of Tables ... 21
List of Appendices ... 23
List of Acronyms and Abbreviations ... 25
Introduction ... 27
1.1. Overview ... 27
1.2. Aims of the thesis ... 29
1.3. Background ... 30
1.4. Scope of the research ... 31
1.5. Organisation of the thesis ... 33
Background ... 37
2.1. Introduction ... 37
2.2. Historical perspective ... 37
2.3. Landscape of recent developments in the vaccine market ... 39
2.3.1. Tiered pricing mechanism for vaccines ... 40
2.3.2. Market shaping strategies ... 42
14
2.5. Local vaccine production in developing countries ... 52
2.6. Viability of vaccine production ... 56
2.7. Vaccine production costs ... 62
2.8. Vaccine prices ... 65
2.8.1. The Vaccine Product, Price and Procurement (V3P) project ... 67
2.9. Conclusions ... 70
2.10. Appendices ... 71
The cost structure of establishing new vaccine manufacturing facilities in developing countries ... 79
3.1. Introduction ... 79
3.2. Methods ... 83
3.2.1. Data collection ... 83
3.2.2. Analysis ... 89
3.3. Results ... 93
3.3.1. Cost structures ... 93
3.3.2. Cost patterns ... 97
3.3.3. Market price comparisons ... 100
3.3.4. Economic benefit of fill finish mechanisms versus procuring finished vaccines ... 103
3.4. Discussion ... 105
3.4.1. Limitations ... 110
3.4.2. Conclusions ... 112
15
A multilevel modelling analysis of viability factors for vaccine production
in developing countries ... 117
4.1. Introduction ... 117
4.2. Methods ... 122
4.2.1. Data management and inclusion and exclusion criteria ... 122
4.2.2. Explanatory variables ... 125
4.2.3. Statistical analysis ... 133
4.3. Results ... 139
4.3.1. Descriptive analysis and correlation analysis ... 139
4.3.2. Multivariate regression ... 152
4.4. Discussion ... 157
4.4.1. Limitations ... 160
4.4.2. Conclusions ... 161
A mixed-effects model of the association between procurement factors and prices of vaccines produced by developing countries ... 165
5.1. Introduction ... 165
5.2. Methods ... 167
5.2.1. DCVM vaccine prices ... 167
5.2.2. Explanatory variables ... 167
5.2.3. Statistical analysis ... 169
5.3. Results ... 175
5.3.1. Descriptive analysis ... 175
5.3.2. Mixed-effects regression model ... 182
16
5.4.1. Limitations ... 189
5.4.2. Conclusions ... 191
Discussion ... 193
6.1. Overall summary ... 193
6.2. Discussion of critical factors ... 196
6.2.1. Production scale and production scope ... 197
6.2.2. Other driving factors ... 198
6.3. Limitations and prospects for future studies ... 200
6.4. Conclusions ... 201
17
List of Figures
Figure 2.1 Pasteur Institutes worldwide in 2008.. ... 38
Figure 2.2 The economic concept of a tiered pricing mechanism. ... 40
Figure 2.3. Pneumococcal conjugate vaccine (PCV) introduction: high- and low-income markets. ... 44
Figure 2.4. Global vaccine sales by supplier (value) in 2012. ... 50
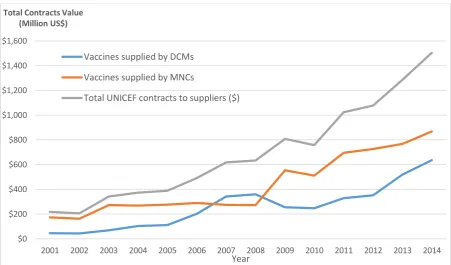
Figure 2.5. Supplier origins and values of UNICEF vaccine purchases over time (2001 – 2014).. ... 51
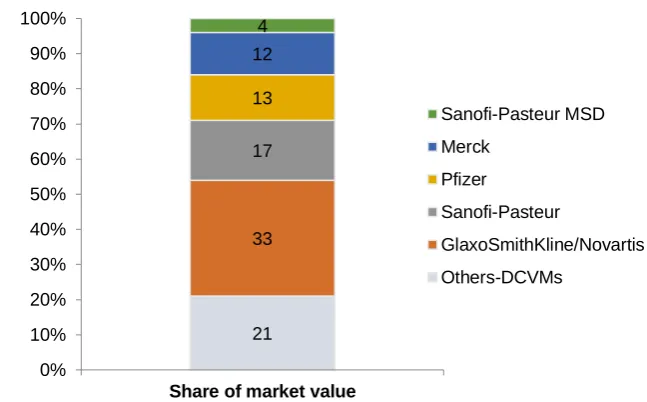
Figure 2.6. Share of global vaccine markets in 2014. ... 51
Figure 2.7. Comparison of share of global disease burden and population sizes, in 2000 and 2012... 52
Figure 2.8. Map of vaccine-producing countries in 2014. ... 54
Figure 2.9. The diversity of developing country manufacturers. ... 58
Figure 2.10. Global vaccine market (2000 – 2015). ... 59
Figure 2.11. Global production of prequalified vaccines (1986 – 2012). ... 60
Figure 2.12. Trend of supply to UNICEF vaccine markets ... 61
Figure 3.1. Process of vaccine development. ... 80
Figure 3.2. Calculations of fixed costs for vaccine facilities in developing countries, based on four hypothetical scenarios. ... 93
Figure 3.3. Estimations of R&D costs and success rate of vaccine production in developing countries. ... 94
Figure 3.4. Estimations of annualised capital cost-per-dose for vaccine produced in developing countries.. ... 95
18
Figure 3.6. Estimations of average cost-per-dose for vaccines produced in developing countries. ... 97
Figure 3.7. Estimations of economies of scale and economies of scope for costs-per-dose of vaccines produced in developing countries.. ... 99
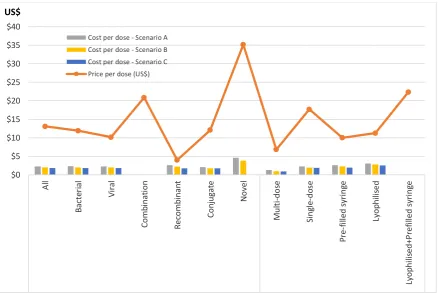
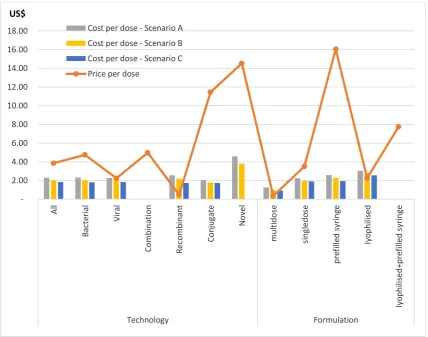
Figure 3.8. A comparison of estimated developing country vaccines’ costs-per-dose based on hypothetical Scenarios A, B and C to prices-per-dose paid by industrialised countries. ... 100
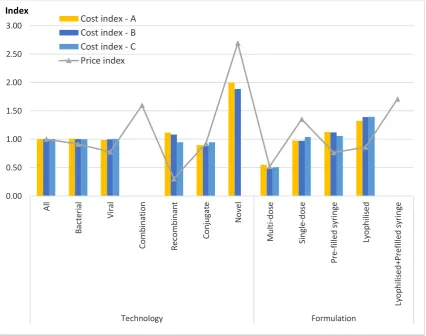
Figure 3.9. A comparison of estimated developing country vaccines’ cost index based on hypothetical Scenarios A, B and C to price index for industrialised country vaccine markets. ... 101
Figure 3.10. A comparison of estimated developing country vaccines’ costs-per-dose based on hypothetical Scenarios A, B and C to prices-per-dose paid by developing countries. ... 102
Figure 3.11. A comparison of estimated developing country vaccines’ cost index based on hypothetical Scenarios A, B and C to price index paid by developing countries.. ... 103
Figure 3.12. Estimated economic benefit of procuring antigens and filling compared to procuring finished vaccines. ... 104
Figure 4.1 Quantity share of UNICEF vaccine supply by manufacturing country type. ... 119
Figure 4.2. Source of vaccines supplied to UNICEF & PAHO (2014). ... 119
Figure 4.3. Volume of vaccines supplied to UNICEF & PAHO by vaccine and manufacturing country type (2014). ... 120
Figure 4.4 Vaccine production worldwide (2013). ... 120
Figure 4.5. Logarithmic transformations of outcome variables for vaccines produced by developing country manufacturers... 134
19
Figure 4.7 Post-estimation tests on residuals of regression of factors influencing developing country vaccine manufacturers’ revenue size in global markets (Model 1). ... 156
Figure 4.8 Post-estimation tests on residuals of regression of factors influencing developing country vaccine manufacturers’ revenue size in domestic markets (Model 2). ... 156
Figure 4.9 Post-estimation tests on residuals of regression of factors influencing developing country vaccine manufacturers’ revenue size in export markets (Model 3). ... 156
Figure 4.10 Post-estimation tests on residuals of regression of factors influencing developing country vaccine manufacturers’ percent market share in global markets (Model 4). ... 157
Figure 4.11 Post-estimation tests on residuals of regression of factors influencing developing country vaccine manufacturers’ percent market share in export markets (Model 5). ... 157
Figure 5.1. Logarithmic transformations of outcome and explanatory variables for vaccines produced by developing country manufacturers.. ... 171
Figure 5.2 Post-estimation tests on residuals of regression of factors associated with price per dose of overall vaccine types produced by developing country manufacturers (Model 1). ... 185
Figure 5.3 Post-estimation tests on residuals of regression of factors associated with price per dose of traditional vaccines produced by developing country manufacturers (Model 2).. ... 185
21
List of Tables
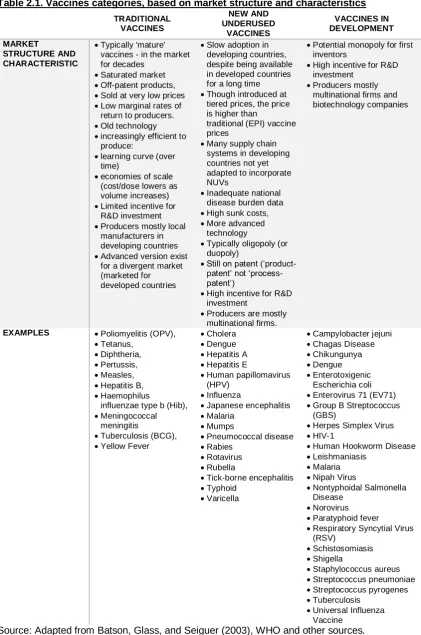
Table 2.1. Vaccines categories, based on market structure and characteristics ... 49
Table 2.2. Vaccine viability characteristics ... 57
Table 2.3. Summary of vaccine prices-per-dose sold by vaccine manufacturers to V3P-participating countries. ... 68
Table 3.1. List of experts consulted on questionnaire development ... 84
Table 3.2. Estimations of average cost-per-dose for vaccines produced in developing countries, with standard deviations. ... 96
Table 3.3. Cost index of vaccine production in developing countries, based on three hypothetical scenarios ... 98
Table 4.1. NRA functions depending on source of vaccines... 130
Table 4.2. Correlation matrix of explanatory variables associated with revenue sizes and percent market share of vaccines produced by developing country vaccine manufacturers ... 136
Table 4.3. Breusch-Pagan / Cook-Weisberg test for heteroscedasticity ... 136
Table 4.4 Revenue sizes and percent market shares of public vaccine markets supplied by developing country vaccine manufacturers (2012 – 2014)... 140
Table 4.5 Percent market share of developing country vaccine manufacturers in domestic markets (2012-2014) ... 146
Table 4.6 Summary and definition of outcome and explanatory variables ... 149
Table 4.7 Summary and definition of categorical explanatory variables ... 150
22
Table 4.9. Multivariate hierarchical linear regression of factors associated with revenue sizes and percent market share of vaccines produced by developing country vaccine manufacturers ... 155
Table 5.1. Univariate regression of factors associated with price per dose of vaccines produced by developing country manufacturers ... 172
Table 5.2. Correlation matrix of explanatory variables associated with price per dose of vaccines produced by developing country manufacturers... 173
Table 5.3. Breusch-Pagan / Cook-Weisberg test for heteroskedasticity... 173
Table 5.4 Summary and definition of outcome and explanatory variables of factors associated with price per dose of vaccines produced by developing country manufacturers. ... 176
Table 5.5 Summary and definition of categorical explanatory variables of factors associated with price per dose of vaccines produced by developing country manufacturers. ... 177
Table 5.6. Summary of vaccine prices-per-dose sold by developing country vaccine manufacturers to V3P participating countries. ... 179
Table 5.7. Average vaccine revenue based on sales of vaccines produced by developing country vaccine that were reported by V3P participating countries to WHO during 2005 – 2015 (US$ million) ... 180
Table 5.8. Univariate regression of factors associated with price per dose of vaccines produced by developing country manufacturers ... 181
Table 5.9. Multivariate mixed-effect linear regression of factors associated with price-per-dose of vaccines produced by developing country vaccine manufacturers ... 184
23
List of Appendices
Appendix 2.1. World Bank country classifications ... 71
25
List of Acronyms and Abbreviations
AMC Advance market commitment
BCG Bacillus Calmette–Guérin
BMFG Bill and Melinda Gates Foundation
BMBF Federal Ministry of Education and Research, Germany
CAPEX Capital expenditure
CIPIH Commission on Intellectual Property Rights, Innovation and Public Health
CVI Children’s Vaccine Initiative
DALY Disability Adjusted Life Years
DCVM Developing country vaccine manufacturers
DCVMN Developing Country Vaccine Manufacturers Network
DTP Diphtheria tetanus pertussis
EPI Expanded Program on Immunisation
GAVI Global Alliance for Vaccines and Immunization
GFCF Gross fixed capital formation
GMP Good manufacturing practices
GNI Gross National Income
GSPA-PHI Global Strategy and Plan of Action on Public Health, Innovation and Intellectual Property
GVAP Global Vaccine Action Plan
Hib Haemophilus influenzae type b
HIC High-income countries
HPV Human papillomavirus
ICVM Industrialised/developed country vaccine manufacturers
IPV Inactivated poliomyelitis vaccine
IVI International Vaccine Institute
JRF Joint Reporting Form
LMIC Lower-middle income country
Men-A Meningococcal strain A
MIC Middle income countries
MNC Multinational companies
MVA Manufacturing value added
NRA National Regulatory Authority
26
OPV Oral poliomyelitis vaccine
PAHO Pan American Health Organization
PATH Program for Appropriate Technology in Health
PCV Pneumococcal conjugate vaccine
PDVI Pediatric Dengue Vaccine Initiative
PPS Pneumococcal polysaccharide vaccine
PQ Prequalification
QC Quality control
R4D Results for Development
UMIC Upper-middle income country
UN United Nations
UNICEF United Nations Children's Fund
UNIDO United Nations Industrial Development Organization
V3P Vaccine Product, Price and Procurement
27
Introduction
1.1. Overview
Vaccines have been commended as one of the most cost-effective breakthroughs in
public health, only second to provision of clean water (WHO, 2003).Launched in 1974
to deliver vaccines against diphtheria, tetanus, pertussis, polio, measles and
tuberculosis, the expanded program for immunization (EPI) has saved approximately
20 million lives in the two decades that followed its launch (World Bank, 1993).Since
then, with the advances in biotechnology and immunology, increasing numbers of
vaccines are being developed and have become available. The adoption of these new
and underused vaccines (NUVs) into national immunisation programs however, has
not taken place in as timely a manner as expected.
The World Health Organization (WHO) estimates that to date 2 to 3 million deaths each
year are currently prevented through immunisation programs (WHO, 2016b) and that
there is increased access to new vaccines for low and middle income countries1.
However, despite these impressive achievements, the immunisation programs still face
major challenges, both in sustaining vaccination coverage levels as well as in ensuring
equal access to new and underused vaccines (NUV) in populations that need them
most, as much as 1.5 million vaccine-preventable deaths are still recorded (WHO,
2012, 2016b).
The WHO midterm review of the Global Vaccine Action Plan (GVAP) found that though
many countries have achieved the 2015 global immunisation target of 90%, the
average global immunisation coverage still falls short from achieving this target. These
coverage rates have only risen by 1% since 2010. Whilst 16 countries recorded
1 In 2015, 99 low and middle-income countries were recorded introducing one or more NUVs,
28
increases in their coverage levels, 26 countries reported no change and 25 countries
experienced a net decrease from their coverage levels in 2010 (WHO, 2016a).
Global vaccine supplies are essential in ensuring that the aims of immunisation
programs continue to be achieved, and in increasing accessibility to all populations
around the world. The UNs Sustainable Development Goals (SDGs) promote the
research and development of vaccines as a means to achieve universal health
coverage, and enable access to affordable quality medicines and vaccines (UNDP,
2016).
The vaccine markets in developing and developed countries are quite distinct in terms
of profitability, size and epidemiological needs. This poses a considerable challenge
for vaccine manufacturers to fulfil public health needs for both developing and
developed country markets in an equitable manner. WHO data show that profits and
revenues are mostly generated from vaccine markets in industrialised countries.
However, it is in developing country markets that population sizes and burdens of
disease are highest. If left to market forces, manufacturers will most likely opt to
produce vaccines for developed countries where profits are highest. This was
demonstrated in a 1990 report by the Commission on Health Research for
Development where a 10/90 gap was shown to exist (Milstien, Kaddar, & Kieny, 2006);
in that only 10 percent of the global budget for health research is allocated to research
and development (R&D) for 90 percent of the global health burden. Children in
developing countries therefore are not benefitting from vaccine technology advances
that have been accessible to those in developed countries.
Both policy-makers and manufacturers must address a mix of technological, political,
financial, and logistical issues that affect sustainable production in many developing
countries. This includes the impact of multilateral and bilateral trade agreements on the
29
trade barriers for national manufacturers. The development of a skilled local workforce,
through governmental incentives and education policies to prevent brain drain is
another consideration.
This thesis examined the supply and demand side barriers of vaccine production, which
are vaccine production costs and vaccine prices; and further, using revenue sizes and
percent market shares as proxies for viability, to assess the factors that are critical to
viability. This thesis applies economic concepts and methods in its assessments.
This research on the economic aspects of existing local vaccine producers will help
developing countries and global health advocates to better understand the factors
driving viability in regards to costs, revenue sizes and percent market shares as well
as prices. This may allow policymakers to navigate and develop policies that can
further support existing local vaccine producers and might assist other developing
countries that are considering investing into new local vaccine production.
1.2. Aims of the thesis
The overarching aim of this thesis was to investigate how existing vaccine
manufacturers in developing countries remain viable and what are the factors that are
critical for them to gain and sustain viability in the face of changes within global vaccine
markets. Critical factors for the viability of local vaccine production in developing
countries were assumed to encompass three areas related to commercial production
(McElliogott, 2009), these were: cost structures; revenue sizes and percent market
shares; and prices.
Several research questions need to be addressed in order to examine the aspects
surrounding viability of local vaccine production. These are:
Cost structure - What are the cost structures in establishing vaccine manufacturing
30
Percent market size and shares - How do vaccine viability factors influence the
revenue sizes and percent market share of DCVMs?;
Vaccine prices – How do procurement factors influence the prices of vaccines
supplied by developing countries?.
1.3. Background
Local producers supply over half of the vaccines used in developing countries’
immunisation programs and are recognised as important players in the industry (CVI
& WHO, 1999; Jadhav, Gautam, & Gairola, 2014). These vaccine manufacturers have
made huge strides over the past 30 years, expanding their production and switching
their focus from primarily domestic markets and traditional vaccines to becoming a
supplier of the global market by increasing capacity, improving facilities and developing
NUVs.
Public health advocates are highlighting DCVMs as a central part of their strategic
agenda in securing the global supply of vaccines (Hendriks, Holleman, de Boer, de
Jong, & Luytjes, 2011). They are seen not only as a means to ensure adequate supply
but also acknowledged for their important impact in influencing access to NUVs (WHO,
2011a). Much has changed from 30 years ago when the debate focused on whether
or not supplying vaccines produced in developing country facilities was a good idea
(UNIDO, 1986) (Muraskin, 1998).
A turning point in the prioritisation of DCVMs was during the emergence of the H5N1
influenza pandemic (Hendriks et al., 2011). In 20015, as requested by the World Health
Assembly2, the WHO together with its international and national partners developed
strategies to expand global vaccine manufacturing capabilities, particularly in
developing countries (Kieny et al., 2006). Among its strategies was the creation of a
2 The World Health Assembly is the decision-making body of WHO. It is an annual assembly of
31
hub model, which in contrast to a typical bilateral technology transfer arrangement, has
a single technology donor that transfers to multiple numbers of technology recipients.
The hub model managed to boost the global capacity of influenza vaccines, in an
unprecedented timeframe (Friede et al., 2011).
The importance of building capacity in developing countries to secure global supply of
vaccines has been increasingly high on the global health agenda. A large part of this has been achieved through technology transfer projects (Friede et al., 2011). Some examples of technology transfer projects include the NIH dengue vaccine technology to local manufacturers like Instituto Butantan, São Paulo, Brazil, Vabiotech, Hanoi, Vietnam and Panacea Biotec Inc., New Delhi, India, Serum Institute, Puna India.
1.4. Scope of the research
The overall scope of this thesis was the human vaccines3 market accessible to DCVMs
within the context of public health programs4. This includes both production and sales
of vaccines by DCVMs, limited to those used for immunisation programs5. These
include immunisation programs in developing countries and elsewhere.
The research questions examined by this thesis are specific to the viability of
public-market vaccine production that is owned6 by developing countries – and more
specifically, the critical factors influencing costs, revenue sizes and percent market
shares as well as vaccine prices. The critical factors relating to these three aspects are
analysed separately.
3 further referred to as ‘vaccines’
4 This will be referred to as national immunisation programs in this thesis.
5 Two markets exist for vaccines: public and private market. Public market vaccines are those
procured by governments and used in immunisation programs, while private market vaccines are procured by individuals and administered privately by health personnel. This thesis focuses on public-market vaccines only.
6 This thesis takes on production based on ownership as opposed to a location basis, where
32
This thesis refers to two groups of vaccine manufacturers, based on their country of
origin and income levels. These two groups are developing country vaccine
manufacturers (DCVMs)7 and developed/industrialised country vaccine manufacturers
(ICVMs). This thesis focuses on the vaccines market relevant to DCVMs only.
Therefore, though local producers8 also exists in developed countries9, the term local
production/local producers in this thesis refers only to DCVMs.
In this thesis, classification of countries follows the World Bank’s classifications based
on Gross National Income (GNI) per capita, using the Atlas method10 (Appendix 2.1).
These are: high income countries (HIC) ($12,736 or more), middle income countries
(MIC) (more than $1,045 but less than $12,736) and low income countries (LIC)
($1,045 or less). The term ‘developing countries’ refers to the latter two, while
‘developed countries’ refers to those in the HIC bracket. MIC countries are further
segregated by lower-middle (LMIC) and upper middle (UMIC) with a GNI per capita
threshold of $4,125. This thesis was not intended to study the difference between the
lower and upper middle groups in the middle income bracket but may refer to these
classes when needed. Furthermore, a network of DCVMs does exist, also known as
the Developing Country Vaccine Manufacturers Network (DCVMN), yet this thesis
refers to DCVMs based on their country status and not membership of the DCVMN11
because some DCVMN members include those that are no longer categorised as
developing countries.
7 DCMs are also often referred to as local producers and emerging suppliers.
8 Refers to manufacturers based in a country and majority of ownership is by an entity of that
country, either public or privately owned
9 Many local producers in developed countries however have become privatised, acquired or
dissolved, such as those in the Netherlands (RVIM/Bilthoven), Italy (Sclavo SpA), etc.
10 Using the Atlas methodology in calculating GNI reduces the impact of exchange rate
fluctuations caused by inflation. The Atlas conversion factor is based on the a country’s exchange rate, taken as an average of a given year and its two preceding years, and then adjusts the difference between the inflation rate of the country and at the international level (World Bank data methodology, 2016).
11 This thesis therefore excludes some DCVMN members that are developing countries which
33
An example of this would be the Republic of Korea (hereafter referred to as South
Korea). South Korea was classified in the past as a developing country, and is now
considered a HIC due to the rise in its national income level12. Two of its vaccine
manufactures however, are local producers13. Studies in the past, including some
recent studies have included Korean production when reviewing DCVMs. However, for
consistency, the countries included in the research are those that were classified as
either low or middle income in 2012 (the start of the study period), thereby excluding
South Korea. Of note, Argentina’s classification switched from middle income (2012 –
2013) to high income in 2014 but data from Argentina in 2014 were included in this
thesis as per the criterion described above. Furthermore, in Chapter 4, the DCVMs that
were present in the observed timeframe were all in countries that are classified as
middle income. This is partly due to progress and changes in the economic status of
these producing countries over time. It is also important to highlight that in Chapter 5
the panel dataset period is longer than mentioned above (2005 – 2015). The observed
manufacturers were still consistent however with those included in Chapter 4. As such,
the thesis includes DCVMs in countries that were classified as middle-income countries
in 2012.
1.5. Organisation of the thesis
Following on from this introductory chapter, which covers the aims and scope of the
research, the thesis is comprised of five subsequent chapters:
Chapter 2, presents a review of the existing literature to identify gaps in knowledge and
provide context for the research. The literature review focused on local production of
vaccines in developing countries, with a particular emphasis on vaccines supplied for
immunisation programs globally. The chapter provided the reasoning and background
12 GNI per capita is often referred to as national income level, while total GNI is referred to as
national income size.
13 One of these producers have now been acquired by a multinational, therefore only one
34
as to how local production of vaccines has emerged and contributed to the global
supply of vaccines, and discussed the economics and production process of vaccines,
providing the foundations on which the analyses in chapters 3, 4 and 5 were
established.
Chapter 3, “The cost structures of establishing new vaccine manufacturing facilities in
developing countries”, is the first of three analysis chapters. This chapter used a cost
analysis method to assess vaccine production costs in developing countries. Given the
sensitivity of the topic, the data were derived from a questionnaire with self-reported
responses and used cost ranges. The study used three hypothetical scenarios of
production scale and scope to enable comparative analysis. Data were generated from
eight vaccine manufacturers from different countries, which provided data for 12
vaccine products. The results included estimates of the costs-per-dose from fixed and
variable cost components, as well as the patterns of these costs overall and for a
number of cost drivers. The cost drivers analysed in this chapter were: production scale
and scope, vaccine technology types and vaccine formulations.
Chapter 4, “A multilevel modelling analysis of viability factors for vaccine production in
developing countries”, examined the viability determinants of developing country
vaccine production. A three-level hierarchical panel dataset14 for a three-year period
(2012 – 2014) was developed for this chapter. The dataset was compiled from
disaggregated panel datasets developed by WHO, the World Bank, UNICEF and other
relevant sources. Using global, domestic and export revenue sizes as well as global
and export market shares as proxies for viability, the influence of a range of determining
factors was analysed using multilevel regression.
14 level one: vaccine type; level two: manufacturer; level three: producing country. The data
35
Chapter 5, “A mixed-effects model of the association between procurement factors and
prices of vaccines produced by developing countries”, assessed the influence of
procurement factors on vaccine prices from developing country manufacturers. Using
a vaccine price database across 11 years (2005 – 2015), a mixed-effects regression
was undertaken. The analysis was conducted at the transactional level, and a
comparison was made between factors influencing prices of vaccines produced by
developing countries in general, as well as by technology level, defined as traditional
vaccine types and NUVs.
Chapter 6, “Discussion”, interpreted the findings of the analyses presented in chapters
3, 4 and 5 within the context of the overarching aim, examined their implications for
global vaccine manufacturing policy and practice, outlined the study limitations and
37
Background
2.1. Introduction
This chapter reviews the existing literature on vaccine production in developing
countries, particularly vaccines supplied to immunisation programs. The literature
review is organised in nine sections. The next two sections (2.2 and 2.3) provide a
historical perspective as well as the landscape of recent developments in vaccine
production that have shaped DCVMs. An overview of the economics of vaccines is
featured in section 2.4. This is then followed by sections 2.5 and 2.6 that present
studies on the merit and challenges of DCVMs and their production viability. The last
two sections of the chapter present existing literature on vaccine production costs and
vaccine prices. This chapter closes with a summary and rationale of the three specific
aims encompassing the thesis.
2.2. Historical perspective
Though there seems to be a clear divide at the present time between vaccine
producers in developing countries and those in the industrialised world, vaccine
producers before advent of the 21st century had many similarities, primarily in that they
were not established for profit gains. Vaccine production in the past was mainly a
government activity, and was meant to supply public health programs with newly
developed vaccines. Vaccine manufacturers were mostly research institutes, hospitals
and universities, while some were public-private, non-profit foundations such as the
Mérieux Biological Institute and the Pasteur Institute. (Milstien, Costa, Jadhav, &
Dhere, 2009; van Noort, 1992).
As for the production of vaccines in developing countries, this was mainly initiated
during the colonial era. During this period, international travel exposed citizens of
38
This, along with some non-colonized country requests15, instigated the Pasteur Institute
in France to establish laboratories in various developing countries as early as 1891
(Saigon, Vietnam) (Figure 2.1). Their mission was to research and develop products
such as the Bacillus Calmette–Guérin (BCG) and diphtheria–tetanus–pertussis (DTP)
vaccines as well as the rabies vaccine, anti-toxins and antivenins (Guénel, 1999)
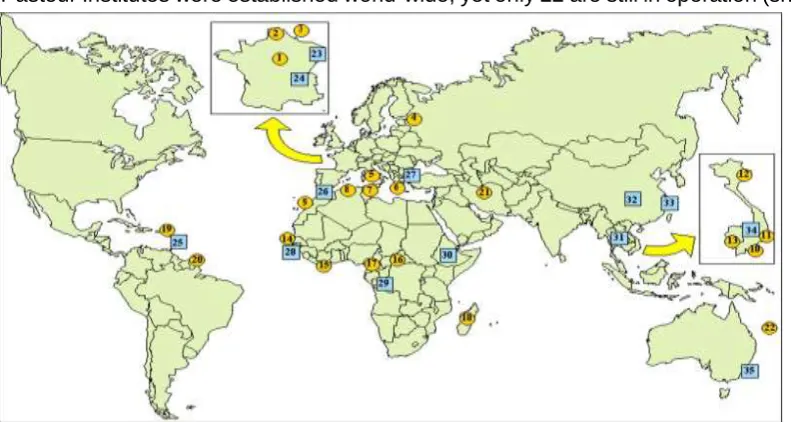
(Milstien et al., 2009). As documented by Dedet (2008) and shown in Figure 2.1, 57
[image:38.595.65.461.226.437.2]Pasteur Institutes were established world-wide, yet only 22 are still in operation (shown
Figure 2.1 Pasteur Institutes worldwide in 2008. Note:(Not shown are associate institutes and recent creations). Round symbols: 22 Pasteur Institutes still in operation: 1: Institut Pasteur (Paris, France); 2: Institut Pasteur de Lille (France); 3: Institut Pasteur du Brabant (now Brussels, Belgium); 4: Institut Pasteur de St. Petersbourg (Russia); 5: Institut Pasteur de Rome (Italy); 6: Institut Pasteur hellénique (Greece); 7: Institut Pasteur de Tunis (Tunisia); 8: Institut Pasteur d'Algérie; 9: Institut Pasteur du Maroc (Casablanca, Morocco); 10: Institut Pasteur de Saigon (now Ho Chi Minh City, Vietnam); 11: Institut Pasteur de Nhatrang (Vietnam); 12: Institut Pasteur d'Hanoi (Vietnam); 13: Institut Pasteur de Phnom Penh (Cambodia); 14: Institut Pasteur de Dakar (Senegal); 15: Institut Pasteur de Côte d'Ivoire (Abidjan, Ivory Coast); 16: Institut Pasteur de Bangui (Central African Republic); 17: Centre Pasteur de Yaoundé (Cameroon); 18: Institut Pasteur de Madagascar; 19: Institut Pasteur de Guadeloupe (French West Indies); 20: Institut Pasteur de Guyane française (French Guiana); 21: Institut Pasteur de Teheran (Iran); 22: Institut Pasteur de Nouvelle Calédonie (New Caledonia) Caledonia. Square symbols: 35 Pasteur Institutes which are no longer in existence: 23: Institut Pasteur de Strasbourg (France); 24: Institut Pasteur de Lyon (France); 25: Institut Pasteur de Martinique (French West Indies); 26: Institut Pasteur de Tanger (Tangiers, Morocco); 27: Institut impérial de Bactériologie de Constantinople (Turkey); 28: Institut Pasteur de Kindia (Guinea); 29: Institut Pasteur de Brazzaville (Congo); 30: Institut Pasteur d'Ethiopie (Addis Ababa, Ethiopia); 31: Institut Pasteur de Bangkok (Thailand); 32: Institut Pasteur de Chengdu (China); 33: Institut Pasteur de Shanghai (China); 34: Institut Pasteur de Dalat (Vietnam); 35: Institut Pasteur d'Australie (Sydney, Australia). Reproduced from Dedet (2008).
15 Iran, a non-western colony, requested that the Pasteur Institute in Paris establish a laboratory
39
as yellow circles in Figure 2.1), and 35 establishments (shown as blue squares in
Figure 2.1) no longer exist.
Many of the public manufacturers in Europe and the United States later became
privatised as a result of the various challenges faced. These challenges included
issues around production management, the need to acquire new technologies, as well
as the challenges to fulfil the progressing standards of good manufacturing practices
(GMP), where the GMP is a global regulatory standard in vaccine production practices.
A number of mergers and acquisitions then took place and have led to the emergence
of multinational (MNC) vaccine companies, which have now become the dominant
entities of the vaccines industry that we know today.
DCVMs have also evolved. After the 1960s, particularly with political developments
regarding sovereignty taking place within many developing countries, the status of
vaccine manufacturers such as Pasteur Institutes have changed. As a result of
negotiations with the Pasteur Institute in Paris, local institutions have either dissolved,
remained linked or continued without the Pasteur affiliation (Brès & Chambon, 1982);
(Milstien et al., 2009).
2.3. Landscape of recent developments in the vaccine market
Despite the success of immunisation programs established in the late 1970s, the
subsequent advances and discoveries of new vaccines have not been equally
accessible to developing countries. Mahoney and Maynard (1999) and Vandersmissen
(2001) note that vaccines typically take between 20 – 30 years from first licensing,
usually in the private market of developed countries, to reach the public markets in the
developing world. Prior to the last 15 years, NUVs were disproportionately available to
affluent countries, yet this has now changed thanks to the concerted efforts of public
40
2.3.1. Tiered pricing mechanism for vaccines
In 2000, WHO called for a movement towards equity pricing based on income level
classifications developed by the World Bank (WHO, 2001). The aim of this proposal
was to enable the lowest prices for the poorest countries.
Conceptually, in a tiered pricing mechanism producers charge different prices for
different units of the same product, yet not due to the differences in costs. Economic
theory suggest that producers are still gaining profit from differentiating prices because
it allows them to cater for 1) different buyers that are willing to pay a different amount
for the same product, and 2) a buyer who is willing to pay a different dollar amount for
different units of the same product. This way, a tiered pricing mechanism allows
[image:40.595.74.518.399.625.2]producers to capture some of the consumers' surplus that would otherwise go to buyers
(Figure 2.2).
Figure 2.2 The economic concept of a tiered pricing mechanism.
Multiple prices permit a seller to capture consumers’ surplus. As seen in Figure 2.2,
with differentiated prices, manufacturers may capture more of the consumers' surplus
41
The operation of tiered pricing is however dependent upon the ability of the producer
to segment the markets in which different prices are charged. Since vaccines are a
particular product which require certain conditions in their handling, leakage between
markets is quite difficult. From an economic efficiency perspective, the more tiers linked
to different prices and levels of development the better. Administratively however, the
more complicated the system, the more difficult it will be to police any system and
prevent parallel importation.
The use of a tiered pricing system allows licensed vaccines to be accessed by the
poorest countries without much delay. The rationale is that new vaccines can be made
available to developing countries reduced prices, because these are offset by higher
prices charged for the same product in more affluent markets. This way, manufacturers
can recover their investments while making the product available in developing country
markets at the same time.
The development and support for tiered pricing was essential in enabling early
introduction of newer vaccines in to the developing world. This mechanism was further
advocated and enforced through a body known as the Global Alliance for Vaccines and
Immunization (GAVI), which was established in January 2000. This alliance, later
known as the GAVI Alliance, focused its efforts on supporting countries to introduce
NUVs as well as support countries in strengthening their immunisation systems in
coping with the introduction of new vaccines. GAVI procures its vaccines in bulk
through UNICEF and PAHO’s pooled procurement mechanism. The prices of these
vaccine are usually already tiered, and tailored to different markets.
The success of tiered pricing was due to several factors. Firstly, the vaccines procured
in the 1980s and 1990s were mostly similar across markets, enabling vaccine
manufacturers to recoup their production costs by way of the tiered/differential pricing
42
countries, allowing for cost-recuperation while selling at lower and more affordable
prices to developing countries. This was done through the coordination of the United
Nations Children's Fund (UNICEF) and Pan American Health Organization (PAHO)
(Batson, 2005). Secondly, vaccine manufacturers tended to keep an excess production
capacity for many of the traditional vaccines, enabling them to supply vaccines at a low
price to developing countries without having to invest in expanding production capacity.
Thirdly, until the 1980s, the number of vaccine suppliers was large enough to maintain
competition, effectively keeping vaccine prices low. Lastly, as described by Plahte
(2005), tiered pricing, though often mistaken for a subsidy, in fact provides economic
benefits for all parties involved: consumers in the lower priced market benefit from
having access to a product that would not have otherwise been available; producers,
who gain a larger revenue and profit; and consumers in the higher-priced market, who
benefit from prices being slightly lower than if the tier-price mechanism wasn’t
introduced.
2.3.2. Market shaping strategies
As advances in biotechnology enabled new and more advanced vaccine products, the
demand for vaccines used in developed and developing countries however started to
differ, and the dynamics of the market changed even further. Immunization programs
in developed countries started to demand newer antigens and technology
advancements on existing vaccines, taking them further from the traditional set of
vaccines afforded by developing countries (Hausdorff, 1996).
Tiered pricing is very much dependent on homogenous immunization schedules and
demand across high and low income countries. Therefore, when vaccine requirements
differ between developed and developing countries, it becomes difficult to maintain
excess capacities and economies of scale, and in the end, price tiering becomes even
more difficult to sustain. This market divergence phenomenon later became more
43
strategies (Jarrett, 2008; Levine, Kremer, & Albright, 2005; Milstien, 2010; Milstien et
al., 2006).
In response to market divergence between high and low-income countries, a number
of market shaping strategies have been devised under the framework of push and pull
mechanisms. A push mechanism provides a guarantee (Berkley, 2014) for developers
to invest in R&D of a new drug; while pull mechanisms ensure that the product
developed will be purchased.
Though Kremer (2000) highlighted that there could be many risks to society in regards
to push mechanisms due to adverse selection and moral hazard, some initiatives that
have been developed based on the principles of push and pull mechanisms have
showed a significant influence in the vaccine market. An example with regards to pull
mechanisms is the advance market commitment (AMC), whereby a market is
essentially created ahead of time so that vaccine manufacturers are willing to sell their
vaccines at a price that would only be available at a much later timeframe. This strategy
has been used to support countries in producing the pneumococcal conjugate vaccine,
an NUV. The introduction time gap between high and low income countries was around
44
Figure 2.3. Pneumococcal conjugate vaccine (PCV) introduction: high- and low-income markets. International Vaccine Access Center (IVAC), Johns Hopkins Bloomberg School of Public Health. VIEW-hub Global Vaccine Introduction and Implementation Report, June 2016; and Batson (2014).
The practices of push mechanisms have also produced significant results, such as
through the development of the meningococcal strain A vaccine (Men-A) by the Serum
Institute of India and the more recent dengue vaccine developed by Sanofi Pasteur in
partnership with the International Vaccine Institute (IVI)’s Pediatric Dengue Vaccine
Initiative (PDVI) (IVI, 2006; Sanofi Pasteur, 2013). The PDVI receives support from the
Bill and Melinda Gates Foundation (BMGF), a major financier and investor in public
health. While the market-shaping strategy for the Men-A vaccine, which was also
supported by the BMGF, in its tendering process attracted many vaccine
manufacturers including DCVMs16.
Vaccines are also procured for the private markets in developing countries. Private
markets are estimated to account for 5–10% of total vaccine sales in developing
countries (WHO, 2016d). Private-sector demand mainly consists of more affluent
16 Personal communication with SII representative.
0% 10% 20% 30% 40% 50% 60% 70% 80% 90% 100%
0 2 4 6 8 10 12 14 16 18 20 22 24 26
Pe rc e n ta g e o f c o u n tr ie s th a t h a v e u n iv e rs a ll y i n tr o d u c e d v a c c in e
Years since first introduction
High-income markets Low-income
markets
45
population segments in developing countries that decide to take on responsibility for
their own immunization, using preferred presentations not offered by the public sector.
The private sector plays a generally small role on the demand side of vaccines except
in some populated countries with rapid economic growth, where demand from middle
classes for new and non-EPI vaccines can be of significant value.
In recent decades, the importance of building capacity for vaccine production in
developing countries has increased, particularly with the re-emergence of a highly
pathogenic avian influenza (Hendriks et al., 2011). The Fifty-eighth World Health
Assembly in 2005 (resolution WHA58.5) requested WHO to seek ways that would
reduce the global shortage of influenza vaccines for both epidemics and pandemics,
and encourage more R&D into new and improved vaccines (Friede et al., 2011).
Among the resulting efforts, WHO supported the expansion of global manufacturing
capability, particularly in developing countries, by creating a hub model for the
technology transfer of influenza vaccines, which boosted the global capacity in an
unprecedented timeframe. The Bill and Melinda Gates Foundation, a prominent
supporter of global health, is in the midst of commissioning studies focusing on
developing countries’ vaccine production and related costs (Shulman, 2014) (BMGF,
2014). The Federal Ministry of Education and Research (BMBF) in Germany has also
invested in developing countries’ vaccine production and capacity building, by
supporting dengue vaccine production in Brazil and Vietnam (IVI, 2014). In addition,
preliminary discussions are also underway to review the potential of increasing the
capacity of local production in disproportionately low vaccine-producing regions,
through initiatives such as the African Vaccine Manufacturing Initiative (AVMI) (KPMG
46
2.4. The economics of local vaccine production
To fully understand how changes in the vaccine market have taken effect, it is important
to understand the characteristics that make vaccines distinct from other pharmaceutical
products.
Vaccines are a type of pharmaceutical product that are of a biological nature and are
typically used for disease prevention rather than treatment or cure (Milstien, Batson, &
Wertheimer, 2005). Widespread use of certain vaccines has eliminated infectious
diseases such as smallpox, and substantially reduced the incidence and mortality of
respiratory infections associated with measles and pertussis; vaccines have the
potential to protect unvaccinated people by reducing the circulation of infectious agents
through a process called herd immunity.
The definition of a vaccine provided by the WHO is as follows: “A vaccine is a biological
preparation that improves immunity to a particular disease. A vaccine typically contains
an agent that resembles a disease-causing microorganism, and is often made from
weakened or killed forms of the microbe, its toxins or one of its surface proteins. The
agent stimulates the body's immune system to recognize the agent as foreign, destroy
it, and "remember" it, so that the immune system can more easily recognize and
destroy any of these microorganisms that it later encounters.” These characteristics of
vaccines affect their production and the market in which they are supplied, in multiple
ways.
First is the vaccine’s biological nature and the fact that it is mainly administered to
healthy individuals from populations that are often vulnerable17. This poses strong
imperative on ensuring vaccine safety and efficacy, resulting in strict regulatory
47
requirements for license approval that are often more stringent compared to other
pharmaceutical products18.
Second, as a public health instrument, the major purchasers of vaccines are usually
governments. The use of public funds therefore, puts much pressure on the prices at
which a manufacturer is able to sell its vaccines. These two pressures alone have led
many manufacturers in the past to find the vaccine market unattractive, and to decide
to leave the market (M. V. Pauly, 2005), leading to a higher level of market imperfection
and market concentration (P. Danzon & Pereira, 2005; Hendriks, 2012).
Third, the capital cost in producing vaccines, similar to other pharmaceuticals, is high;
while compared to other pharmaceuticals products, the profit margins for vaccines are
lower. Further, despite the lower dosage usually required for vaccines, the level of
pricing that can be charged, particularly in developing countries, is significantly lower
compared to other biologicals (Prifti, 2010; Sinclair, Latham, Wen, Ellis, and Pujar,
2015).
Finally, vaccines with different antigens have different markets that often do not overlap
with one another19 (Arnould & DeBrock, 1996), resulting in high market concentrations
within individual vaccine markets. Currently licensed vaccines prevent against up to 25
different diseases, while the number of vaccine products available are much higher
given that some are combination vaccines while some are formulated for different age
18 There is no concept of a true generic product for vaccines. A vaccine made in a new facility
is treated as a new vaccine and has to undergo rigorous preclinical and clinical studies to be approved for use, often requiring a dedicated facility for its manufacturing. Unlike drugs, where generics are made and licensed based on chemical equivalence, a simple bioequivalence is not adequate proof that a vaccine will be safe and efficacious. The implication of this is that producing a copy of an existing vaccine is still expensive and time consuming.
19 Vaccine product that do not overlap with one another are those catered for distinctive
48
groups and geographical needs20 (Smith, Lipsitch, & Almond, 2011) most of which
become individual markets that do not compete with one another. Demand for a
pentavalent vaccine (DTP, Hepatitis B and Hib) may not be equivalent to the demand
for a quadrivalent vaccine (DTP and Hepatitis B only). Further, vaccine production
involves a large range of biological agents, which allows very limited standardization
of production process and outputs (Wang & Singh, 2013). In manufacturing a vaccine,
the goal is to develop a process that can consistently produce vaccines that are safe
and efficacious. This starts at the vaccine discovery stage, and up to the clinical study
and commercial supply stages in which the requirement is that the vaccine can
preserve the defined immunological properties from the discovery stage (Pujar et al.,
2014).
Sinclair et al. (2015) suggest that the capital required to produce vaccines is higher
than for other pharmaceutical products. They reported that the capital intensity21 of the
biopharmaceutical industry, calculated as a percentage capital expenditure divided by
total revenue, was 12.4%, which was much higher than the general pharmaceutical
sector at 9%. This high capital intensity might explain the high costs of manufacturing
vaccines, whilst indicating that cost reductions will be difficult to achieve. Sinclair et al.
(2015) suggested that if manufacturing capital requirements do not change, the capital
intensity value will increase further as health care providers and competitive products
put increasing pressure on biopharmaceutical and vaccine pricing.
Vaccines can be generally differentiated into three different groups, based on their
market structure and characteristics (Table 2.1).
20 Examples of vaccines for different age groups are the Pneumococcal conjugate (PCV)
vaccine for infants and the Pneumococcal polysaccharide (PPS) vaccine for adolescents and adults. While examples of vaccines for different geographical needs are the Meningococcal strain C (Men-C) vaccine for UK and Australia; and the Meningococcal strain A (Men-A) vaccine for the African region.
21 The level of capital intensity measures the amount of capital required per dollar of revenue