S H O R T R E P O R T
Open Access
Validation of reference genes for quantitative
RT-qPCR studies of gene expression in Atlantic
cod (
Gadus morhua l
.) during temperature stress
Ingrid A Aursnes
1, Anne L Rishovd
1, Hans E Karlsen
2and Tor Gjøen
1*Abstract
Background:One important physiological response to environmental stress in animals is change in gene
expression. To obtain reliable data from gene expression studies using RT-qPCR it is important to evaluate a set of possible reference genes as normalizers for expression. The expression of these candidate genes should be analyzed in the relevant tissues during normal and stressed situations. To find suitable reference genes it was crucial that the genes were stably expressed also during a situation of physiological stress. For poikilotermic animals like cod, changes in temperature are normal, but if the changes are faster than physiological
compensation, the animals respond with typical stress responses. It has previously been shown that Atlantic cod show stress responses when elevation of water temperature is faster than 1 degree/day, for this reason we chose hyperthermia as stress agent for this experiment.
Findings:We here describe the expression of eight candidate reference genes from Atlantic cod (Gadus morhua l.) and their stability during thermal stress (temperature elevation of one degree C/day for 5 days). The genes investigated were: Eukaryotic elongation factor 1 alpha,ef1a; 18s ribosomal RNA;18s, Ubiquitin conjugate protein;
ubiq, cytoskeletal beta-actin;actb, major histcompatibility complex I; MHC-I light chain, beta-2 -microglobulin; b2m, cytoskeletal alpha-tubulin;tba1c, acidic ribosomal phosphoprotein;rplp1, glucose-6-phosphate dehydrogenase;
g6pd. Their expression were analyzed in 6 tissues (liver, head kidney, intestine, spleen, heart and gills) from cods exposed to elevated temperature and compared to a control group. Although there were variations between tissues with respect to reference gene stability, four transcripts were more consistent than the others:ubiq,ef1a,
18sandrplp1. We therefore used these to analyze the expression of stress related genes (heat shock proteins) induced during hyperthermia. We found that both transcripts were significantly upregulated in several tissues in fish exposed to increased temperature.
Conclusion:This is the first study comparing reference genes for RT-qPCR analyses of expression during
hyperthermia in Atlantic cod.ef1a, 18s, rplp1 andubiq transcripts were found to be well suited as reference genes during these experimental conditions.
Findings
A good reference gene should be expressed in detectable amounts without too much variation between tissues. We have investigated the expression stability of eight genes, commonly used as reference genes, for internal control in experiments. Five of these genes (Eukaryotic elongation factor 1 alpha,ef1a; 18s ribosomal RNA;18s,
Ubiquitin conjugate protein; ubiq, cytoskeletal beta-actin;actb, acidic ribosomal phosphoprotein;rplp1, are in common with the previous study [1] and three genes have not been tested before in cod. The experimental conditions in this setting were tissue samples from wild Atlantic cod exposed to hyperthermia.
The chosen genes have different tasks in the cell;ubiq
is a protein involved with degradation of cellular pro-teins, tba1candactb are both parts of the cytoskeleton.
b2m is part of the MHC I complex on cell surface.
rplp1,ef1a and18s are all involved in protein synthesis. * Correspondence: [email protected]
1
Department of Pharmaceutical Biosciences, School of Pharmacy, University of Oslo, PO Box 1068 Blindern, 0316 Oslo, Norway
Full list of author information is available at the end of the article
Acidic ribosomal proteins are conserved phosphoproteins involved in the translation process and may therefore be co-regulated withef1a [2]. Glucose-6-phosphate dehy-drogenase (g6pd) is a cytosolic enzyme that takes part in the pentose phosphate pathway. In this selection of genes it is possible that some co-regulation may occur, and it is important to keep this in mind when evaluating the geN-orm results. The stress response induced by hyperther-mia was confirmed by expression analysis of two heat shock proteins, HSP70 and HSP90AA.
Materials and methods
Atlantic cod (size 300-500 g) were obtained from fish traps in the Oslofjord and kept in 0.3 m3 tanks with running seawater. The animals were divided in two experimental groups containing five wild fishes in each group. The fish in the heat stress group were kept in a pool of water in which the temperature was elevated with 1 degree each day, during a period of 5 days. The starting temperature was 11°C and after five days of heating the water temperature was 17°C. The fish in the control group were kept in a similar tank with stable temperature to minimize the differences in general stress from animal housing.
Fish were killed after 5 days and tissue samples were taken from heart, spleen, head kidney, small intestine, gills and liver and put directly into RNA-later and fro-zen (-20°C) until further analysis. All animal experi-ments were conducted in accordance with the Norwegian Animal Welfare Act of 1977, and the Regu-lation of Animal Experimentation of 1996.
RNA extraction
The tissue samples were mixed with beads and homoge-nized by a rapid vibration in a Precellys 24 (Bertin Technologies, France). Total RNA were extracted from the tissue samples using the RNeasy Mini Kit with on column RNase-free DNase set (Qiagen). The protocol was according to the manufacturer. Duplicates of cDNA were made from 2 ug total RNA using High Capacity RNA-to-cDNA Master Mix, 4 × 96-Well Plate (ABI) and after the manufacturer’s protocol.
Genes and primers
Atlantic cod ESTs representing the genes to be analyzed (see Table 1) were obtained by tblastn searching the respective protein sequences from the TIGR zebrafish (Danio rerio) [3] against Genbank [4] or Codgene [5]. The chosen target genes were heat shock protein 70 (hsp70) and heat shock protein 90 alpha (hsp90).
Primer design
Primers (Table 1) were designed using the Roche Diag-nostics primer design software and synthesized by
InVitrogen (Carlsbad, USA). Primer efficiencies(E) were calculated from 10-fold dilution series to make standard curves from with E was calculated according to the for-mula E = 10-1/slope. The specificity of the primer sets used was confirmed by the presence of a single band of correct size on gel electrophoresis in addition to the presence of a single peak in the dissociation curve analysis.
RT-qPCR
RT-qPCR was performed in duplicates in 96-well plates on Lightcycler 480 (Roche Diagnostics). SYBR Green Master Mix with cDNA made from 2 ug RNA and diluted 1:50 before added to the PCR reaction, except for18s which were used in a 1:1000 dilution. Crossing point values (Cp) values were obtained from the RT-qPCR instrument by employing the second derivative maximum method of LightCycler480 (Roche Diagnos-tics). The general guidelines for RT-qPCR experiments called“MIQE [6].
Analyzes reference genes
A number of mathematical models have been developed to strengthen the normalization with reference genes. Examples of these are geNorm [7], Normfinder [8] and Bestkeeper [9]. GeNorm is restricted to reference gene analysis and eliminates the worst gene in a set of genes according to their expression stability. GeNorm perform a pair-wise variation of each combination of the genes and the highest expression stability gives the lowest M value. The least stable gene is eliminated until the two most stable genes remains. Instead of analyzing the whole data set, Normfinder focuses on the expression variations both between treatment groups and inside one group, in a model-based approach of mixed linear effect modeling. And finally, Bestkeeper analyze the variability of the dataset and also compare all genes against each other in pair-wise correlations, and also pair-wise correlation against the Bestkeeper index. Best-keeper also have the ability to do a target gene analysis.
The Relative Expression Software Tool (REST) [10] was used to compare the hepatic expression of two tar-get genes (hsp70 andhsp90) in the two groups relative to each of the reference genes.
Results
therefore the only genes with low level of variance in both groups. To analyze the data further, we used the tree software packages developed for analysis of refer-ence gene stability; geNorm, Normfinder and Best-keeper. These programs use different algorithms to determine the most stable reference gene, and should be
used together for identification of the most stable genes or gene combinations.
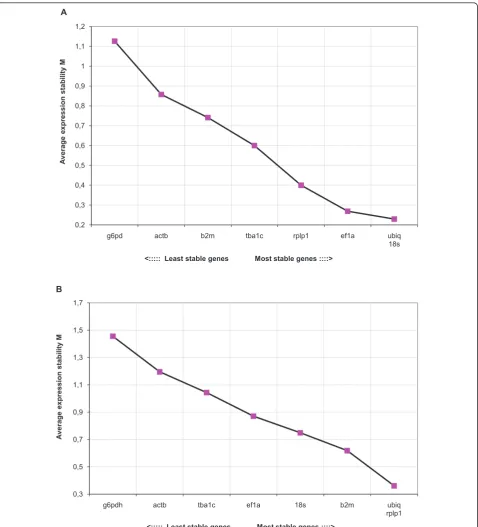
GeNorm
When expression levels in tissues were analyzed separately in both treatment groups, the genes in the control group in general displayed higher stability (M) compared to the stress group. The results from analyzing data from all tis-sues revealed thatubiqwas most stable in both control and stress group (Figure 2A and 2B, Table 2). In addition,
ubiqwas ranked as the best reference gene in at least one of the treatment groups in all tissues analyzed. The results from all individual tissues are summarized in Table 2. Genorm also calculates the pair wise variation between two sequential normalization factors (reference genes) NFnand NFn+1, reflecting the effect of including more
than 2 reference genes in the normalization. High NFn
/NFn+1value mean a significant effect of including an
additional gene in the calculations. Additional file 1 shows these ratios for inclusion of additional genes were lower for control (Panel A) than for the stress group (Panel B). In the control group 2 reference genes were sufficient (V2/3 < 0.15) whereas in the stress group a more reliable normalization will be obtained by inclusion of more ence genes, as expected. For practical purposes, 3 refer-ence genes will normally be sufficient [7].
Normfinder
Expression data from tissues were analyzed both separately and pooled. In liver tissue,ubiqandactbwere the two most stable reference genes according to Normfinder (Figure 3).
ef1aandubiqwere also most frequently among the the 3 most stable genes in the separate tissues (Table 3). However, when data from all tissues in both experimental groups were pooled and analyzed,rplp1was the most stable gene.
Bestkeeper
[image:3.595.57.542.100.236.2]Bestkeeper performs a correlation analysis of Cp values and ranked the genes from pooled data from all Table 1 Primers for RTqPCR used in the present study
Gene Accesion # Primer forward Primer reverse E. Amplicon size
rplp1 EX741373 tccaaaccctaaaatccaaca tggaggatcagagcagagtaaa 1,89 77
actb AJ555463 acaccgtgcccatctacg ccaagtccagacggaggat 2,05 60
b2m acc386599 gagcccaacaccctgatct gctcgatggtgatctctgg 2,11 61
ef1a DQ402371 caggtcatcatcctgaacca atccaggactggggcatag 2,02 60
g6pd EX741924 acactctgcaccagggagtc ccactgctgcaccacatc 1,88 98
tba1c EL616694 ctccaccaggaactacagtgg tagactggtgcccaactggt 2,10 69
ubiq EX735613 cattgagccttccctcagaa ttgcggcagatcatcttgt 1,98 63
18s AJ427629 tgtgccgctagaggtgaaatt gcaaatgctttcgctttcg 2,03 61
hsp70 ES478099 ggagttcaagcggaagttca agcctcctcaaagccctct 1,87 60
hsp90 ES783928 tcctccgatactacacctcca gcgagacacgtagtccttga 1,98 65
Reference andhsp’sgene primer sequences, amplicon sizes, amplification efficiency values and accession # for the PCR analyses in the present study.
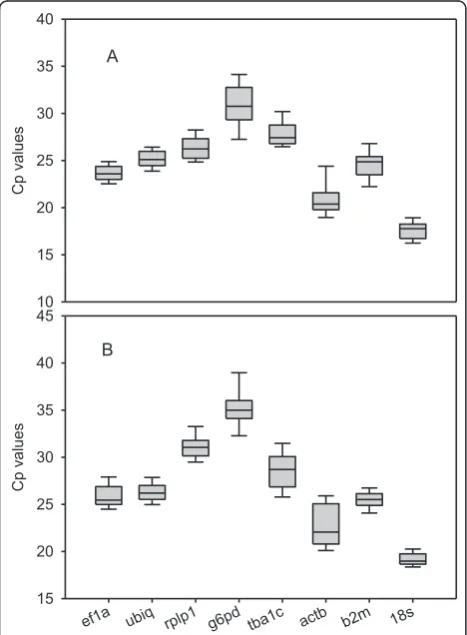
Cp v
alues
10 15 20 25 30 35 40
A
ef1a ubiq rplp1 g6pd tba1c actb b2m 18s
Cp v
alues
15 20 25 30 35 40 45
B
[image:3.595.57.291.346.664.2]samples in following order, from most stable to least stable; actb>g6pd>rplp1>ubiq>ef1a>tba1c>18s>b2m. As can be seen from Table 4 all reference genes inves-tigated were positively correlated to each other and the highest correlations were found between rplp1/
g6pd (r = 0,981) and ef1a/g6pd (r = 0,929). This method therefore ranked the reference genes some-what different than geNorm and Normfinder, but
rplp1 and ubiq were still among the four best suited reference genes.
0,2 0,3 0,4 0,5 0,6 0,7 0,8 0,9 1 1,1 1,2
g6pd actb b2m tba1c rplp1 ef1a ubiq
18s
A
v
er
age
expression stability
M
<::::: Least stable genes Most stable genes ::::> A
0,3 0,5 0,7 0,9 1,1 1,3 1,5 1,7
g6pdh actb tba1c ef1a 18s b2m ubiq
rplp1
A
v
er
age
expression stability
M
[image:4.595.60.539.87.615.2]<::::: Least stable genes Most stable genes ::::> B
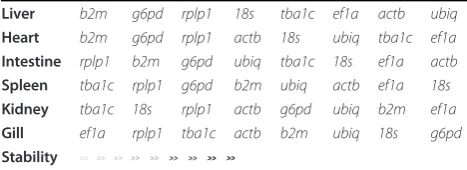
Expression of heat shock proteins
The packages use different algorithms to determine the most stable reference genes. The selection of genes for further use is therefore a result of choosing the genes that overall got the highest ranking by all software packages. Four genes that were ranked high in stability by all three tools wereef1a,rplp1,18sand ubiq.
To confirm that the fishes in the heat stress group actually experienced a stress reaction we analyzed the expression of two of the heat shock proteins (obtained from cod sequence databases). Alignment of the trans-lated HSP70 sequence from which primers were con-structed with similar proteins from human and other fishes (Additional file 2 and 3) revealed similarity to heat inducible HSP70’s from other fishes [11]. The cod sequence grouped together with inducible HSP70’s from several fish species and not with the cognate (constitu-tive) human HSPA8 protein [12]. In a similar fashion we aligned the cod HSP90 sequence with fish and human homologs and made a phylogenetic tree by
maximum likelihood method as for HSP70 sequences (Additional file 4 and 5). Cod HSP90 grouped together with other inducible fish HSP90AA’s, and not with the constitutive HSP90AB proteins [13]. The effect of hyperthermia on these transcripts was then analyzed by RT-qPCR using the each of the investigated reference genes as normalizers. Figure 4 shows that the two heat shock genes were induced relative to all normalizers, exceptb2m, the most unstable reference gene in liver, according to the Normfinder analysis (Table 3), indicat-ing that this transcript was induced even more by hyperthermia.
Discussion
[image:5.595.58.539.100.211.2]Previous studies on hyperthermia in cod have shown that both acute and long term exposure to elevated tem-peratures induce stress responses in cod [14,15] includ-ing changes in gene expression [15]. Olsvik et al has investigated suitable reference genes for wild popula-tions of Atlantic cod with focus on gene stability in fish living in contaminated areas. Using geNorm and Norm-finder they found thatubiq(ubiquitin)and rplp1 (called arp in their article) was the most suitable reference genes for wild populations [1,16]. Similarly, during onto-geny in cod larva,ubiq (ubiquitin)was also found to be the most stable reference gene [16]. Optimally, genes from different biological pathways should be selected to minimize the effects of genes co-regulation [6]. The reference genes used in this trial were chosen on the Table 2 GeNorm ranking of the reference genes stability in all investigated tissues
Best gene 2ndbest 3rdbest 4thbest
Stress Control Stress Control Stress Control Stress Control
Liver rplp1/ef1a rplp1/ubiq 18s tba1c g6pd g6pd actb actb
Heart ubiq/ef1a ubiq/18s 18s rplp1 rplp1 actb actb ef1a
Intestine actb/ubiq g6pd/18s ef1a rplp1 rplp1 ef1a tba1c actb
Spleen rplp1/ubiq actb/ubiq 18s tba1c ef1a rplp1 actb 18s
Kidney ubiq/ef1a rplp1/ef1a rplp1 g6pd b2m tba1c 18s ubiq
Gill g6pd/actb tba1c/ubiq ubiq rplp1 tba1c ef1a 18s actb
Pooled tissues ubiq/rplp1 ubiq/18s b2m ef1a 18s rplp1 ef1a tba1c
Stability ranking of individual reference genes in different tissues from Atlantic cod under control (stable temperature) or stress situation (temperature increase of 1?C/day for 5 days) conditions.
[image:5.595.57.292.498.664.2]Figure 3 Normfinder analysis of reference genes in liver. Ranking of the reference genes stability of all 70 tissue samples (heart, spleen, head kidney, small intestine, gills and liver) from both groups. The analysis was also done after pooling the data from all tissues. According to the Normfinder software, a low average stability value indicates more stable expression.
Table 3 Normfinder ranking of gene stability in individual tissues
Liver b2m g6pd rplp1 18s tba1c ef1a actb ubiq
Heart b2m g6pd rplp1 actb 18s ubiq tba1c ef1a
Intestine rplp1 b2m g6pd ubiq tba1c 18s ef1a actb
Spleen tba1c rplp1 g6pd b2m ubiq actb ef1a 18s
Kidney tba1c 18s rplp1 actb g6pd ubiq b2m ef1a
Gill ef1a rplp1 tba1c actb b2m ubiq 18s g6pd
Stability
[image:5.595.304.538.627.712.2]Table 4 Bestkeeper analysis of reference genes from Atlantic cod
Pearson correlation coefficient (r)
rplp1 g6pd tba1c actb b2m ubiq ef1a 18s
vs. HKG 1 HKG 2 HKG 3 HKG 4 HKG 5 HKG 6 HKG 7 HKG 8
g6pd 0,981 - - -
-p-value 0,001 - - -
-tba1c 0,685 0,688 - - -
-p-value 0,029 0,028 - - -
-actb 0,865 0,885 0,853 - - - -
-p-value 0,001 0,001 0,002 - - - -
-b2m 0,012 0,081 0,284 0,390 - - -
-p-value 0,977 0,824 0,425 0,264 - - -
-ubiq 0,857 0,800 0,765 0,868 0,297 - -
-p-value 0,002 0,005 0,010 0,001 0,405 - -
-ef1a 0,922 0,929 0,592 0,754 -0,147 0,707 -
-p-value 0,001 0,001 0,071 0,012 0,686 0,022 -
-18s 0,537 0,516 0,647 0,600 0,276 0,676 0,573
-p-value 0,110 0,128 0,043 0,067 0,441 0,032 0,083
-RANK 3 2 6 1 8 4 5 7
BestKeeper vs. rplp1 g6pd tba1c actb b2m ubiq ef1a 18s
coeff. of corr. [r] 0,950 0,954 0,816 0,960 0,265 0,912 0,871 0,683
p-value 0,001 0,001 0,004 0,001 0,458 0,001 0,001 0,030
Bestkeeper analysis of candidate reference genes from various tissues in Atlantic cod. Pair wise correlation analysis showing Pearson correlation coefficient (r) and the value of probability, p. Pair of genes with r > 0,80 in bold.
0 1 10 100
hsp70 hsp90 hsp70 hsp90 hsp70 hsp90 hsp70 hsp90 hsp70 hsp90 hsp70 hsp90 hsp70 hsp90 hsp70 hsp90 18s rplp1 b2m actb ef1a g6pdh tba1c ubiq
R
e
la
tiv
e
g
e
ne
re
gula
tion (Log
sc
ale)
[image:6.595.60.542.400.722.2]basis of sequence availability for the cod genome and previous studies in cod [1] and other species [17-20]. If the genes chosen are included in the same biological pathway this may interfere with the analysis. This is because the software performs pair wise comparisons of gene expression across the various samples. Co-expressed genes will therefore most probably have similar expression patterns. If the genes are co-regulated in the same pathway geNorm tend to assign good score because it uses a pair wise comparison approach. This is important to keep in mind when interpreting the results. In this situation a model-based evaluation like Normfin-der would be a better choice.
When comparing the results from geNorm, Normfin-der and Bestkeeper, rplp1 and ubiq were the genes ranked with the highest expression stability by all the three methods. These results are in line with previously tested reference genes from Atlantic cod [1]. In six tis-sues from four different populations of cod, ef1a, rplp1
andubiq (in addition to three ribosomal proteins) were found to be the most stable reference genes. The poor performance of the widely usedactbandg6pdis in line with studies in other fish species [17,20,21].
However, it is important to take into consideration that reference genes that are stable in one species under one type of stress may be induced or repressed in other species during the same conditions [20]. Bothhsp70andhsp90
were induced relative to the most stable reference genes identified in this study. Although hyperthermia induced expression ofhsp70has been shown in many species [22,23], it has also previously been demonstrated that a rise in temperature of 1°C/day from 11 to 16.5°C does not increase western blot detectable hsp70 in Atlantic cod [24]. The reason for this discrepancy between protein and mRNA from two comparable studies is uncertain, but there are at least 2 isoforms of hsp70 where one is consti-tutive and one is stress induced [25].
Conclusions
This is the first study that evaluates a suitable set of reference genes during hyperthermia in Atlantic Cod. From different types of software analyses at least 2-3 reference genes should be used and the most suitable reference genes under these experimental conditions were18s, ef1a,rplp1andubiq.
Additional material
Additional file 1: Determination of optimal number of genes for normalization. Pairwise variation analysis (Vn/n+1) between two sequential normalization factors (reference genes) NFnand NFn+1to determine the optimal number of reference genes for accurate normalization in control group (Panel A) and stress group (Panel B). Low pairwise variation (< 0.15) indicates no requirement for additional reference genes.
Additional file 2: Alignment of partial HSP70 sequences. Alignment of partial HSP70 sequences from various fish and mammals. Dots indicate identity. Sequences are from Danio rerio (Dre) BC056709.1, Caarassius auratus (Cau) AB = 92839.2, Cyprinus carpio (Cca) AY120894.1, Oreochromis niloticus (Oni) FJ213839.1, Xiphophorus maculatus (Xma) AB062114.1 = HSP70-2 and AB062113.1 = HSP70-1, Oncorhynchus mykiss (Omy) AB062281.1, Salmo salar (Ssa) BT046112.1, Paralichthys olivaceus (Pol) DQ662230.1, Homo sapiens (Hsa) AAH07276.2. = HSP1A, and ENSP 00000227378 = HSPA8.
Additional file 3: Phylogenetic tree of HSP 70 sequences. Phylogenetic tree showing relationship between several fish and 2 mammalian HSP70 proteins using maximum likelihood method. Bootstrap values are shown on the branches and scale for branch length (0.05 substitutions/site). Sequences are from Danio rerio (Dre)
BC056709.1, Caarassius auratus (Cau) AB = 92839.2, Cyprinus carpio (Cca) AY120894.1, Oreochromis niloticus (Oni) FJ213839.1, Xiphophorus maculatus (Xma) AB062114.1 = HSP70-2 and AB062113.1 = HSP70-1, Oncorhynchus mykiss (Omy) AB062281.1, Salmo salar (Ssa) BT046112.1, Paralichthys olivaceus (Pol) DQ662230.1, Homo sapiens (Hsa) AAH07276.2. = HSP1A, and ENSP 00000227378 = HSPA8.
Additional file 4: Alignment of partial HSP90 sequences. Alignment of partial HSP90 sequences from various fish and mammals. Dots indicate identity. Sequences are from Paralichthys olivaceus (Pol) Dq66233.1 = HSP90AA and AY214170.1 = HSP90AB, Danio rerio (Dre) NM001045073.1 and AF042108.1 = HSP90AB, Solea senegalensis (Sse) AB367526.1 and AB367527.1 = HSP90AB, Salmo salar (Ssa) NM 001173702.1 = HSP90AA and NM_001123532.1 = HSP90AB, Gadus morhua (Gmo) ES783928, Homo sapiens (Hsa) DC303876.1 = HSP90AA and BC004928.1 = HSP90AB.
Additional file 5: Phylogenetic tre of HSP90 sequences. Phylogenetic tree showing relationship between several fish and 2 mammalian HSP90 proteins using maximum likelihood method. Bootstrap values are shown on the branches and scale for branch length (0.035 substitutions/site). Sequences are from Paralichthys olivaceus (Pol) Dq66233.1 = HSP90AA and AY214170.1 = HSP90AB, Danio rerio (Dre) NM001045073.1 and AF042108.1 = HSP90AB, Solea senegalensis (Sse) AB367526.1 and AB367527.1 = HSP90AB, Salmo salar (Ssa) NM 001173702.1 = HSP90AA and NM_001123532.1 = HSP90AB, Gadus morhua (Gmo) ES783928, Homo sapiens (Hsa) DC303876.1 = HSP90AA and BC004928.1 = HSP90AB.
Acknowledgements
The study was supported by Norwegian Research Council grant 185244/S40.
Author details
1
Department of Pharmaceutical Biosciences, School of Pharmacy, University of Oslo, PO Box 1068 Blindern, 0316 Oslo, Norway.2Institute of Biology, University of Oslo, Blindern N-0316, Norway.
Authors’contributions
IAA carried out the RT-qPCR analyses, performed the statistical analyses and drafted the manuscript. ALR participated in the sampling of the tissues, RNA isolation and RT-qPCR. HEK participated in planning of the study, was responsible for animal husbandry and experimental setup for the
temperature study. TG conceived the study, participated in study design and coordination and carried out sequence alignments and drafted the manuscript. All authors read and approved the final manuscript.
Competing interests
The authors declare that they have no competing interests.
Received: 10 December 2010 Accepted: 5 April 2011 Published: 5 April 2011
References
2. Kapp LD, Lorsch JR:The molecular mechanics of eukaryotic translation.
Annu Rev Biochem2004,73:657-704.
3. The Gene Index Project.[http://compbio.dfci.harvard.edu/tgi/cgi-bin/tgi/ gimain.pl?gudb=zfish].
4. PubMed.[http://www.ncbi.nlm.nih.gov/sites/entrez].
5. “Atlantic Cod Genomics and Broodstock Development”project (CGP). [http://codgene.ca/].
6. Bustin SA, Benes V, Garson JA, Hellemans J, Huggett J, Kubista M, Mueller R, Nolan T, Pfaffl MW, Shipley GL,et al:The MIQE guidelines: minimum information for publication of quantitative real-time PCR experiments.
Clin Chem2009,55(4):611-622.
7. Vandesompele J, De Preter K, Pattyn F, Poppe B, Van Roy N, De Paepe A, Speleman F:Accurate normalization of real-time quantitative RT-PCR data by geometric averaging of multiple internal control genes.Genome Biol2002,3(7):RESEARCH0034.
8. Andersen CL, Jensen JL, Orntoft TF:Normalization of real-time quantitative reverse transcription-PCR data: a model-based variance estimation approach to identify genes suited for normalization, applied to bladder and colon cancer data sets.Cancer Res2004,64(15):5245-5250. 9. Pfaffl MW, Tichopad A, Prgomet C, Neuvians TP:Determination of stable
housekeeping genes, differentially regulated target genes and sample integrity: BestKeeper–Excel-based tool using pair-wise correlations.
Biotechnol Lett2004,26(6):509-515.
10. Pfaffl MW, Horgan GW, Dempfle L:Relative expression software tool (REST) for group-wise comparison and statistical analysis of relative expression results in real-time PCR.Nucleic Acids Res2002,30(9):e36. 11. Yamashita M, Hirayoshi K, Nagata K:Characterization of multiple members
of the HSP70 family in platyfish culture cells: molecular evolution of stress protein HSP70 in vertebrates.Gene2004,336(2):207-218. 12. Kampinga HH, Hageman J, Vos MJ, Kubota H, Tanguay RM, Bruford EA,
Cheetham ME, Chen B, Hightower LE:Guidelines for the nomenclature of the human heat shock proteins.Cell Stress Chaperones2009,14(1):105-111. 13. Manchado M, Salas-Leiton E, Infante C, Ponce M, Asensio E, Crespo A,
Zuasti E, Canavate JP:Molecular characterization, gene expression and transcriptional regulation of cytosolic HSP90 genes in the flatfish Senegalese sole (Solea senegalensis Kaup).Gene2008,416(1-2):77-84. 14. Otterlei E, Nyhammer G, Folkvord A, Stefansson SO:Temperature- and
size-dependent growth of larval and early juvenile Atlantic cod (Gadus marhua): a comparative study of Norwegian coastal cod and northeast Arctic cod.Can J Fish Aquat Sci/J Can Sci Halieut Aquat1999,
56(11):2099-2111.
15. Perez-Casanova JC, Rise ML, Dixon B, Afonso LO, Hall JR, Johnson SC, Gamperl AK:The immune and stress responses of Atlantic cod to long-term increases in water temperature.Fish Shellfish Immunol2008, 24(5):600-609.
16. Saele O, Nordgreen A, Hamre K, Olsvik PA:Evaluation of candidate reference genes in Q-PCR studies of Atlantic cod (Gadus morhua) ontogeny, with emphasis on the gastrointestinal tract.Comp Biochem Physiol B Biochem Mol Biol2009,152(1):94-101.
17. Jorgensen SM, Kleveland EJ, Grimholt U, Gjoen T:Validation of reference genes for real-time polymerase chain reaction studies in Atlantic salmon.Mar Biotechnol (NY)2006,8(4):398-408.
18. Fernandes JM, Mommens M, Hagen O, Babiak I, Solberg C:Selection of suitable reference genes for real-time PCR studies of Atlantic halibut development.Comp Biochem Physiol B Biochem Mol Biol2008,150(1):23-32. 19. Ingerslev HC, Pettersen EF, Jakobsen RA, Petersen CB, Wergeland HI:
Expression profiling and validation of reference gene candidates in immune relevant tissues and cells from Atlantic salmon (Salmo salar L.).
Mol Immunol2005.
20. McCurley AT, Callard GV:Characterization of housekeeping genes in zebrafish: male-female differences and effects of tissue type, developmental stage and chemical treatment.BMC Mol Biol2008,9:102. 21. Dheda K, Huggett JF, Bustin SA, Johnson MA, Rook G, Zumla A:Validation of housekeeping genes for normalizing RNA expression in real-time PCR.
BioTechniques2004,37(1):112-114, 116, 118-119.
22. Klinkert B, Narberhaus F:Microbial thermosensors.Cell Mol Life Sci2009, 66(16):2661-2676.
23. Diller KR:Stress protein expression kinetics.Annu Rev Biomed Eng2006, 8:403-424.
24. Zakhartsev M, De Wachter B, Johansen T, Poertner HO, Blust R:Hsp70 is not a sensitive indicator of thermal limitation in Gadus morhua.Journal Of Fish Biology2005,67(3):767-778.
25. Lindquist S, Craig EA:The heat-shock proteins.Annu Rev Genet1988, 22:631-677.
doi:10.1186/1756-0500-4-104
Cite this article as:Aursneset al.:Validation of reference genes for
quantitative RT-qPCR studies of gene expression in Atlantic cod (Gadus
morhua l.) during temperature stress.BMC Research Notes20114:104.
Submit your next manuscript to BioMed Central and take full advantage of:
• Convenient online submission
• Thorough peer review
• No space constraints or color figure charges
• Immediate publication on acceptance
• Inclusion in PubMed, CAS, Scopus and Google Scholar
• Research which is freely available for redistribution