Copyright © 1998, American Society for Microbiology
Lymphocyte Apoptosis during Classical Swine Fever:
Implication of Activation-Induced Cell Death
ARTUR SUMMERFIELD,* SONJA M. KNO¨ TIG,ANDKENNETH C. MCCULLOUGH
Institute of Virology and Immunoprophylaxis, CH-3147 Mittelha¨usern, Switzerland
Received 14 October 1997/Accepted 14 November 1997
Infection of pigs with classical swine fever virus (CSFV), a member of the Flaviviridae family, causes a severe leukopenia, particularly notable with the lymphocytes. The goal of this study was to analyze mechanisms behind this CSFV-induced lymphopenia. To this end, the kinetics of leukocyte depletion, the appearance of apoptotic cells, and virus infection of leukocytes after infection of pigs with the virulent CSFV strain Brescia were analyzed. Depletion of B and T lymphocytes was noted as early as 1 day postinfection (p.i.). Circulating viable lymphocytes with reduced mitochondrial transmembrane potential—a particular early marker for apoptosis—were also detectable as early as 1 day p.i. When isolated peripheral blood mononuclear cells were
cultured for 6 h, significantly more sub-G1cells with reduced DNA content were detected among the
lympho-cytes from CSFV-infected animals, again as early as 1 to 3 days p.i. The first time virus was first found in the plasma, as well as infection of leukocytes, was 3 days p.i. However, throughout the observation time of 1 week, <3% of the circulating leukocytes and no lymphocytes contained virus or viral antigen. Further analysis of the T lymphocytes from infected animals demonstrated an increase in CD49d, major histocompatibility complex class II, and Fas expression. An increased susceptibility to apoptosis in vitro was also observed, particularly after addition of concanavalin A as well as apoptosis-inducing anti-Fas antibody to the cultures. Taken together, these results imply that activation-induced programmed cell death was the mechanism behind lymphopenia during classical swine fever.
Leukopenia can result in immunosuppression and is a hall-mark of certain virus infections, such as classical swine fever (CSF), bovine viral diarrhea, and dengue fever, all caused by virus members of the family Flaviviridae (for reviews, see ref-erences 27, 54, and 55).
Classical swine fever virus (CSFV), a member of the genus
Pestivirus, is a small enveloped RNA virus causing an
econom-ically important and fatal disease of pigs. The virus is known to have a particular affinity for cells of the immune system, which seems to relate to the detrimental effects on the immune and hematopoietic systems (9, 41, 52, 54, 55). The target cells for CSFV in the peripheral blood appear to be mainly monocytes, although in later stages of the disease infection of lymphocytes (50, 55) as well as granulocytic cells (50) has been noted. All leukocyte populations can be depleted during CSF, but B lym-phocytes are particularly sensitive (52). Despite this current knowledge, the immunopathological mechanisms and the role played by the virus infection of leukocytes with respect to the disease pathology in general, and leukocyte death in particular, have not been elucidated. Generally, leukopenia could be a result of cell death, suppression of hematopoiesis, or change in the distribution of leukocytes within different compartments of the immune system. Leukocyte death can be caused by necrosis or apoptosis. The latter, a suicide-like and genetically pro-grammed form of cellular death, is involved in physiological as well as pathological cell death, induced by either a lack or presence of particular stimuli (10). Late stages of apoptosis are characterized by typical morphological criteria and degrada-tion of DNA (10). It has recently been reported that other characteristic cellular features, particularly a reduction in mi-tochondrial transmembrane potential (DCm), precede these
morphological and nuclear changes (26, 57). Due to the im-portant role played by apoptosis in the regulation of leukocyte numbers (2, 3, 10, 25, 29), as well as the observation that virus infections can be associated with apoptosis (1, 40, 48), an important step in understanding the pathogenesis of virus-induced leukopenia would be to determine the role played by apoptosis in the depletion of lymphocytes.
In this study, we (i) analyzed the relationship between the kinetics of leukocyte depletion in the peripheral blood and the virus infection therein and (ii) determined the implication of apoptosis. A significant reduction of lymphocyte numbers in the blood of CSFV-infected pigs was noted as early as 1 day postinfection (p.i.), before viremia or virus-infected leukocytes were apparent. An increase in lymphocytes programmed to die by apoptosis was also observed early p.i., implying an impor-tant role for apoptosis in the destruction of leukocytes during this disease. We present data suggesting a mechanistic role for Fas-mediated activation-induced cell death (AICD).
MATERIALS AND METHODS
Infection of pigs with CSFV.A total of 18 animals (3 months of age) were infected oronasally with the highly virulent CSFV strain Brescia (kindly provided by H.-J. Thiel, University of Giessen, Giessen, Germany; 12), using 10650% tissue culture infective doses (TCID50)/animal. Body temperature and clinical symptoms were recorded daily. Before infection (day 0) and on days 1, 3, 5, and 7 p.i., blood samples were taken. Some animals were slaughtered on days 1, 3, 5, and 7 p.i. for collection of tonsils.
Preparation of leukocytes.Peripheral blood leukocytes (PBL) were obtained by incubation of citrated blood in NH4Cl buffer (0.15 M NH4Cl, 10 mM NaHCO3[pH 7.4]) for 5 min at 4°C to lyse erythrocytes. For complete erythro-cyte lysis, this treatment was repeated three times, followed by a wash in Ca21
-Mg21-free phosphate-buffered saline (PBS-A) supplemented with 0.035% (wt/
vol) EDTA and centrifugation at 2503g for 10 min at 4°C. Peripheral blood mononuclear cells (PBMC) were isolated by Ficoll-Paque (1.077 g/liter) density centrifugation from isolated buffy coats as described previously (33). Contami-nating erythrocytes were lysed by a single treatment with NH4Cl buffer as de-scribed above. Tonsil cell suspensions were prepared by collagenase-DNase (Boehringer Mannheim) digestion as described previously (19).
MAbs and two-color flow cytometric analysis (FCM).For phenotyping, the following monoclonal antibodies (MAbs) were used: anti-SWC1 (11/8/1 [44])
* Corresponding author. Mailing address: Institute of Virology and Immunoprophylaxis, Sensemattstrasse 293, 3147 Mittelha¨usern, Swit-zerland. Phone: 41-31-8489377. Fax: 41-31-8489222. E-mail: artur [email protected].
1853
on November 9, 2019 by guest
http://jvi.asm.org/
and anti-major histocompatibility complex (MHC) class II (MSA-3 [20]), both kindly contributed by A. Saalmu¨ller (Bundesforschungsaustalt fu¨r Viruskrauk-heiten der Tiere, Tu¨bingen, Germany), anti-SWC3 (74-22-15; American Type Culture Collection [5]), anti-SWC8 (MIL-3; Serotec [21, 44]), goat anti-pig surface immunoglobulin (sIg; Jackson ImmunoResearch Laboratories), anti-CD3 (BB23-8E6; VMRD Inc., Pullman, Wash. [44]), anti-Fas (CH-11; Upstate Biotechnology Inc., Lucerne, Switzerland), and anti-CD49d (HP2.1; Immuno-tech, Marseille, France). Using an SWC3-SWC8 double-immunofluorescence analysis, we identified granulocytic cells as SWC31SWC81and monocytes as
SWC31SWC82(21, 49). In SWC1-SWC3 double labelings of PBL, SWC11
SWC32T and NK cells were discriminated from SWC12SWC32B cells and
SWC11SWC31monocytes (43). Indirect immunofluorescence labeling and
acquisition of data on a FACScan (Becton Dickinson) were done as previously described (49).
Virus infection detection by FCM.For detection of CSFV-infected cells, we used the anti-CSFV E2 MAb HC/TC26 (IgG2b; kindly provided by Dr. Bommeli AG, Bern, Switzerland [17]). For this labeling, the cells were fixed and perme-abilized (Cell Permeabilisation kit; Harlan Sera-Lab, Crawley Down, England) according to the instructions for the kit before addition of MAb HC/TC26 for 15 min. Goat anti-mouse IgG2b-phycoerythrin was used as the detection antibody as described above.
Detection of virus infection in cell cultures and virus titration.PBMC pre-pared from CSFV-infected animals were cultured at 106cells/ml on monolayers of PK-15 indicator cells in 24-well plates. After 4 days of incubation, the indicator cells were fixed with 70% ethanol (220°C, 10 min), and immunofluorescence detection of virus E2 glycoprotein by using MAb HC/TC26 was performed. For determination of virus titer in plasma, samples were titrated on PK-15 cells in 24-well plates (six replicates) and incubated for 1 h at 37°C. Then the inoculum was removed, and the cells were washed and cultured for 72 h at 37°C. After immunofluorescence labeling as described above, the culture was analyzed for infectious foci under a UV microscope. The virus titers were calculated by the method of Kaerber (23).
Cell viability and apoptosis analysis.The carbocyanine dye 3,39 -dihexyloxa-carbocyanine iodide (DiOC6[3]) was used to determineDCm(38) on the basis of the fact that this method detects cells at an early stage during apoptosis (39, 57). To this end, 106cells were incubated with 40 nM DiOC
6[3] in PBS for 10 min at 37°C. DiOC6[3] fluorescence was detected in the FL-1 channel (525 nm) of the flow cytometer. As negative controls, cells were treated with the uncoupling agent carbonyl cyanide m-chlorophenylhydrazone (50mM; Sigma). To distin-guish early apoptotic cells, which show a low DiOC6[3] staining, from dead cells, propidium iodide (PI) was added after FL-1/FL-2 compensation.
For a method to quantify late stages of apoptosis, cells were fixed with 75% (vol/vol) ethanol (4°C, 2 min), washed, and centrifuged. PI (50mg/ml plus 100mg of RNase per ml) staining of DNA was effected for 30 min at 37°C, and then cells were analyzed by FCM. The DNA histograms obtained after labeling of the permeabilized cells with PI were used to quantify apoptotic cells with reduced DNA, located in the sub-G1region (11, 36, 37).
Cell culture.PBMC were cultured either in round-bottom microtiter plates, for proliferation assays, or in 24-well plates, for cell death measurements, at a concentration of 106cells/ml in RPMI 1640 supplemented with 2 mML -glu-tamine, 531025M 2-mercaptoethanol, 10 mM HEPES buffer, and 10% fetal calf serum. In certain experiments, cells were stimulated with concanavalinA (ConA; 10mg/ml) or human recombinant interleukin-2 (IL-2; 50 U/ml; Boehr-inger Mannheim). Cell proliferation was measured after 72 h by incubating the cells with 1mCi of [3H]thymidine/well for an additional 18 h. After harvesting on glass fiber filters, counts per minute were read with a Trace 96 counter (Inotech, Dottikon, Switzerland).
Microscopic analysis of lymphocytes.Cells were cytocentrifuged onto glass microscope slides, stained by using a Diff-Quik staining kit (Baxter Diagnostik AG, Du¨dingen, Switzerland), and analyzed by light microscopy. Analysis of nuclear changes occurring in late apoptotic stages was also performed on etha-nol-fixed cells, stained with PI as described above, under a UV microscope. Leukocyte counts were performed with heparinized blood after lysis of erythro-cytes in Tu¨rk’s solution.
RESULTS
Kinetic analysis of PBL populations during acute CSF.
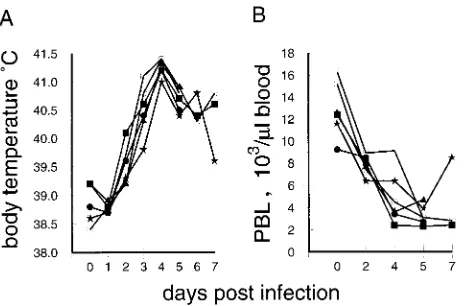
Acute CSF is characterized by a rapid development of fever, with the typical hematological feature being leukopenia (24, 52, 54, 55). After infection of pigs with CSFV strain Brescia, the majority of the animals had elevated body temperatures (.40°C) by day 3 p.i.; this further increased, reaching the highest levels at 4 days p.i. (Fig. 1A). In addition, a rapid onset of leukopenia was seen. By 2 days p.i., the number of PBL of all 18 infected animals had dropped to under 10,000 cells/ml of blood (Fig. 1B). In healthy sex- and age-matched pigs from the specific-pathogen-free breeding unit of our institute, the aver-age was 13,100 (62,400) leukocytes/ml (24 pigs analyzed). This
loss of PBL further progressed, by day 5 p.i., reaching levels as low as 2,100 to 5,350 cells/ml.
By phenotyping PBL from infected pigs on days 0, 1, 3, 5, and 7 p.i., both the relative and absolute amounts of the dif-ferent PBL populations were determined. Myeloid cells, in-cluding both granulocytic cells and monocytes, were defined as SWC31cells (21); T lymphocytes and NK cells were identified as SWC11SWC32cells, and B cells were identified as sIg1 SWC12cells (43). The results revealed that during the onset of leukopenia, mainly the lymphocyte but not myeloid popula-tions were depleted (Fig. 2). As early as 1 day p.i., an approx-imately twofold drop in the number of T and B lymphocytes was seen (Fig. 2A and B), whereas myeloid cells remained more stable, with some degree of variation between animals (Fig. 2C). By day 3 p.i., the number of B and T lymphocytes had further decreased at least threefold, reaching their lowest levels by 5 days p.i. (Fig. 2A and B). At this time point, less than 1/10 of the initial numbers of B and T cells were found in the blood.
Mitochondrial dysfunction in PBMC during CSF.
Apopto-tic cells are removed by phagocytosis in vivo (10, 14, 46), rendering it difficult to detect apoptosis ex vivo in the periph-eral blood (15, 30, 32). Therefore, an early marker detecting cells programmed to die—DiOC6[3], which measures the
re-duction ofDCm—was used.
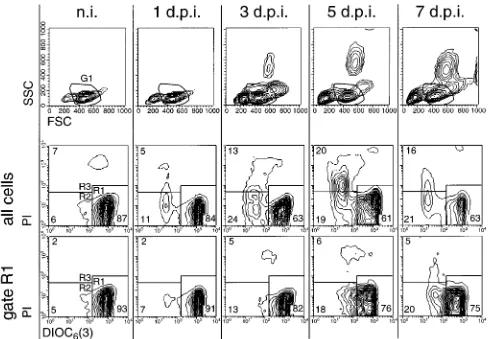
The results in Fig. 3 show a representative example of PBMC from an animal analyzed before infection and 1, 3, 5 and 7 days p.i. In the forward scatter (FSC)/side scatter (SSC) plots shown in the top row of Fig. 3, an increase in the number of cells with reduced size was observed (cells located left of region G1); this was most apparent from 3 days p.i. Further-more, the appearance of cells with high SSC in the PBMC preparations was also found beginning at 3 days p.i. These cells had the morphology and phenotype of immature granulocytic cells (50). WhenDCmwas measured in these PBMC, a reduc-tion in the percentage of viable cells with highDCmwas ob-served during the course of infection (Fig. 3, middle row, cells in R1). TheDCmlowcells showing early signs of programmed cell death (PCD) (cells in R2) and nonviable PI1cells (cells in R3) increased following infection. Cells with reduced DCm were located mainly in the region with the lowest FSC/SSC (data not shown). Consequently, when the G1 gate of the
[image:2.612.314.547.68.221.2]lymphocyte region within the FSC/SSC plot shown in the top row of Fig. 3 was used to exclusively analyze these cells, the FIG. 1. Body temperatures and PBL counts following infection of pigs with CSFV strain Brescia (results for six representative animals). (A) Change in body temperature over time; (B) PBL counts of the animals determined by micro-scopic counting of leukocytes in heparinized whole-blood samples, after lysis of erythrocytes with Tu¨rk’s solution.
on November 9, 2019 by guest
http://jvi.asm.org/
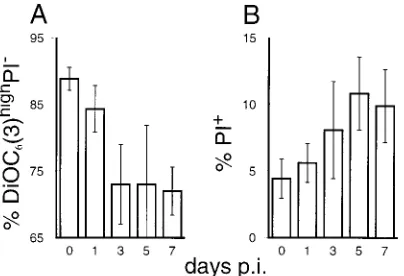
percentage of DCmhigh cells was greater than in ungated PBMC (Fig. 3, bottom row). Nevertheless, within this gate the percentage of cells with reducedDCm(R2) increased fourfold. In Fig. 4, the results of the analyses exemplified in Fig. 3 are
[image:3.612.142.457.72.224.2]shown for all pigs. The reduction of the viable population with highDCmwas detected as early as 1 to 3 days p.i., reaching the lowest levels from day 3 p.i. on (Fig. 4A). In addition to the reduction of the healthy cells with high DCm, we noted an FIG. 2. Kinetic analysis of the numbers of different leukocyte populations in the first week of CSF (results for six representative animals). PBL preparations were labeled with combinations of antileukocyte MAbs, and the percentage of positive cells was determined via analysis by immunofluorescence FCM. The absolute numbers of the different populations were then calculated from the total PBL counts obtained at each time point. (A) B cells, identified as surface SWC12Ig1; (B) T cells and
NK cells, identified as SWC11SWC32; (C) myeloid cells composed of monocytic and granulocytic cells, identified as SWC31.
FIG. 3. Reduction ofDCmand increased cell death in circulating PBMC during acute CSF (results for a representative pig). For determination ofDCm, freshly isolated DiOC6[3]-labeled PBMC obtained from pigs before infection (n.i.) and 1, 3, 5, and 7 days p.i. (d.p.i.) were analyzed by FCM. The upper row shows the FSC/SSC plots, and the two lower rows show the DiOC6[3]-PI staining of the cells. A region in the FSC/SSC plots was used to define a gate (G1) for the exclusive analysis of DiOC6[3]-PI staining of cells with scatter characteristics typical of viable lymphocytes. This is shown in the bottom row of contour plots (gate R1). Regions R1 to R3 defined in the DiOC6[3]-PI contour plots were used determine the number of DiOC6[3]highPI2(R1), DiOC6[3]lowPI2(R2), and DiOC6[3]lowPI1(R3) cells.
on November 9, 2019 by guest
http://jvi.asm.org/
[image:3.612.55.545.342.681.2]increase of dead PI1cells during CSF, from 4 to 6% of the PBMC before infection to over 10% by day 5 p.i. (Fig. 4B).
Apoptosis of peripheral leukocytes during CSF.To confirm
that the viable cells with reducedDCmin the PBMC prepara-tions from CSFV-infected animals would relate to apoptotic cells, an additional method characteristically employed for identifying PCD was used for analysis of the samples. This method was cell cycle analysis to determine the percentage of
cells with reduced DNA content in the sub-G1region that were
known to be apoptotic (11, 36, 37). PBMC from noninfected pigs gave values of less than 1% for the sub-G1 region (Fig.
5A). In Fig. 5B, PBMC from a pig at 7 days p.i. show the presence of 6.1% of the cells in the sub-G1region. The first
PBMC preparations containing detectable apoptotic sub-G1
cells were obtained 3 days p.i. (Fig. 5C): two of six animals analyzed at this time point clearly contained sub-G1cells. One
animal of the three analyzed at 5 days p.i., and all three animals analyzed at 6 days p.i., had elevated numbers of cells with reduced DNA content (Fig. 5C).
Previous work has demonstrated the difficulties with detect-ing apoptotic cells which had arisen in vivo by methods based on DNA fragmentation (15, 32, 57). Such difficulties would relate to the results obtained and shown in Fig. 5C. Conse-quently, the isolated PBMC were cultured for 6 h to permit cells committed to PCD to develop signs of DNA fragmenta-tion and loss, as determined by the DNA content analysis. As demonstrated in Fig. 5D to F, the levels of sub-G1 cells in
PBMC from noninfected animals remained below 2%. In con-trast, PBMC preparations from four of six animals obtained at 1 day p.i., and all PBMC preparations obtained from days 3 to 7 p.i., contained significantly increased levels of sub-G1
apo-ptotic cells, compared to the PBMC from noninfected animals (Fig. 5F). Examples of the staining pattern obtained are shown in Fig. 5D (noninfected pig) and 5E (cells from a typical animal at 7 days p.i.). Morphological analysis of cytospin preparations of these PI-stained cells under a UV microscope confirmed the presence of these apoptotic cells with condensed DNA, nu-FIG. 4. ReducedDCmand increased cell death of PBMC following infection
of pigs with CSF.DCmand cell membrane permeability (cell death) were mea-sured as described for Fig. 3. Following infection of pigs with CSFV, changes in the percentage of viable PBMC (DiOC6[3]highand PI2) (A) and the percentage of PI1dead PBMC (B) were determined. The averages and standard deviations
for six (for days 0, 1, and 3 p.i.) and three (for days 5 and 7 p.i.) different pigs were calculated.
FIG. 5. DNA loss in leukocytes during CSF. PBMC obtained from animals before and after infection with CSFV were analyzed for the percentage of cells located in the sub-G1region of a cell cycle analysis by FCM. The FSC (x axis) versus the fluorescence intensity (y axis) of PI-stained ethanol-fixed cells (representing a measurement of DNA content) is illustrated in contour plots (A, B, D, and E), with the cell cycle stage indicated to the right of plot B. (A and B) Examples of results obtained with cells from a pig before infection (A) and 7 days p.i. (B); (C) percentage of PBMC located in the sub-G1region of all individual animals analyzed with respect to time p.i.; (D to F) equivalent results for the same cells but after culture for 6 h at 37°C.
on November 9, 2019 by guest
http://jvi.asm.org/
[image:4.612.71.273.69.207.2]clear fragmentation, and/or DNA-containing apoptotic bodies (data not shown).
Viremia and virus infection of leukocytes.Due to the
capac-ity of CSFV to infect different leukocyte populations (9, 50, 54, 55), the presence of virus in plasma and leukocytes was deter-mined. The objective was to elucidate what relationship, if any, might exist with the rapid lymphopenia shown above. The first detectable presence of infectious virus in the plasma was at 3 days p.i. (Table 1). Virus titers in the plasma did not signifi-cantly increase before day 5 p.i., reaching levels between 103
and 105TCID 50/ml.
When PBL and PBMC were tested for viral glycoprotein E2
expression by FCM, the first positive cells were detectable at 3 days p.i. for certain animals and 5 days p.i. for the majority of animals. Nevertheless, the numbers of infected cells was always low (Table 1). Even at day 7 p.i., not more than 2% of the PBMC were E21. In double-labeling experiments, these cells were shown to be SWC31and thus of myeloid origin (data not shown). Tonsillar samples had detectable virus-infected cells as early as 1 day p.i. but not more than 1% and never more than 12%. When PBMC were cocultured with CSFV-permissive indicator cells (PK-15) for 5 days, it was possible to detect infected cells as early as 3 days p.i., but only in three of six animals analyzed; all animals were positive by day 5 p.i. (Table 1).
Modulation of T-lymphocyte phenotype and Fas expression.
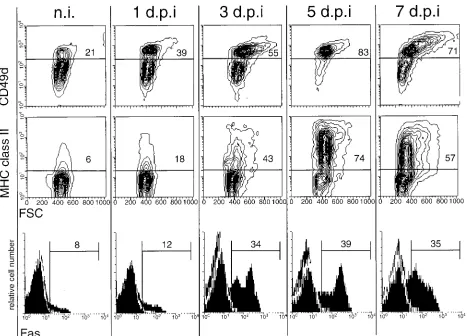
[image:5.612.50.291.81.161.2]The observation that no infection of lymphocytes by CSFV was detectable during the 7 days of observation, and that CSFV is not cytopathogenic for lymphocytes in vitro (reference 55 and data not shown), suggests that virus infection was not a direct cause of lymphocyte death. When the phenotype of lympho-cytes from infected pigs was analyzed, an increased expression of CD49d and MHC class II was observed, as shown for a representative pig in Fig. 6 (top and middle rows). Before infection with CSFV, 21 to 33% of T lymphocytes from the different pigs expressed high levels of CD49d (exemplified by the representative samples shown in the top row of Fig. 6, column n.i.). This number increased for all pigs analyzed 3 days
FIG. 6. Increased expression of CD49d, MHC class II, and Fas on peripheral T lymphocytes during CSF (results for a representative animal). PBMC obtained from pigs before infection (n.i.) and 1, 3, 5, and 7 days p.i. (d.p.i.) were immunofluorescence labeled for CD3 versus CD49d, CD3 versus MHC class II, and CD3 versus Fas expression. The expression of CD49d (top row) and MHC class II (middle row) on gated CD31cells is shown in FSC (x axis) versus immunofluorescence (y axis) contour
[image:5.612.68.535.353.689.2]plots. The expression of Fas on CD31cells is shown in histograms (bottom row). TABLE 1. Viremia and infection of leukocytes during CSF
Days
p.i. (TCIDPlasma titer50/ml)
Coculture PBMC (no. of pigs positive/
no. analyzed)
% E21cells detected
by FCM
PBL PBMC Tonsil
1 0 0/6 0 0 0.5–1
3 1020.25–1.5 3/6 0 0–2 (2/6a) 1–4
5 103.5–4.5 3/3 1–2 1–2 2–11
7 103–5 3/3 1–2 1–2 2–12 aTwo positive animals out of six tested. Hence, the value for the percentage of cells positive for E2 expression ranged from 0% (four of six animals) to 2% (two of six animals).
on November 9, 2019 by guest
http://jvi.asm.org/
p.i. and reached maximum levels by 5 days p.i. when 76 to 87% of T cells were CD49dhigh. Interestingly, an increase in the
FSC, especially of the CD49dhighT lymphocytes, was noted,
indicating an increase in activated cells (Fig. 6, top row). Con-cerning the MHC class II expression on T lymphocytes from CSFV-infected pigs, MHC class II1T lymphocytes increased from 6 to 15% before infection to 70 to 80% by 5 days p.i. The cells with increased FSC were mainly among the MHC class II1population.
Under certain circumstances, activation of T lymphocytes can result in apoptotic death mediated by Fas (CD95)-Fas ligand (FasL) interaction, a process termed AICD (4, 22, 25, 29, 42). The possible implication of AICD in T lymphocytes during CSF was analyzed in terms of Fas expression on the T cells. As shown for a representative pig in Fig. 6 (bottom row), an increase in the number of Fas-expressing T lymphocytes was observed during the course of the disease. Before infection, 6 to 17% of T cells from the different pigs expressed Fas, and this number increased to reach over 30% for most pigs from 3 to 5 days p.i.
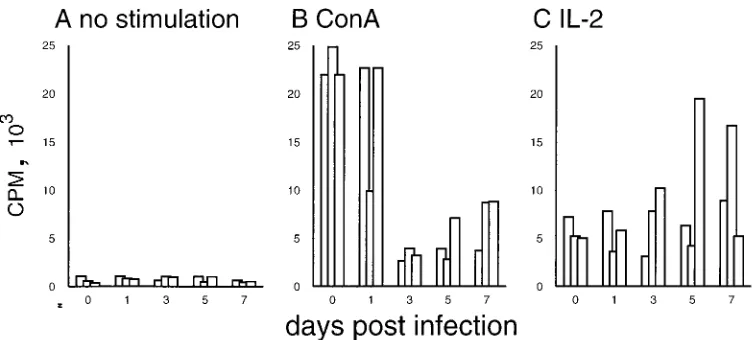
Impaired responsiveness of T lymphocytes to mitogen
stim-ulation during CSF.The lymphoid depletion and phenotypic
changes of T lymphocytes described above could have been the result of migratory changes within the T-lymphocyte compart-ments. If redistribution of lymphocytes alone were responsible for the lymphopenia during CSF, an intact functional activity of the remaining circulating T cells would be expected. To investigate this possibility, we analyzed the proliferative capac-ity of PBMC obtained before and after infection with CSFV strain Brescia. A four- to fivefold depression of the T-lympho-cyte response to ConA was found 3 days p.i.; this low level was maintained until the end of the experiment (Fig. 7B). This finding is in agreement with previous reports describing a per-sistent decreased proliferative response of peripheral lympho-cytes to mitogens from day 2 p.i. with virulent CSFV (56). Interestingly, the proliferative response to IL-2 was not im-paired (Fig. 7C). In fact, PBMC from certain animals, partic-ularly 5 and 7 days p.i., showed enhanced proliferation upon treatment with IL-2.
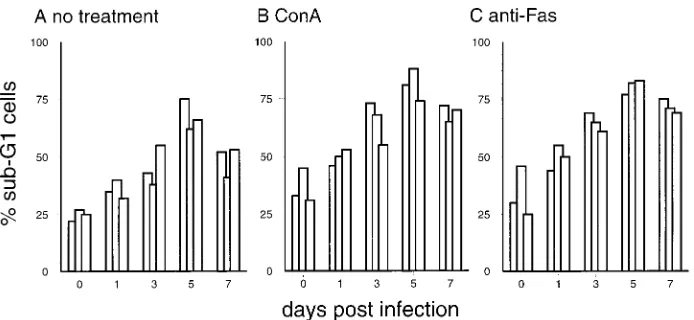
Culture-, ConA-, and Fas-induced apoptosis of lymphocytes
from CSFV-infected animals. To determine the relationship
between cell death and reduced responsiveness to mitogen, PBMC from animals before and after CSFV infection were
treated with ConA for 24 h, and the number of apoptotic sub-G1cells was quantified. Cells from infected pigs as early as
1 day p.i. showed enhanced susceptibility to apoptosis in the absence of ConA stimulation (Fig. 5F and 8). Addition of ConA increased the number of dead cells obtained from both noninfected and infected pigs (Fig. 8). Similar effects were obtained by addition of anti-Fas antibody, indicating that these cells were susceptible to Fas-induced cell death. Interestingly, IL-2 was incapable of rescuing the cells from cell death: the number of apoptotic cells remained at the level of the culture without IL-2 or was even higher (data not shown).
DISCUSSION
Previous studies on the development of leukopenia during CSF have tended not to analyze the early phase of the disease, yet the characteristics of the leukopenia suggest that the pri-mary initiating pathogenic events are more likely to be eluci-dated when early phases are focused on. In the present study, the induction of leukopenia during acute CSF developed rap-idly following infection with the virulent Brescia strain. When focusing on the absolute counts of lymphocytes, we noted a peracute depletion of this population as early as 24 h p.i. At this time point, the infection was otherwise asymptomatic, and neither cell-free nor cell-associated virus could be detected in the blood. Although infected cells could be identified in the tonsils, it was not until 3 days p.i. with certain animals, and 5 days p.i. with all animals, that such cells were found in the blood. Nevertheless, the numbers of infected cells were always very low, and no virus antigen was detected in the lymphocytes. These results indicate that the lymphopenia was not a direct effect of virus infection in the lymphocytes. This conclusion is supported by the observation that CSFV strain Brescia has no cytopathogenic effect on lymphocytes in vitro (data not shown).
[image:6.612.111.489.67.237.2]In contrast to the report of Susa et al. (52), no significant difference in depletion between T and B lymphocytes was found during the early phase of CSF, after infection with the Brescia strain. A possible explanation could be the higher virulence of the Brescia strain than of the Alfort strain used by Susa et al. (52), resulting in a more profound effect on both T and B cells. Furthermore, the use of absolute cell counts in the present study, in contrast to the work of Susa et al. (52), was FIG. 7. Changes in the proliferative capacity of PBMC during CSFV infection. PBMC obtained from pigs before infection (0) and 1, 3, 5, and 7 days p.i. (x axis) were culture for 3 days and an additional 18 h for [3H]thymidine labeling to determine proliferation. Due to the relative increase of myeloid cell populations in the PBMC obtained from infected pigs (data not shown), the cell number used was adjusted to obtain an equal concentration of 106lymphocytes/ml in each culture. (A) Spontaneous proliferation; (B) response to ConA; (C) response to IL-2. Each bar represents the average of triplicates from the PBMC of an individual pig.
on November 9, 2019 by guest
http://jvi.asm.org/
required to compare the different rates of T- and B-lymphocyte depletion.
Further insight into the possible mechanisms operating dur-ing the early phase of lymphopenia was obtained by analysis of certain parameters for cell viability and PCD. As early as 1 day p.i., we detected an increasing number of lymphocytes with reducedDCm, as well as cells programmed to die (determined by a short culture period before DNA content analysis). Such results point to PCD being involved in the early lymphocyte depletion during CSF. The reduction of DCm has been re-ported as an early event during apoptotic cell death occurring before DNA fragmentation (7, 8, 26, 39, 57); it also appears before expression of phagocytosis receptors such as phospha-tidylserine (7), crucial for the clearance of apoptotic cells in vivo by phagocytes (14). This DCm measurement makes it possible to detect PCD in vivo, without concern that such cells had been removed by phagocytosis and also without any addi-tional cell culture. Macho et al. have used the same principle to measure mitochondrial dysfunction of PBMC obtained from human immunodeficiency virus-infected patients (30). In ad-dition to the leukocytes with aDCmreduction, and the appear-ance of cells programmed to die, an increasing number of dead PBMC was found during the course of CSF. Whether all of these cells died from apoptosis cannot be definitively said, since the end stages of apoptosis and necrosis result in similar patterns of membrane permeabilization.
Taken together, these results relate to the observations of Korn and Lorenz, who found an increase of necrotic cells and monocytes with ingested lymphocytes in the blood of pigs in-fected with virulent CSFV (24). Histological studies of lym-phoid tissues from CSFV-infected pigs also identified necrotic as well as phagocytosed lymphocytes (9, 41); the latter would be indicative of apoptotic lymphocyte death in these organs. Indeed, analysis of the tonsils from infected pigs in the present study revealed a high degree of apoptotic cell death in these organs at 5 to 7 days p.i. (data not shown).
Because CSFV is noncytopathogenic, and given the obser-vation that no peripheral lymphocytes were infected but lym-phocyte depletion was a very early event, mechanisms other than a direct induction of cell death by the virus had to be considered. One possible explanation comes from the study of Bruschke et al. wherein a recombinant CSFV glycoprotein Erns (E0) had a cytotoxic effect on T cells in vitro (6). Ernsis known to be secreted from CSFV-infected cells and is found in the
sera of infected pigs (6). Nevertheless, the sera from neither infected pigs nor infected pigs nor infected cell culture super-natants were found to have a detrimental effect on lymphocytes from noninfected pigs (data not shown). To investigate further the possible mechanisms of lymphocyte depletion during CSF, a phenotypic analysis was performed. The results obtained, namely, upregulation of CD49d and MHC class II as well as increased T-lymphocyte size, were indicative of T-lymphocyte activation and/or conversion to memory phenotype early dur-ing the disease. CD49d has been shown to have a heteroge-neous expression on T lymphocytes, with memory cells and activated T lymphocytes being CD49dhigh (31). In the pig,
some T lymphocytes express MHC class II constitutively, but upon activation, MHC class II is upregulated (45). This up-regulation of MHC class II on T cells is not necessarily a sign of activation—porcine memory Th lymphocytes are MHC class II1 even in a nonactivated stage (45, 51). With the CSFV-infected animals, the kinetics of MHC class II increase corre-lated with that of CD49d on the T-cell population. Conse-quently, the increased MHC class II expression confirmed the CD49d results, showing an increase in T lymphocytes with a memory/activated phenotype. Interestingly, on most of the T lymphocytes, only a slight increase of the IL-2 receptor (CD25) expression was observed; the majority of the CD49dhighMHC
class II1T lymphocytes were actually CD252(data not shown). Taken together with the increased expression of Fas on the lymphocytes, these results indicate that AICD could be in-volved in the induction of apoptosis in lymphocytes during CSF. This would be in agreement with the current concept that activated and memory T cells have increased Fas expression (34) and reduced Bcl-2 expression (1, 3) and thus show an increased susceptibility to apoptosis mediated by Fas-FasL in-teraction (1, 3, 13, 22, 25). The physiological role of this system is thought to be in the prevention of overstimulation of T lymphocytes during the immune response (2), downregulation of the immune response (1), and maintenance of lymphocyte homeostasis (29).
[image:7.612.126.473.67.227.2]The possible role of these mechanisms in the induction of lymphopenia during CSF was confirmed by in vitro culture of T lymphocytes from infected pigs and addition of apoptosis-inducing anti-Fas MAb. This increased sensitivity to apoptosis in the presence of mitogen explains the lack of proliferative response to this stimulus and relates to AICD. ConA activation has been reported to increase cell death through AICD, when FIG. 8. In vitro culture, ConA (10mg/ml) treatment, and anti-Fas (CH-11; 0.5mg/ml) treatment result in enhanced apoptosis of PBMC from CSFV-infected pigs. The same PBMC used for Fig. 7 were cultured for 24 h, and apoptotic cells located in the sub-G1region were quantified by DNA content analysis. For each time point, results for three representative pigs are shown.
on November 9, 2019 by guest
http://jvi.asm.org/
the situation results in aberrant stimulation of the T cells (42). Reduced mitogen responsiveness and increased susceptibility to apoptosis, both associated with the activated phenotype, have been reported for other viral infections (16, 18, 35, 40). IL-2 did not have the capacity to prevent apoptosis of T cells from infected pigs when tested in vitro. In contrast, it some-times enhanced cell death, which again relates to other viral infections where AICD has been implicated (40). Therefore, a possible concept for lymphocyte depletion during CSF would be an aberrant triggering of lymphocytes by virus-induced cy-tokine imbalance or by a viral superantigen, resulting in acti-vation, upregulation of Fas, and downregulation of Bcl-2 (10, 40, 47). Fas-FasL killing would be mediated by autocrine T-cell suicide (13, 53) or by interaction with FasL-expressing phago-cytes (28), suggesting a dysregulation of the regulatory Fas-dependent systems for T-lymphocyte homeostasis (25, 29), which may be common to other viral infections (1, 3, 18, 35, 40). Similar mechanisms might also be responsible for the B-lymphocyte depletion during CSF: Fas expression was also increased on these cells (data not shown). However, this re-quires further investigation, because the regulation of B-lym-phocyte homeostasis differs from that of T-lymB-lym-phocyte ho-meostasis (47).
Further studies will now concentrate on the triggers of this cell death and the localization of these pathogenic events. The tonsils and spleen were also affected by apoptotic cell deple-tion, indicating that the observed effects did become general-ized throughout the lymphoid tissue. Analysis of the functional alterations induced by virus infection in the primary target cells in the lymphoid tissue—macrophages, endothelial cells, den-dritic cells, and probably other accessory cells of the immune system (9, 52, 54, 55)—should further elucidate CSF immuno-pathogenesis.
ACKNOWLEDGMENTS
This work was supported by the Swiss Federal Veterinary Office. We thank Rene´ Schaffner, Annette Arriens, Robert Tschudin, Heidi Gerber, and Sandra Wenger for technical assistance and Christian Griot for reviewing the manuscript. For animal care, we acknowledge the work of Peter Zulliger, Markus Mader, and Andreas Michel.
REFERENCES
1. Akbar, A. N., N. Berthwick, M. Salmon, W. Gombert, M. Bofill, N. Sham-sadeen, D. Pilling, S. Pett, J. E. Grundy, and G. Janossy.1993. The signif-icance of low bcl-2 expression by CD45RO T cells in normal individuals and patients with acute viral infections. The role of apoptosis in T cell memory. J. Exp. Med. 178:427–438.
2. Akbar, A. N., and M. Salmon. 1997. Cellular environments and apoptosis: tissue microenvironments control activated cell death. Immunol. Today 72: 72–76.
3. Akbar, A. N., M. Salmon, J. Savill, and G. Janossy. 1993. A possible role for bcl-2 in regulating T-cell memory—a ‘balancing act’ between cell death and survival. Immunol. Today 14:526–532.
4. Alderson, M. R., T. W. Tough, T. Davis-Smith, S. Braddy, B. Flak, K. A. Schooley, R. G. Goodwin, C. A. Smith, F. Ramsdell, and D. H. Lynch.1995. Fas ligand mediates activation-induced cell death in human T lymphocytes. J. Exp. Med. 181:71–77.
5. Blecha, F., T. Kielian, D. S. McVey, J. K. Lunney, K. Walker, C. R. Stokes, K. Stevens, Y. B. Kim, R. M. Chu, T. S. Chen, M. P. Murtaugh, C. Choi, T. W. Molitor, K. C. McCullough, and M. D. Pescovitz.1994. Workshop studies on monoclonal antibodies reactive against porcine myeloid cells. Vet. Immunol. Immunopathol. 43:269–272.
6. Bruschke, C. J. M., M. M. Hulst, R. J. M. Moormann, P. A. van Rijn, and J. T. van Oirshot.1997. Glycoprotein Ernsof pestiviruses induces apoptosis in lymphocytes of several species. J. Virol. 71:6692–6696.
7. Castedo, M., T. Hirsch, S. A. Susin, N. Zamzami, P. Marchetti, A. Macho, and G. Kroemer.1996. Sequential acquisition of mitochondrial and plasma membrane alteration during early lymphocyte apoptosis. J. Immunol. 157: 512–521.
8. Castedo, M., A. Macho, N. Zamzami, T. Hirsch, P. Marchetti, J. Uriel, and G. Kroemer.1995. Mitochondrial perturbations define lymphocytes under-going apoptotic depletion in vivo. Eur. J. Immunol. 25:3277–3284.
9. Cheville N. F., and W. L. Mengeling. 1969. The pathogenesis of chronic hog cholera (swine fever). Histologic, immunofluorescent, and electron micro-scopic studies. Lab. Invest. 20:261–274.
10. Cohen, J. J., J. C. Duke, V. A. Fadok, and K. S. Sellins. 1992. Apoptosis and programmed cell death in immunity. Annu. Rev. Immunol. 10:267–293. 11. Darzynkiewicz, Z., S. Bruno, G. Del Bino, W. Gorczyca, M. A. Hotz, P.
Lassota, and F. Traganos.1992. Feature of apoptotic cells measured by flow cytometry. Cytometry 13:795–808.
12. De Simone, F., and A. Civardi. 1973. Practical results of the immuno-fluo-rescence technique for the diagnosis of hog-cholera, Aujeszky’s disease, equine rhinopneumonitis. Vet. Ital. 24:223–231.
13. Dhein, J., H. Walczak, C. Baumler, K.-M. Debatin, and P. H. Krammer. 1995. Autocrine T-cell suicide mediated by APO-1/(Fas/CD95). Nature (London) 373:438–341.
14. Fadok, V. A., D. R. Voekler, P. A. Campbell, J. J. Cohen, D. L. Bratton, and P. M. Henson.1992. Exposure of phosphatidylserine on the surface of apo-ptotic lymphocytes triggers specific recognition and removal by macro-phages. J. Immunol. 148:2207–2216.
15. Gonzalo, J. A., A. Gonzalez-Garcia, C. Martinez-A., and G. Kroemer. 1993. Glucocorticoid-mediated control of the clonal depletion and activation of peripheral T cells in vivo. J. Exp. Med. 177:1239–1249.
16. Gougeon, M.-L., H. Lecoeur, A. Dulioust, M.-G. Enouf, M. Crouvoisier, T. Goujard, and L. Montagnier.1996. Programmed cell death in peripheral lymphocytes from HIV-infected persons—increased susceptibility to apopto-sis of CD4 and CD8 T cells correlates with lymphocyte activation and disease progression. J. Immunol. 156:3509–3520.
17. Greiser-Wilke I., V. Moennig, J. Coulibaly, J. Dahle, L. Leder, and B. Liess. 1990. Identification of conserved epitopes on a hog cholera virus protein. Arch. Virol. 111:213–225.
18. Gummuluru, S., F. J. Novembre, M. Lewis, H. A. Gelbard, and S. Dewhurst. 1996. Apoptosis correlates with immune activation in intestinal lymphoid tissue from macaques acutely infected by a highly enteropathogenic simian immunodeficiency virus, SIVsmmPBj14. Virology 225:21–31.
19. Halabi, G., and K. C. McCullough. 1995. Influence of antigen presentation and exogenous cytokine activity during in vitro primary immunizations em-ployed for the generation of monoclonal antibodies. J. Immunol. Methods 186:205–216.
20. Hammerberg, C., and G. C. Schurig. 1986. Characterization of monoclonal antibodies directed against swine leukocytes. Vet. Immunol. Immunopathol. 11:107–121.
21. Haverson, K., M. Bailey, V. R. Higgins, P. W. Bland, and C. R. Stokes. 1994. Characterization of monoclonal antibodies specific for monocytes, macro-phages and granulocytes from porcine peripheral blood and mucosal tissues. J. Immunol. Methods 170:233–245.
22. Ju, S. T., D. J. Panka, H. Cui, R. Ettinger, M. El-Khatib, D. H. Sherr, B. Z. Stanger, and A. Marshak-Rothstein.1995. Fas(CD95)/FasL interactions re-quired for programmed cell death after T-cell activation. Nature (London) 373:444–448.
23. Kaerber, G. 1931. Beitrag zur kollektiven Behandlung pharmakologischer Reihenversuche. Arch. Exp. Pathol. Pharmakol. 162:480–487.
24. Korn, G., and R. J. Lorenz. 1974. Blutbilduntersuchungen bei verschiedenen Verlaufsformen der Schweinepestinfektion unter besonderer Beru¨cksichti-gung von lymphozyta¨ren Reaktionen, Zellschatten, BeweBeru¨cksichti-gungsformen von Lymphozyten (“Lysozyten”) und Knochenmarkreaktionen. Zentralbl. Bak-teriol. Orig. Reihe A 229:299–322.
25. Krammer, P. H., J. Dhein, J. Walczak, I. Behrmann, S. Mariani, B. Matiba, M. Fath, P. T. Danila, E. Knipping, M. O. Westendorp, et al.1994. The role of APO-1-mediated apoptosis in the immune system. Immunol. Rev. 142: 175–191.
26. Kroemer, G., N. Zamzami, and S. A. Susin. 1997. Mitochondrial control of apoptosis. Immunol. Today 18:44–51.
27. La Russa, V. F., and B. L. Innis. 1995. Mechanisms of dengue virus-induced bone marrow suppression. Bailliere’s Clin. Haematol. 8:249–271. 28. Liles, W. C., P. A. Kiener, J. A. Ledbetter, A. Aruffo, and S. J. Klebanoff.
1996. Differential expression of Fas (CD95) and Fas ligand on normal hu-man phagocytes: implications for the regulation of apoptosis in neutrophils. J. Exp. Med. 184:429–440.
29. Lynch, D. H., F. Ramsdell, and M. R. Alderson. 1995. Fas and FasL in the homeostatic regulation of immune responses. Immunol. Today 16:569–574. 30. Macho, A., M. Castedo, P. Marchetti, J. J. Aguilar, D. Decaudin, N. Zamzami, P. M. Girard, J. Uriel, and G. Kroemer.1995. Mitochondrial dysfunction in circulating T lymphocytes from human immunodeficiency virus-1 carriers. Blood 86:2481–2487.
31. Mackay, C. R. 1991. T-cell memory: the connection between function, phe-notype and migration pathways. Immunol. Today 12:189–192.
32. Matsubara, K., M. Kubota, K. Kuwakado, H. Hirota, Y. Wakazono, Y. Akiyama, Y. H. Mikawa, and S. Adachi.1994. Induction of apoptosis in childhood acute leukemia by chemotherapeutic agents: failure to detect evidence of apoptosis in vivo. Eur. J. Haematol. 52:47–59.
33. McCullough, K. C., R. Schaffner, W. Fraefel, and U. Kihm. 1993. The relative density of CD44-positive monocytic cell populations varies between isolations and upon culture and influences the susceptibility to infection by
on November 9, 2019 by guest
http://jvi.asm.org/
African swine fever virus. Immunol. Lett. 37:83–90.
34. Miyawaki, T., T. Uehara, R. Nibu, T. Tsuji, A. Yachie, S. Yonehara, and N. Taniguchi.1992. Differential expression of apoptosis-related Fas antigen on lymphocyte subpopulations in human peripheral blood. J. Immunol. 149: 3753–3758.
35. Muro-Cacho, C. A., G. Pantaleo, and A. Fauci. 1995. Analysis of apoptosis in lymph nodes of HIV-infected persons: intensity of apoptosis correlates with the general state of activation of the lymphoid tissue and not with the state of disease or viral burden. J. Immunol. 154:5555–5564.
36. Nicoletti, I., G. Migliorati, M. C. Pagliacci, F. Grignani, and C. Riccardi. 1991. A rapid and simple method for measuring thymocyte apoptosis by propidium iodide staining and flow cytometry. J. Immunol. Methods 139: 271–279.
37. Ormerod, M. G., M. K. L. Collins, G. Rodriguez-Tarduchy, and D. Robert-son.1992. Apoptosis in interleukin-3-dependent haematopoietic cells. Quan-tification by two flow cytometric methods. J. Immunol. Methods 153:57–65. 38. Petit, P. X., J. E. O’Connor, D. Grunwald, and S. C. Brown. 1990. Analysis of the membrane potential of rat and mouse liver mitochondria by flow cytometry and possible applications. Eur. J. Biochem. 194:389–397. 39. Petit, P. X., H. Lecoeur, E. Zorn, C. Dauguet, R. Mignotte, and M.-L.
Gougeon.1995. Alterations in mitochondrial structure and function are early events of dexamethasone-induced thymocyte apoptosis. J. Cell Biol. 130: 157–167.
40. Razvi, E. S., and R. M. Welsh. 1993. Programmed cell death of T lympho-cytes during acute viral infection: a mechanism for virus-induced immune deficiency. J. Virol. 67:5754–5765.
41. Ressang, A. A. 1973. Studies on the pathogenesis of hog cholera. II. Virus distribution in tissue and morphology of the immune response. Zentralbl. Veterinaermed. Reihe B 20:272–288.
42. Russell, J. H., C. L. White, D. Y. Loh, and P. Meleedy-Rey. 1991. Receptor-stimulated death pathway is opened by antigen in mature T cells. Proc. Natl. Acad. Sci. USA 88:2151–2155.
43. Saalmu¨ller, A., and M. J. Reddehase. 1988. Immune system of swine: dis-section of mononuclear leukocyte subpopulations by means of two-colour cytofluorometric analysis. Res. Vet. Sci. 45:311–316.
44. Saalmu¨ller, A. 1996. Characterization of swine leukocyte differentiation an-tigens. Immunol. Today 17:352–354.
45. Saalmu¨ller, A., F. Weiland, and M.-J. Reddehase. 1991. Resting porcine T lymphocytes expressing class II major histocompatibility antigen. Immuno-biology 183:102–114.
46. Savill, J. S., P. M. Henson, and C. Haslett. 1993. Phagocyte recognition of cells undergoing apoptosis. Immunol. Today 14:131–136.
47. Scott, D. W., T. Grdina, and Y. Shi. 1996. T cells commit suicide, but B cells are murdered! J. Immunol. 156:2352–2356.
48. Shen, Y., and T. E. Shenk. 1995. Viruses and apoptosis. Curr. Opin. Genet. Dev. 5:105–111.
49. Summerfield, A., and K. C. McCullough. 1997. Phenotype and adhesion molecule expression of porcine myeloid bone marrow cells. J. Leukocyte Biol. 62:176–185.
50. Summerfield, A., M. A. Hofmann, and K. C. McCullough. Submitted for publication.
51. Summerfield, A., H.-J. Rziha, and A. Saalmu¨ller. 1996. Functional charac-terization of porcine CD41CD81extrathymic T lymphocytes. Cell.
Immu-nol. 168:291–296.
52. Susa, M., M. Ko¨nig, A. Saalmu¨ller, M. J. Reddehase, and H. J. Thiel. 1992. Pathogenesis of classical swine fever: B-lymphocyte deficiency caused by hog cholera virus. J. Virol. 66:1171–1176.
53. Tanaka, M., T. Suda, T. Takahashi, and S. Nagata. 1995. Expression of the functional soluble form of Fas ligand in activated lymphocytes. EMBO J. 14:1129–1135.
54. Thiel, H.-J., G. W. Plagemann, and V. Moennig. 1996. Pestiviruses, p. 1059– 1073. In B. N. Fields, D. M. Knipe, P. M. Howley, et al. (ed.), Fields virology. Lippincott-Raven Publishers, Philadelphia, Pa.
55. Trautwein, G. 1988. Pathology and pathogenesis of the disease, p. 27–54. In B. Liess (ed.), Classical swine fever and related infections. Martinus Nijhoff Publishing, Boston, Mass.
56. Van Oirshot, J. T., D. De Jong, and N. D. H. J. Huffels. 1983. Effects of infection with swine fever virus on immune functions. II Lymphocyte re-sponse to mitogens and enumeration of lymphocyte subpopulations. Vet. Microbiol. 8:81–95.
57. Zamzami, N., P. Marchetti, M. Castedo, C. Zanin, J.-L. Vayssie`re, P. X. Petit, and G. Kroemer.1995. Reduction in mitochondrial potential consti-tutes an early irreversible step of programmed lymphocyte death in vivo. J. Exp. Med. 181:1661–1672.