Theses
Thesis/Dissertation Collections
7-2016
Remote Access and Computerized User Control of
Robotic Micromanipulators
Ryan M. Dunn
[email protected]Follow this and additional works at:
http://scholarworks.rit.edu/theses
This Thesis is brought to you for free and open access by the Thesis/Dissertation Collections at RIT Scholar Works. It has been accepted for inclusion in Theses by an authorized administrator of RIT Scholar Works. For more information, please [email protected].
Recommended Citation
Ryan M. Dunn
A Thesis Submitted in Partial Fulfillment of the Requirements for the Degree of Master of Science
in Mechanical Engineering
Supervised by
Assistant Professor Dr. Michael Schrlau Department of Mechanical Engineering Kate Gleason College of Engineering
Rochester Institute of Technology Rochester, New York
July 2016
Approved by:
Dr. Michael Schrlau, Assistant Professor
Thesis Advisor, Department of Mechanical Engineering
Dr. Kathleen Lamkin-Kennard, Associate Professor Committee Member, Department of Mechanical Engineering
Dr. Mark Kempski, Professor
Committee Member, Department of Mechanical Engineering
Dr. Alan Nye, Professor
Acknowledgments
I would like to thank my labmates for assisting me with my research and
making the NBIL an enjoyable place to learn and work. Masoud has been a
valuable member of the lab for the entire duration of my work. Anna, Olivia,
and Adeel are great colleagues and sources of both help and entertainment. I
wish good luck to Christina, James and Devarsh on the continuation of their
research. I hope to remain friends with all of you.
Thanks as well to Sam, my first and oldest friend at RIT. Thank you Mike and
Nikki, my parents and role models, for raising me with good values and giving
me a great education. And thank you to Ruth Schirmer for giving me a
Rochester family.
Most importantly, thank you Dr. Schrlau for introducing me to the NBIL,
encouraging me to pursue research and for supporting me all throughout it.
Dr. Schrlau provided me with assistance when I needed it, encouragement when
I needed it, and independence when I needed it. I could not have hoped for a
Abstract
Remote Access and Computerized User Control of Robotic Micromanipulators
Ryan M. Dunn
Supervising Professor: Dr. Michael Schrlau
Nano- and micromanipulators are critical research tools in numerous fields including
micro-manufacturing and disease study. Despite their importance, nano- and
microma-nipulation systems remain inaccessible to many groups due to price and lack of
portabil-ity. An intuitive and remotely accessible manipulation system helps mitigate this access
problem. Previously, optimal control hardware for single-probe manipulation and the
effect of latency on user performance were not well understood. Remote access demands
full computerization; graphical user interfaces with networking capabilities were
devel-oped to fulfill this requirement and allow the use of numerous hardware controllers.
Virtual environments were created to simulate the use of a manipulator with full
para-metric control and measurement capabilities. Users completed simulated tasks with each
device and were surveyed about their perceptions. User performance with a
commer-cial manipulator controller was exceeded by performance with both a computer mouse
and pen tablet. Latency was imposed within the virtual environment to study it’s effects
and establish guidelines as to which latency ranges are acceptable for long-range remote
manipulation. User performance began to degrade noticeably at 100 ms and severely
at 400 ms and performance with the mouse degraded the least as latency increased. A
computer vision system for analyzing carbon nanotube arrays was developed so the
com-putation time could be compared to acceptable system latency. The system characterizes
the arrays to a high degree of accuracy and most of the measurement types of obtainable
Contents
Acknowledgments . . . iv
Abstract . . . v
1 Introduction . . . 1
1.1 Motivation . . . 1
1.2 Research Goals . . . 4
1.3 Literature Review . . . 7
1.3.1 Manipulators and Manipulator Control . . . 7
1.3.2 Latency and Long-Range Control . . . 9
2 Control Hardware . . . 14
2.1 Introduction . . . 14
2.2 Experimental Design . . . 15
2.2.1 Control Device Selection . . . 15
2.2.2 Virtual Task Design . . . 18
2.2.3 Numerical Analysis . . . 21
2.2.4 Qualitative Survey . . . 24
2.3 Results . . . 26
2.4 Unused Tasks . . . 29
3 Latency . . . 32
3.1 Introduction . . . 32
3.2 Methods . . . 33
3.2.1 Control Device Selection . . . 33
3.2.2 Task Selection and Design . . . 34
3.2.3 Testing Procedure . . . 37
3.2.4 Data Analysis . . . 40
3.3 Results . . . 41
3.3.1 Task Performance . . . 41
4 Remote User Interfaces . . . 48
4.1 Graphical User Interfaces . . . 48
4.1.1 Robust GUI . . . 49
4.1.2 Minimal GUI . . . 56
4.2 Performance Evaluation . . . 57
4.3 Remote Access Implementations . . . 61
5 CNT Array Characterization . . . 64
5.1 Introduction . . . 64
5.2 System Overview . . . 67
5.3 Pre-Processing . . . 67
5.3.1 Tophat Intensity Filtering . . . 68
5.3.2 Contrast Thresholding . . . 69
5.4 Processing of Individual Pores . . . 72
5.4.1 Shape Analysis . . . 72
5.4.2 Height Analysis . . . 74
5.4.3 Pore Aggregation . . . 75
5.5 Results and Discussion . . . 76
5.5.1 Validation . . . 77
5.5.2 Lattice Layer Removal . . . 78
6 Conclusions . . . 82
Bibliography . . . 86
A Selected MATLAB Functions . . . 92
A.1 Main CNT Array Analysis Function . . . 92
List of Tables
2.1 Summary of selected hardware control devices. . . 16
2.2 Average performance time, adjusted performance time, and device perfor-mance rank across all users. . . 27
2.3 Averages of user performance standard deviations with each device and the number of users that exibited relative performance with each device. . 28
2.4 Aggregated results of pre-and post survey . . . 29
3.1 Summary of selected hardware control devices. . . 34
3.2 Linear regression slope and goodness of fit for completion times for each test and device. . . 41
3.3 Slope and goodness of fit for the linear regression of the standard deviation between task completion time and latency. . . 44
3.4 Severity of performance degradation. . . 45
4.1 Average error E, average move duration ∆t, and clustering values C for control with and without the GUI. . . 60
4.2 Comparison of MATLAB, JAVA, SSH, RPD and TeamViewer remote access methods. . . 63
5.1 Intensity ranges corresponding to geometric features . . . 71
5.2 Pore parameters obtained during individual processing . . . 73
5.3 Aggregated parameters of the visible array. . . 75
5.4 Aggregated comparison of manual measurement and automated measure-ment of an AAO membrane. Units in px and px2. . . 77
5.5 Aggregated comparison of manual measurement (n = 35) and automated measurement (n=70) of the CNT Array. Lengths are reported in nm. . . . 79 5.6 Surface characteristics of MA (n = 406), MB (n = 357), p of the ANOVA
List of Figures
1.1 Eppendorf Tranksferman NK2 micromanipulator and Control Unit . . . 2
1.2 Schematic showing information flow between components of a remote nano-or micromanipulation system . . . 5
2.1 Logitech 3D Pro velocity control joystick. . . 17
2.2 Wacom model CTH 680 pen tablet. . . 17
2.3 Software flow of the hardware performance testing procedure. . . 19
2.4 Interface for launching virtual environment hardware tests. . . 20
2.5 Example of a small obstacle field for hardware controller tests. . . 21
2.6 Single user hardware test performance data with average performance for each device. . . 22
2.7 Illustration of user performance adjustment based on task difficulty. . . 23
2.8 Single user hardware test performance data with linear fit for each device. 24 2.9 Example of Likert scale question from hardware device study post-survey 25 2.10 Example of Ranking question from hardware device study post-survey . . 25
2.11 One-Way ANOVA test of user’s mean adjusted performance between each device and all performance times between each device. . . 27
2.12 Example tasks for path following hardware conroller performance test. . . 30
3.1 Illustration of the virtual environment Approach, Slow Approach, and Nudge test. . . 35
3.2 Overall test procedure including software flow for latency testing. . . 38
3.3 Illustration of an ordered test procedure (top) and a randomized test pro-cedure designed to eliminate bias from fatigue (bottom) . . . 39
3.4 Average completion time for approach test at randomly ordered 20 ms la-tency intervals arranged by lala-tency (left) and arranged in order of comple-tion (right). . . 39
3.5 Results of each test including 95 % confidence intervals of the means using the mouse, tablet, and joystick. . . 42
3.8 Frequency of qualitative acceptance (light) and rejection (dark) at each blindly and randomly sampled latency. . . 46
4.1 System layout illustrating the transfer of information between system com-ponents for manipulator GUIs. . . 50 4.2 Software flow of the main loop for the Robust GUI. . . 54 4.3 Demonstration of Continuous Move and Multi-Move functionality at 10x
magnification. . . 58 4.4 The letters NBIL etched automatically in negative photoresist using the
NBIL GUI with an Eppendorf Transferman NK2 micromanipulator. . . 59 4.5 Comparison of accuracy between Robust GUI and traditional manipulator
control. . . 60
5.1 Software flow of CNT-array characterization system. . . 68 5.2 Comparison of contrast adjusted CNT array SEM of a region shadowed by
another device before and after Tophat filtering. . . 69 5.3 Identifiable geometric features of AAO membranes before and after
manu-facturing of the CNT array. . . 70 5.4 Histogram of typical CNT array with hmin and hmax labeled along with
corresponding geometric features represented by each intensity range. . . . 71 5.5 Typical well imaged CNT array before and after thresholding. . . 72 5.6 An example of CNT wall detection showing the original SEM micrograph
and the centerline of the CNT wall. . . 74 5.7 Schematic of parameters used in height calculation based on tilt. . . 75 5.8 Procedurally generated centroid-to-centroid links of a porous AAO
mem-brane. . . 76 5.9 Portion of membrane with identified pores outlined in white and centroids
labeled in red. . . 78 5.10 False negative occurring when two pores are connected by a shaded area
of the membrane. . . 78 5.11 Segments of two AAO membranes polished with diamond suspension at
150 RPM. The membranes were polished for 12 min at 15 N (a), and 18 min at 30 N (b). . . 79 5.12 Histogram of deq for MA and MB including a boxplot showing the mean
Chapter 1
Introduction
Micro- and nanomanipulators are high-precision positioning instruments used in
con-junction with high magnification optical and electron microscopes to interact with objects
on the nanometer scale. Biomedical science utilizes such equipment to elucidate the
be-havior of individual living cells at the nanoscale. Many commercial nanomanipulator
control systems and devices are unintuitive and expensive, preventing educators and
re-searchers from utilizing them as tools to teach or study nanoscience.
1.1
Motivation
Manipulators are critical tools for a wide variety of applications ranging from cell
injection to nano-assembly. Commercial manipulators move at least one end effector
typ-ically with three or more degrees of freedom. For example, the Eppendorf Transferman
NK2 manipulator shown in Figure 1.1a can move a single end effector in the X, Y, and
Z Cartesian co-ordinates and are used in conjunction with optical microscopes. Using
two, in a dual manipulator arrangement, allows for cell injection by holding a cell with
a suction probe and injecting it with the other. Other micromanipulation systems can
support multiple end-effectors each with up to 6 degrees of freedom.
The manipulators themselves have robust and proprietary control systems built in to
ensure that their actuators drive the end effectors to the correct position based on user
(a) Transferman NK2 motor-module. (b) Transferman NK2 Control Unit
Figure 1.1: Eppendorf Tranksfermank NK2 manipulator (a) and Control Unit (b).
installation can introduce error that the manipulator cannot account for. Many systems
are standalone and do not require the use of a computer workstation. The Eppendorf
Transferman NK2 can operate as a standalone system and has a proprietary joystick
controller shown in Figure 1.1b.
This control system, and others, can receive a command signal from an external source
allowing the manipulator to be controlled from a personal computer. The Transferman
NK2 utilizes serial communication but other manipulators use a variety of
communica-tion protocols and connectors. Control from a personal computer allows for a high degree
of customization and automation using software written in any language supported by
the PC, including MATLAB. For example, cells can be identified using image processing
and probes can be moved to the cell by calculating the difference in their positions.
Com-puterization also allows for additional hardware devices to control a manipulator
pro-vided that the hardware can be interfaced with the PC. Because manipulators are critical
research tools, manipulator automation with custom software is an active field of research
and represents significant potential for manipulator functionality to be expanded.
A field similar to nano- and micromanipulation involves using minimally invasive
does. As a result, surgical technology is more advanced in certain areas. Two such
ar-eas are user control and remote use over long distances. Due to the complex nature of
non-invasive surgical procedures the robotic devices themselves are more articulated and
more difficult to control. Additionally, expert surgeons represent valuable human capital
and long distance access allows them to perform operations from other countries. Not
nearly as much research has been carried out in these areas in regards to nano- and
mi-cromanipulators. Robotic telesurgery technology serves as an important reference for this
research.
Aside from research applications, manipulators have potential as an education tool.
Exposure to STEM fields in high school is important in encouraging students to consider
the pursuit of higher education in engineering. In 2012, the Nano-Bio Interface Lab (NBIL)
demonstrated rudimentary control of a manipulator in a classroom. Students were able
to experience technology hands-on that is usually inaccessible. To date the NBIL has
hosted two demonstrations involving manipulators in the Rochester City School District
(RCSD). Computerized control and remote user interfaces would facilitate more of these
demonstrations as part of the NBIL’s outreach through RIT.
Unfortunately, nano- and micromanipulator technology is prohibitively expensive and
while attempts are being made to reduce the costs of these devices they still remain
inac-cessible to high-school classrooms and represent a significant investment for many labs.
A method of increasing accessibility is to develop software that allows remote access
to these devices. Such software would allow the technology to be used in high school
classrooms as a teaching tool and let students manipulate cells and nanoscale objects
themselves in real-time. Additionally, a remote manipulator system requires an
inexpen-sive and portable control device for use at the remote workstation. For laboratory use,
efficiency in the long term is the primary selection criteria but for hands-on classroom
In conclusion, the motivation of this research is twofold. First, manipulators are
crit-ical research tools but the technology supporting them is not as developed as it could
be, as is evident from relatively more advanced similar technologies. Furthermore,
ma-nipulators could serve as excellent educational tools both for teaching in fields related
to biology or nanotechnology and for demonstrations in primary education. Enabling
remote access to manipulators and improving the user interface through hardware and
software developments represent significant opportunities to advance nano- and
micro-manipulator technology.
1.2
Research Goals
A manipulator control system including alternative control hardware and a remote
access graphical user interface (GUI) allows users to access a manipulator without
physi-cally relocating it. Such a system enables remote use from other laboratories and facilitate
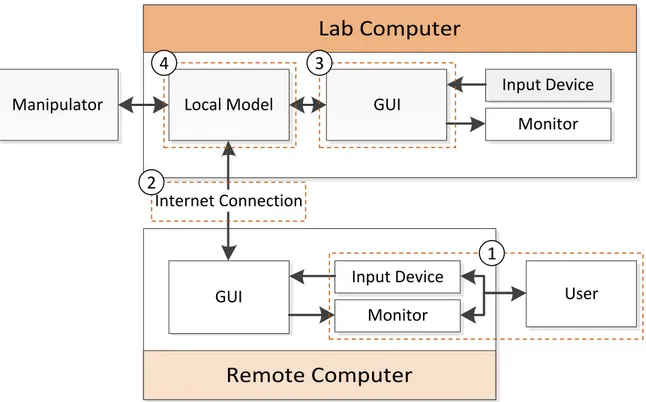
hands-on technology demonstrations for education. Figure 1.2 shows the structure of a
remote manipulation system with each of the focus areas of this research labeled. Each
numerical label corresponds to experimentation towards developing and understanding
long-distance manipulation. The first area relates to manipulator control devices and the
human-computer interface. The second is latency introduced by the Internet connection
and how it effects user performance. The third area involves the developing and testing of
GUIs. The final area relates to automatic processing of the data read by the GUI.
Specifi-cally, a real-time carbon nanotube (CNT) array characterization algorithm was developed
to serve as additional GUI input while operating within the delay ranges identified in the
Remote Computer
Local Model
GUI
Input Device
Monitor
GUI
Input Device
Monitor
Internet Connection
User
Manipulator
4
3
2
1
Figure 1.2: Schematic showing information flow between components of a remote nano- or micromanipulation system. Focus areas of this research are labeled.
1. Manipulator Control Devices
Accessing microscope cameras from a personal computer has benefits for both
view-ing and recordview-ing and the ability to drive a manipulator from a computer provides
con-venience and flexibility depending on the software used to control it. Controlling a
ma-nipulator through a MATLAB GUI allows for varying levels of automation and flexibility
in control hardware by using different devices as inputs to MATLAB. A complete
manip-ulator GUI has numerous benefits for both frequent and infrequent manipmanip-ulator users.
It was unclear, and not well researched, if commercial control devices for nano- and
micromanipulator control are more effective than alternative devices. A test procedure
was established to gather statistically significant information based on metrics for user
performance evaluation. These metrics included quantitative measurements like speed,
accuracy, precision as well as qualitative metrics like ease-of-use and level of engagement.
develop a procedure to measure them. Multiple candidate hardware devices were
inter-faced with MATLAB and implemented with GUIs. A comprehensive evaluation method
utilizing a virtual environment was developed and multi-user tests were carried out to
systematically evaluate user performance across each device in the context of both
labo-ratory use and education.
2. Understanding Latency
When utilizing a fully computerized manipulation system with digital optics, and
therefore video, the primary performance degradation introduced by long distance
ac-cess is network latency. The effects of latency have been studied for other applications
including robotic telesurgery but these effects are not well understood for micro- and
nanomanipulation. This research forms the basis of understanding the effects of latency
for micro-manipulation and how it differs from other fields. A multi-device virtual
en-vironment test was performed to quantify performance degradation over a range of
im-posed latencies to develop guidelines for which latencies are acceptable with different
hardware controllers. Finally, latency and networking performance is largely dependent
on the remote access implementation. Various implementations, enumerated in Chapter 4
were developed or implemented, and then compared.
3. User Interfaces
Significant prior work in the NBIL has been carried out towards the development of
manipulator GUIs. The first iteration, completed by Nicholas Hensel and continued by
myself is robust, but computationally expensive and difficult to add complex features
to. It was possible that this research would benefit from a new, simpler GUI or a lighter
version of the existing GUI [1]. A minimal, expandable GUI was developed to be used
Hybrid automation is an excellent tool to enhance user performance through
comput-erization. By processing the visual input to a GUI, information about the viewing area
can be calculated and used to provide real time information to the user. This information
can also be used to drive enhanced control features. For example, image processing can
be used to identify cells allowing injection to be carried out automatically.
The NBIL also performs research relating on the development of CNT arrays. When
fabricating CNT arrays numerical geometric analysis must be carried out to monitor the
manufacturing process. Imagining the arrays and taking a battery of measurements
man-ually is tedious and subject to human error. Performing these measurements
automat-ically at the point of capture improves rapidity and effectiveness of the development
process. These computer vision driven calculations can potentially be too
computation-ally expensive to run in real time. Once the impact of performance from latency was well
understood, the computations with acceptable processing time can be identified.
1.3
Literature Review
1.3.1 Manipulators and Manipulator Control
Micro- and nanomanipulators provide the ability to maneuver and position
micro-and nanoscale objects to precise locations micro-and orientations. Used in conjunction with
op-tical and electron microscopes, these ultrahigh-precision positioning instruments enable
functions critical for many micro- and nanoscale applications, such as manufacturing and
biomedicine. In manufacturing, manipulator systems have been employed to automate
the maneuvering and positioning of small objects in order to produce patterns, structures,
and devices. For example, Capelleri et. al. developed caging grasps for micro assembly capable of accurately positioning micro objects using an array of probes [2, 3].
probes inside living cells and tissue. Cell injection is a large area of research; Wanget. al.
developed a method of carrying out cellular injection using probes at a high rate and with
minimal user intervention [4]. Grippers are used in addition to pipettes for biological
applications. For example, Kimet. al. developed a nanonewton microgripper to analyze the properties of biomaterials [5].
The goal of micro- and nanomanipulator automation is to create a system
requir-ing only minimalistic user intervention, optimally none, to carry out a specific desired
function. In this way, automation of predefined tasks increases precision and
through-put while reducing variability and time. Most automation requires comthrough-puter vision
al-gorithms to access the position of manipulation targets. Wang et. al. also developed high-throughput automatic injection systems and demonstrated their use on zebrafish
embryos [6–8] and contributed image processing techniques for injection automation [9].
Mattoset. al. developed image processing techniques to improve their automated injection process of blastocyst cells [10–14].
However, situations exist, especially in the development and utilization of new tools
and techniques, where the automation and control of these manipulators, and other
re-lated equipment, needs to be flexible and adaptable. For example, in our own work
towards developing carbon nanotube (CNT)-based probes for single cell analysis [15–21],
micro- and nanomanipulators are routinely used to maneuver the functional end of the
probes in order to interface with single living cells in an undetermined manner, often
requiring on-the-fly repositioning or customized movements based on qualitative visual
feedback. Here, the tips of CNT-based probes are manually maneuvered in Cartesian
space by the manipulators joystick and positioned within the intracellular environments
of single living cells under an optical or fluorescence microscope to perform functions
or analysis with tertiary instruments. Hensel et. al. integrated image processing with a custom, extensible and user-friendly interface to create a robust manipulator GUI [1]. The
GUI included automation options and various control methods including cursor
Latency
Nano- and micromanipulation is a tool critical to numerous scientific fields and has
the potential to serve as an educational resource. Many fields including nano-manufacturing
and biomedicine are reliant on these manipulators to develop assembly processes and
elucidate the behavior of cells on an individual level [22, 23]. Nano- and
micromanipula-tion technology is cost prohibitive for many labs and classrooms, limiting their use. One
solution to overcome limited access is to enable manipulators to be accessed remotely.
Bolopionet. al. developed an environment for SEM control that reproduces the SEM im-age remotely and allows a user to control a probe using a haptic interface [24]. Bolopion
et. al. emphasized the negative impact that delays can have on haptic coupling. To reduce latency they transmitted numerical data about the sample and reconstructed an image of
it rather than transmitting real-time video. The reported round trip latency of the system
over a distance of about 400 miles from Oldenburg, Germany to Paris, France was only
37 ms although the computation time of the image processing and reconstruction added
to the total system latency [25]. While some groups have developed long-distance remote
manipulation systems, the performance impact from operating remotely is not well
un-derstood [26, 27]. There are numerous other examples of remote systems expanding the
reach of doctors including ”Eye, Robot,” a system for remote ophthalmologic (eye)
exam-inations [28]. A joystick was selected as the user control device and latency is less of an
issue because the doctor is only viewing the patient. The success of remote applications
in medicine and the similarities between them and remote nanomanipulator suggest that
a remote nanomanipulator system will be viable.
The most significant performance issue posed by remote micromanipulation is
la-tency. Even small delays from data transmission and computation time can cause
per-formance degradation and user discomfort [29]. Understanding the acceptable range of
remote manipulation platform and expanding their accessibility for research and
educa-tion. Automated systems relying on visual feedback are also susceptible to latency but
the effects can be mitigated [30]. Unfortunately these techniques are not directly
applica-ble to human-controlled systems where the software cannot judge the intent of the user
beyond the input they provide. Hybrid automation techniques for micromanipulation
such as allowing users to specify a series of manipulations to be carried out all at once
can help mitigate problems arising from latency by reducing the reliance on live visual
feedback [1, 13]. Bohren et. al. describes another hybrid automation technique applicable to manipulation that relies on the system recognizing the intent of the user but is only
possible for tasks that are well defined and structured in advance [31].
Robotic Surgery
A field similar to nano- and micromanipulation is robotic surgery: the use of
mini-mally invasive surgical robots to perform procedures that would otherwise require large
incisions. Surgical technology is more developed than nano- and micromanipulation
technology in a few areas including user control hardware and long range remote
ac-cess [32–35]. Due to the complex nature of non-invasive surgical procedures the robotic
devices themselves are more articulated and more difficult to control [36]. Additionally,
expert surgeons represent valuable human capital and long distance access allows them
to perform operations from other countries [37]. Not nearly as much research has been
carried out in these areas in regards to nano- and micromanipulators. Robotic telesurgery
technology serves as an important reference for this research.
Like micromanipulation, the most serious problem introduced by remote telesurgery
is latency. Significant latency can cripple a surgeons ability to perform precise procedures
and inconsistent latency is almost impossible to adjust to. Latency is an inescapable
prop-erty of communication networks and it can be minimized through robust networks and
errors with increased latency. Latencies below 300ms were deemed ”safe” by all
partici-pants while less than 20 % deemed latencies above 800 ms safe. Xu et. al. concluded that while 300 ms delays are suitable, latencies below 200 ms are ideal for telesurgery. Xuet. al.
also looked to decrease the negative effects of latency by training users in a high latency
environment but found that the acclimation to the latency only lasted a week and warned
against excessive confidence from latency training [39]. Other fields are also concerned
with human perception of delay. Nakamuraet. al.found that humans could adjust to de-lays in prosthetic myoeletric hands up to a delay of 170 ms without feeling uncomfortable
with the performance of the prosthetic [40].
Remote systems, including robotic surgery, present complications relating to
instru-ment control. Surgeons have traditional training and experience with hand tools that only
translate to robotic controls if the robotic controls mimic the hand tools. Furthermore the
surgeries rely on optical tools for visual feedback rather than the naked eye. Control
of articulated, multiple DOF actuators and intraoperative imaging has been the focus of
remote telesurgery over the past decade [33].
While these drawbacks are severe, they can be overcome. Many successful cases of
remote surgery have been reported in the past three years involving manipulators and
procedures of varying complexities. Wirz et. al. reports a successful endonasal surgery with a latency below 100 ms during which the surgeon reported no discernible difference
between local and remote robotic surgery [35].
Control Device Evaluation
Pen tablets are used frequently among professional and amateur digital artists because
the similarity to a traditional artistic medium suits their work better than a mouse and
keyboard. It is possible that these similarities may also extend to manipulator control or
ways users develop an emotional investment in tablet PCs, Zamaniet. al.found that touch interfaces facilitate a heightened connection to the technology they are controlling [41].
The use of pen tablets for educational purposes has also been investigated. Romney
reported an increase in freshman math retention rates with the introduction of Tablet
PCs for note taking [42]. Oviatt et. al. found that, when solving math problems, low-performing students preferred a digital tablet interface while high-low-performing students
preferred traditional pen-and-paper [43]. Problem solving time also increased with the
digital interface likely due to the increased complexity of the system over pen-and-paper.
When using a pen tablet to control a manipulator there is no added complexity for the
user. The manipulators movement is mapped directly and intuitively with the users
movement similar to any hand tool. Due to their adoption in other fields, pen tablets
were strong candidates for alternate manipulator control, particularly for students using
the device for the first time.
Typically, humans have better control over devices in their bare hands than over
de-vices controlled by hardware dede-vices like a joystick due to years of developing fine motor
skills through day-to-day activities. Bare hand tool control is not possible for
microma-nipulators but it is for surgery. There is much more research centered on achieving fine
robotic control for surgery but not for nano- and micromanipulation. However, due to
the similarities between the two fields, much of the research is still applicable to
micro-manipulation. In systems such as these, the target location is identified by the user and
their ability to navigate their device to that location needs to be quantified to evaluate
the effectiveness of the system. The users performance should be measured by speed and
accuracy independently. Human performance with control devices can be evaluated in
virtual environments in a number of different ways. When testing motor skills with a
haptic joystick, O’Malley et. al. tasked users to hit a target with a virtual mass tethered by a spring to another mass they could accelerate using their joystick [45]. Komlodiet. al.
combined a qualitative and quantitative approach to analyze the viability of a Wii remote
with one word” help to develop an understanding of the user’s qualitative experience
with the control device. The virtual environment outlined in [46] is much more
compli-cated than one required to test manipulator control devices but the qualitative analysis is
a valuable reference.
At the Italian Institute of Advanced Robotics’ Biomedical lab (incl. Mattos, Becat-tiniet. al.), path tracing tests were used to evaluate hardware control devices for a surgical laser in a virtual environment [47]. Their evaluation method involved following a
circu-lar path and measuring the deviation from that path. Circles are common laser ablation
paths for surgery. Three non-traditional devices were used: a Microsoft Xbox 360
con-troller, a Dell Latitude XT2 Tablet PC and a Saitek Cyborg Evo Force velocity joystick. A
UniMax Micromanipulator was also used as it is an established device for laser surgery.
The Microsoft controller and Saitek joystick both operated as velocity joysticks while the
Tablet PC used the absolute position of the electronic stylus. Tasks were completed with
visual feedback directly from the microscope and again using a computer display. With
every device, error was reduced when using the computer display over the microscope’s
Chapter 2
Control Hardware
Additional control hardware is required for remote workstations. It is unclear if the
commercial micromanipulator controllers are as effective as widely available alternatives.
A major benefit of controlling a manipulator through a GUI is extensibility to additional
hardware controllers. Price and portability were the primary concerns in the selection
of the control device at the remote workstation. For these reasons a velocity joystick, a
keyboard and mouse, and a pen tablet were selected for consideration. Each of these
devices were interfaced with the MATLAB GUI as a control option at both the local
and remote workstation. A device evaluation program, also programmed in MATLAB
generates a field of targets and obstacles that the user must navigate with each control
device. The completion times for each device were recorded to evaluate the efficiency of
each control device. Additionally, for educational applications, users were surveyed to
determine which devices were the most engaging. Results indicated that mouse control
is more effective than joystick control for single probe manipulation. Tablet control is also
suitable while velocity joystick control is not.
2.1
Introduction
Nano- and micromanipulator technology is prohibitively expensive and while
to these devices. Such software would allow the technology to be used in high school
classrooms as a teaching tool and let students manipulate cells and nanoscale objects
themselves in real-time. Additionally, a remote manipulator system requires an
inexpen-sive and portable control device for use at the remote workstation. There are numerous
possible control devices that fit this need, including a joystick, a mouse and keyboard, or
a pen tablet touch interface. Each of these control devices are explored for potential use
with a remote system. For laboratory use, efficiency in the long term is the primary
selec-tion criteria but for hands-on classroom demonstraselec-tions an engaging control method is
desirable. This chapter describes the methods that were used to identify the most effective
control device for laboratory as well as classroom use.
2.2
Experimental Design
Because this experiment involved human subjects, it required Institutional Review Board Ap-proval. Approval was obtained on October 8th 2015.1
2.2.1 Control Device Selection
Control devices were selected based on cost and widespread familiarity and are listed
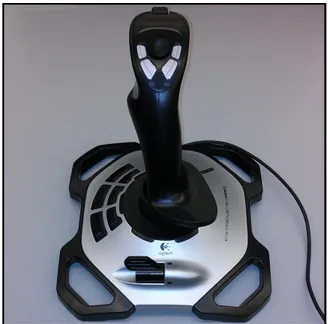
in Table 2.1. Joysticks are common manipulator control devices and were natural
consid-erations for the remote workstation, however joysticks vary dramatically in both price and
design. Joysticks typically operate using positional or velocity control. A velocity control
joystick returns itself to the center position and its deviation from center determines the
velocity of the controlled actuators. A position joystick does not return to center and the
actuators are driven to match the relative position of the joystick. The proprietary joystick
of the Transferman NK2 is a positional joystick seen in Figure 1.1b. The velocity joystick
selected for consideration is a Logitech 3D Pro, seen in Figure 2.1.
Table 2.1: Summary of selected hardware control devices.
Control Device Model Description
Mouse Dell MS111 Traditional PC mouse, widely available.
Pen Tablet Wacom Intuos CTH640
Touch-sensitive tablet utilizing an electronic pen for pressure sensitive cursor control.
Velocity Joystick Logitech 3D Pro 3-DOF (X, Y, Rotation) gaming joystick. Joystick’s position corresponds to cursor velocity.
Position Joystick Transferman NK2
3-DOF joystick with hardware controller for use with Eppendorf micromanipulators. Joystick’s position corresponds to cursor position.
It is important to ensure that the velocity joystick control is tuned to provide the best
user experience possible as to not introduce avoidable control deficiencies to the system.
With the joysticks X and Y positions each ranging from−1 to 1, a dead zone was selected
between −0.05 and 0.05 to ensure it was not too sensitive and the cursors position does
not change while the user has the joystick centered. A scaling coefficient of 10 is applied
to the velocity meaning that the maximum possible speed of the cursor is 10 px/frame
while the test program runs at 10 frame/s. These values were selected through qualitative
testing. If the user feels that the velocity joystick drives the cursor too rapidly, they may
reduce the velocity scaling coefficient using a flap on the joysticks base.
Pen tablets are used frequently among professional and amateur digital artists
be-cause the similarity to a traditional artistic medium suits their work better than a mouse
and keyboard. We desire for students to have a positive experience during technology
demonstrations and it is possible that a tablet will help meet these goals thanks to an
increased tactile connection to the manipulator [41–43]. Determining if a pen tablet
inter-face would create a substantially different user experience, particularly for students, than
more traditional control systems was worth investigation.
A tablet was selected based on price and portability so it is feasible to transport it
for remote use. A Wacom Intuos CTH680 was selected, pictured in Figure 2.2. The pens
position on the tablet controls the X and Y position of the manipulator while the pressure
Figure 2.1: Logitech 3D Pro velocity control joystick.
Figure 2.2: Wacom model CTH 680 pen tablet.
pressure is fully raised while high pressure is fully lowered.) An option for a higher
degree of discretization is included however most single probe manipulator applications
involve two z-levels, one for interacting with the same and one for repositioning the
manipulator freely.
A traditional mouse is also considered as one of the potential control methods for
demonstrations because almost all users will have had experience with them. The mouse
is implemented such that its position controls the X and Y position of the manipulator
may be controlled using a keyboards arrow keys.
2.2.2 Virtual Task Design
In order to determine the effectiveness of manipulator control, certain metrics must
be established as a means of evaluation. Speed is naturally desirable and can usually be
gained by sacrificing accuracy and precision. We seek a control system that maximizes
a combination of these factors. Speed is defined simply as the rate at which operations
can be completed. Hardware design and user proficiency are the major limiting factors
of speed. Each manipulator has a maximum effective speed and when that speed is
faster than comfortable for a particular user they will manually drive the manipulator at
a lower speed, hence the need for variable speed control with any controller. Speed can
also be limited in the software if the application calls for a lower maximum speed than
the hardware’s maximum possible speed, for example if the hardware’s maximum speed
could be damaging to another component or manipulation target.
Various methods of measuring movement accuracy and precision were considered.
The first involved specifying a path for the user to follow with the control device. When
the user completed the movement, a MATLAB algorithm calculated the total area
en-closed by the users path and the specified path. A smaller enen-closed area represented a
more accurate and controlled motion. Any deviation from the path exceeding a specified
distance was considered a failure. Similar task based assessment methods, outlined in
Chapter 1, have been implemented that rely on line following tasks. When operating a
manipulator during typical operations the user generally only needs to move the
end-effector from point to point. The actual path is irrelevant as long as certain obstacles are
maneuvered around and following straight lines is unimportant. To simulate these
re-quirements, the test program generates targets and obstacles that the user must traverse
to and avoid respectively.
The MATLAB test program was designed to be simple and allow the user to rotate
User Draws Path
3 Paths Completed?
Yes Select Controller
No
All Controllers Completed?
Yes
No Generate Random
Targets and Obstacles
Plot Targets and Obstacles
Log Times and Failures for each
Device Start New Run?
Yes
Terminate Program Start Test Program
5
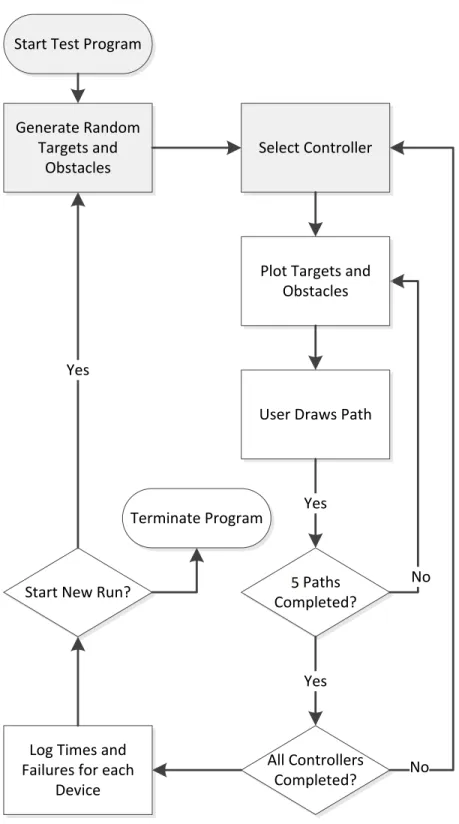
shown in Figure 2.3. When beginning the test process, the user is displayed the launch
screen shown in Figure 2.4 accompanied by instructions and may select each of the
con-trollers in any order. 5 random targets and 10 random obstacles are generated when the
program is launched and each time a new run is started. When a user selects a device, the
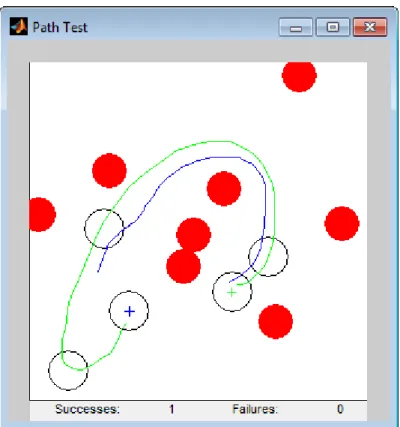
random target field seen in Figure 2.5 is displayed with a start target (a) and a destination
target (b) and must traverse from the start to the destination target while touching every
other target in any order. If the users path reaches each target and crosses no obstacles,
the path is considered successful and the time duration of the path is recorded. When the
joystick is the active device, the cursor location (c) is plotted by the program because the
Windows mouse cursor is not in use. When three paths have been completed the user is
prompted to select a new device. When all the devices have been selected and completed,
the data for the cycle is logged and a new run is started with newly generated targets and
obstacles. The users may select the controllers in any order and are encouraged in the
instructions to vary the order. Finding a users preferred device is desirable and requiring
the users to make a conscious choice in their device selection may help elucidate this
preference.
Figure 2.4: Interface for launching virtual environment hardware tests.
To provide the user with feedback during the test, the program reports the number of
path successes and failures. If a run is a failure because the path crossed an obstacle, the
collision point is highlighted so the user does not have to search for the error and may
Figure 2.5: Sample obstacle field for hardware controller tests showing 5 targets and 8 obstacles including a successful path(green)and a path in progress(blue).
2.2.3 Numerical Analysis
10 users completed 10 obstacle fields with all 4 devices. The users path is fully
recorded however only the overall completion time for successful paths are utilized
be-cause they user may complete the path differently if they find a more efficient path
mean-ing that the time between each target is inconsistent and non-uniform.
The experimental design allows for three major hardware control performance
met-rics. The first and most important is the relative performance with each device. This
metric is the average task completion time with a device over all trials and can be
mea-sured on a per user basis or across all users representing the user’s most effective device
and the most effective device overall respectively. A relatively low task completion time
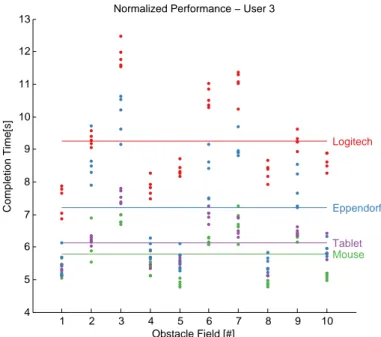
represents good performance. Figure 2.6 shows the average task performance for a single
time, each obstacle field was completed with all 4 devices.
1 2 3 4 5 6 7 8 9 10
4 5 6 7 8 9 10 11 12 13
Normalized Performance − User 3
Mouse
Tablet
Logitech
Eppendorf
Completion Time[s]
Obstacle Field [#]
Figure 2.6: Single user hardware test performance data with average performance for each device.
During the course of the experiment users typically operate each hardware device for
under 15 minutes. During this time a user may develop familiarity with the device. All
users were already familiar with a mouse and a pen tablet is analogous to writing.
Joy-sticks are less common, making it more likely that a user is not already proficient with
one. Because the obstacle fields are not uniformly difficult it is insufficient to compare
ab-solute completion time against obstacle field number for a single device. The completion
times must be normalized by obstacle field difficulty. A sufficient measurement of
obsta-cle field difficulty is the average completion across all four devices because it accounts
for any issues that particular user had with completing the obstacle field. Normalizing a
user’s absolute times for each device by dividing them by their average completion time
for that obstacle field has the added benefit of allowing data to be compared between
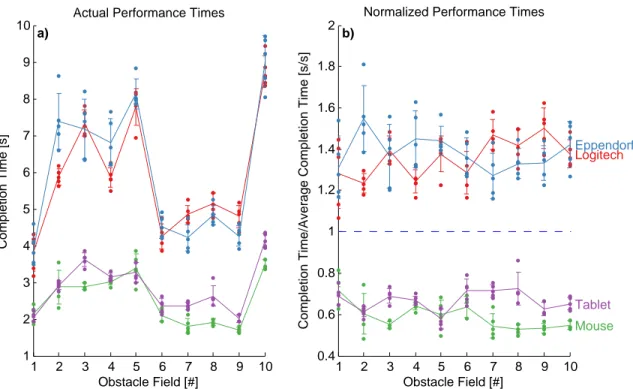
users. Figure 2.7 demonstrates this normalization. The largest changes in actual task
completion time are due to obstacle field difficulty masking trends in user performance.
that the user adjusted to the hardware device faster than with other devices while a
pos-itive slope indicates slower acclimation relative to the other devices. Because the data is
normalized based on performance, if a user did not gain any proficiency with the mouse
but gained proficiency with the other devices the normalized mouse data will increase
with obstacle field number.
1 2 3 4 5 6 7 8 9 10
1 2 3 4 5 6 7 8 9
10 Actual Performance Times
Completion Time [s]
Obstacle Field [#]
a)
1 2 3 4 5 6 7 8 9 10
0.4 0.6 0.8 1 1.2 1.4 1.6 1.8 2
Normalized Performance Times
Mouse Tablet
Logitech
Eppendorf
Completion Time/Average Completion Time [s/s]
Obstacle Field [#]
b)
Figure 2.7: Single user task completion data not controlled by relative task difficulty (left) and controlled by relative task difficulty (right). Error bars represent one stan-dard deviation.
Further tests including Analysis of Variance (ANOVA), measurements of standard
deviation, and analysis of trends within trials were performed and discussed in the results
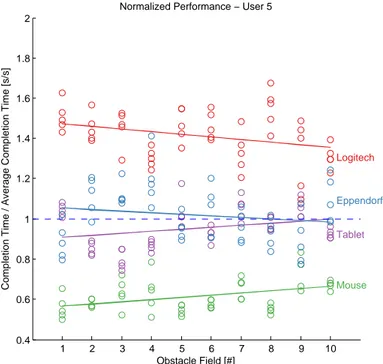
1 2 3 4 5 6 7 8 9 10 0.4
0.6 0.8 1 1.2 1.4 1.6 1.8 2
Normalized Performance − User 5
Mouse
Tablet
Logitech
Eppendorf
Completion Time / Average Completion Time [s/s]
Obstacle Field [#]
Figure 2.8: Single user hardware test performance data with linear fit for each device.
2.2.4 Qualitative Survey
Effectiveness of movement is very important when performing laboratory operations.
For a hands-on classroom demonstration however, students might only operate the
ma-nipulator for a brief period of time in which case qualitative first impressions are
impor-tant. To understand the initial impression of the user they were given a pre-survey and
post-survey. Three styles of questions were used. The first, shown in Figure 2.9, is a
Lik-ert scale that asks the subject to indicate their agreement with a statement. The second,
shown in Figure 2.10, presents a statement and asks the user to rank the devices from 1st to 4thbased on the given criteria. The final type was a single question that asked the user
to circle their preferred device.
The pre-survey contained the following questions:
1. Rank the devices in order of anticipated effectiveness
2. I anticipate that the manipulator will be easy to control with the device
4. Rank the devices in order of effectiveness
5. Rank the devices in order of enjoyment
6. The manipulator was easy to control with the device
7. I got used to using the device quickly
8. This device is suitable for lengthy work requiring manipulation
9. Which device did you prefer overall?
This is an example of the survey taken at the start of the study
Investigator Contact: Ryan M Dunn
[email protected] (919) 800-7225
1) Rank the devices in order of anticipated effectiveness: (1 is the best, 4 is the worst)
Mouse & Keyboard Pen Tablet Logitech Joystick Eppendorf Joystick
2) “I anticipate that the manipulator will be easy to control with the device”
Check one box to indicate if you agree with the statement for each device
Strongly
Disagree Disagree Undecided Agree
Strongly Agree Mouse & Keyboard
Pen Tablet Logitech Joystick Eppendorf Joystick
3) “I anticipate that the device will be enjoyable to use”
Check one box to indicate if you agree with the statement for each device
Strongly
Disagree Disagree Undecided Agree
Strongly Agree Mouse & Keyboard
Pen Tablet Logitech Joystick Eppendorf Joystick
Figure 2.9: Example of Likert scale question from hardware device study post-survey
This is an example of the survey taken at the end of the study
Investigator Contact: Ryan M Dunn
[email protected] (919) 800-7225
1) Rank the devices in order of effectiveness: (1 is the best, 4 is the worst)
Mouse & Keyboard Pen Tablet Logitech Joystick Eppendorf Joystick
2) Rank the devices in order of enjoyment: (1 is the best, 4 is the worst)
Mouse & Keyboard Pen Tablet Logitech Joystick Eppendorf Joystick
3) Which device did you prefer overall? (circle one)
Mouse & Keyboard Pen Tablet Logitech Joystick Eppendorf Joystick
4) “The manipulator was easy to control with the device”
Check one box to indicate if you agree with the statement for each device
Strongly
Disagree Disagree Undecided Agree
Strongly Agree Mouse & Keyboard
Pen Tablet Logitech Joystick Eppendorf Joystick
5) “I got used to using the device quickly”
Strongly
Disagree Disagree Undecided Agree
Strongly Agree Mouse & Keyboard
Pen Tablet Logitech Joystick Eppendorf Joystick
6) “This device is suitable for lengthy work requiring manipulation”
Strongly
Disagree Disagree Undecided Agree
Strongly Agree Mouse & Keyboard
Pen Tablet Logitech Joystick Eppendorf Joystick
Figure 2.10: Example of Ranking question from hardware device study post-survey
While these questions include self-evaluation of user performance, they do not
re-place the actual numerical data. Instead, these questions will elucidate how accurately
the users perceive their personal effectiveness with the device. A Likert scale allows for
ties between devices and rankings do not reveal the magnitude of the difference between
devices. By asking the subject to answer both style of questions a ranking with
mag-nitudes is obtained. All of the questions asked in the pre-survey have corresponding
devices changed after the performance tests. The survey was designed in accordance
with suggestions from Research Methods in Psychology[48]. Examples of both surveys are included in supplemental material.
Due to the relatively small sample size of the study, demographic information was
omitted. Measuring the performance difference across variables like age and gender
would require a much large sample size and is worth considering for future studies.
Additionally, the users were not surveyed about their prior experience with each device
besides the Eppendorf joystick. This omission may have prevented trends based on
par-ticular experience with the pen tablet or Logitech joystick to emerge in the data.
2.3
Results
8 subjects without prior experience with micro-manipulation participated in the study,
completing 10 obstacle fields 5 times with all 4 devices representing 400 measurements
of completion time per device. Data from subjects that had prior experience with
manip-ulation or that did not complete the entire test sequence were not included; fortunately
remaining data were sufficient to obtain statistically significant results (p<0.001). The most significant observation is relative device performance. The adjusted device
performance of an individual user was averaged (Padj) and ranked (Pr). The average
of rankings for all users (Pr) represents which devices consistently performed better or
worse than others while the average performance across all users (Padj) provides a direct
comparison. Table 2.2 shows these values alongside the unadjusted mean performanceP. The mouse was consistently ranked 1stwhile the pen tablet was consistently ranked 2nd. Despite their clear rankings,Pwas similar for the tablet and mouse. The Logitech 3D Pro was most often ranked 4th.
To ensure that the differences in means are statistically significant, a series of
one-way analysis of variance (ANOVA) tests were applied to the data set. An ANOVA test
Device P Padj Pr
Mouse 3.009 0.687 1.125 Pen Tablet 3.514 0.807 1.875 Transferman NK2 5.105 1.142 3.250 Logitech 3D Pro 6.036 1.363 3.750
device. The mouse and tablet had the closest Padj and an ANOVA test between them
yields p = 0.026. An ANOVA test between devices using unadjusted data (d f = 1599) yields clearly unique means with p<0.001 between the closest means. Figure 2.11 shows a graphical representation of the ANOVA tests. Note that none of the device means
(or medians) fall within another device’s expected performance range represented by
the indented region of the box plot. The results of these ANOVA tests indicated that
the differences between device performance are statistically significant with at least 95 %
confidence.
Mouse Tablet Logitech Eppendorf
0.6 0.7 0.8 0.9 1 1.1 1.2 1.3 1.4 1.5
Adjusted Performance Time
One−Way ANOVA of mean adjusted performance times
A)
C) B)
a)
Mouse Tablet Logitech Eppendorf
2 3 4 5 6 7 8 9 10 11 Performance Time
One−Way ANOVA of all performance times
b)
Figure 2.11: One-Way ANOVA test of user’s mean adjusted performance between each devicePadj and all performance times between each device. Arithmetic means
Standard deviations of (Padj) were calculated for each user (σadj) and device and
rep-resent the consistency with which the user completed tasks with that device. σadj, the
mean ofσadj across all devices is shown in Table 2.3. Notablyσadj was the lowest for the
tablet indicating that it was the most consistently performing device despite not being
the best performing device. Additionally the Eppendorf joystick had the highestσadjwith
the 3rdbest performance. One-way ANOVA tests were used to compareσadjbetween
de-vices. The ANOVA test indicated thatσadjfor the mouse and tablet were not significantly
different (p=0.177) suggesting that they are comparably consistent.
Table 2.3: Averages of user performance standard deviations with each deviceσadj
and the number of users that exibited relative performance with each device IN.
Device σadj IN
Mouse 0.217 1 Pen Tablet 0.193 3 Logitech 3D Pro 0.337 5 Transferman NK2 0.407 6
There was no significant statistical positive or negative correlation between the user’s
qualitative assessment of how fast they adjusted to a device and their actual performance.
Accessibility was a primary focus of this experiment and as such it was designed to
measure initial performance. However, proficiency can be gained with each device and
at different rates. Because obstacle fields were randomly generated, transient trends in
performance time P were not expected. Controlling for the obstacle field difficulty, as shown in Figure 2.7, allows relative improvement to be reflected in the slope of Padj vs. obstacle field number. A negative slope indicates that the user improved more with that
device than their average performance. A slope was considered confident if the goodness
of linear fit between Padj and obstacle field number exceeded 0.9. The number of times
a user exhibited relative improvement with a device (IN) is shown in Table 2.3. Notably
more than half of the users showed more improvement with the Logitech 3D Pro and the
Transferman NK2 than the mouse and pen tablet suggesting that the mouse and tablet
”strongly disagree” and 1 corresponding to ”strongly agree.” Similarly ranking questions
were aggregated using the sum of rankings. In both cases a low QN corresponds with
positive responses. Q8 is simply the number of users that selected the device as their
preferred one. As expected most users closely identified which devices they performed
well with. The mouse and tablet were well received both before and after. The Logitech
3D Pro was very poorly received and user perception notably improved for the
Eppen-dorf NK2 (Q2 < Q4). There was no significant correlation between the user’s qualitative
assessment of how fast they adjusted to a device Q7 and their actual performance. The
notable results of the qualitative survey indicate that the Logitech 3D Pro is not a
suit-able device for educational where first impressions are important and the Transferman
NK2 may not be effective for very short use durations where users are unable to obtain
familiarity with the device.
Table 2.4: Aggregated results of pre-and post survey. Questions correspond to those enumerated in Section 2.2.4
Device Q1 Q2 Q3 Q4 Q5 Q6 Q7 Q8 Q9
Mouse 10 14 22 11 13 12 16 11 4
Tablet 26 23 19 13 14 21 19 20 2 Logitech 28 27 24 31 31 28 24 34 0
Eppendorf 16 20 24 25 22 17 17 11 2
2.4
Unused Tasks
As mentioned previously in Section 2.2.2, the design of the tasks in a virtual
environ-ment must closely match the use in a physical system. Some tasks influenced by prior
research were fully implemented by ultimately not used because they were not indicative
of normal use. The original implemented task was path following similar to the task
outlined in [47].
ordered series of connected points. The user must navigate their cursor from start to
finish while following the path as closely as possible. The deviation from the path can
either be calculated as the total area formed by enclosing the user’s path and the target
path or by the RMS deviation at each point along the user’s path. Additional thresholds
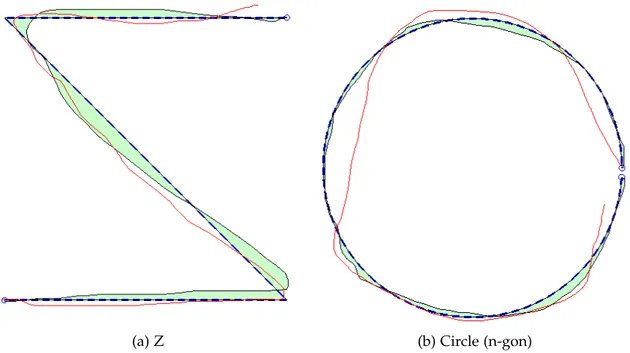
can be set to monitor if the user deviate far enough from the path that the trial would
be considered a failure. Figure 2.12a shows a completed trial with the enclosed area
represented path deviation in green. Figure 2.12b shows a similar trial with a circular
target path.
(a) Z (b) Circle (n-gon)
Figure 2.12: Example tasks for path following hardware conroller performance test. Shown is the current path (red), the approximate error of the previous path (green) and the target path (blue)
The implementation of the task was successful but preliminary trials showed that
results were greatly dependent on the chosen shape. The velocity joystick snapped to
horizontal and vertical lines making paths shaped like rectangles very easy to follow.
The snapping also made splines harder to follow for the velocity joystick. The pen tablet
facilitated small splines to be followed precisely but, similar to hand-writing, straight
Strong performance could be achieved with a particular device by tailoring the task to it.
For this reason random target generation was used for this experiment and following
ex-periments. Random path following tasks were not used because accurate path following
is just as important as simply reaching a manipulation destination for most applications.
More complex physics based tasks, similar to those used in [45], but performance of
Chapter 3
Latency
3.1
Introduction
When utilizing a fully computerized manipulation system with digital optics the
pri-mary performance degradation introduced by long distance access is latency. The effects
of latency have been studied for other applications including robotic telesurgery but these
effects are not well understood for micro- and nanomanipulation. This chapter explores
the effects of latency on the effectiveness of single probe manipulation with a variety of
common hardware control devices. A virtual environment was created where an artificial
latency can be imposed for the completion of a task simulating single probe manipulator
use. The virtual environment can be operated without the use of a physical manipulator
or with the use of the manipulator utilizing image processing to track the location of the
probe. Users completed a variety of manipulation tasks with a position joystick, a
veloc-ity joystick, a computer mouse and a pen tablet while their performance was quantified
over a range of imposed latencies. Qualitative satisfaction was recorded to determine
ac-ceptable latency ranges for remote operation of nano- and micromanipulators. The study
revealed that as latency increased, user performance degraded the most for the joysticks
and degraded less for both the mouse and pen tablet.
ulator control joystick. Each device was tested at a range of blind and random sampled
latencies in a controlled virtual environment using three tasks that simulate normal
ma-nipulator use. The performance with each device was quantified and evaluated to observe
trends in performance with increased latency and users were polled about which latencies
they considered acceptable. This chapter concludes with guidelines for handling latency
and selecting a hardware controller for remote workstations.
3.2
Methods
3.2.1 Control Device Selection
The latency testing was carried out with three hardware devices that are candidates
for remote access workstations and one proprietary micromanipulator controller. The
three main criteria considered when selecting a control device for a remote workstation
were familiarity, portability, and cost. When using a familiar device, users are more
likely to perform manipulations successfully [49]. Portability and low cost facilitate the
implementation of a remote workstation with minimal difficulty. The candidate devices,
outlined in Table 3.1, include a joystick, a mouse, and a pen tablet. These devices are the
same as those in Chapter 2 with the exception of the Standalone Joystick. Each candidate
device is low-cost and portable which is beneficial for remote access.
Joysticks are common manipulator control devices making them natural options for
remote workstations. Joysticks vary dramatically in both price and design and typically
operate using position or velocity control. A velocity (relative) control joystick returns
itself to the center position usually by spring action and its displacement determines the
velocity of the controlled actuators. A position (absolute) joystick does not return to
center and the actuators are driven to match the relative position of the joystick.
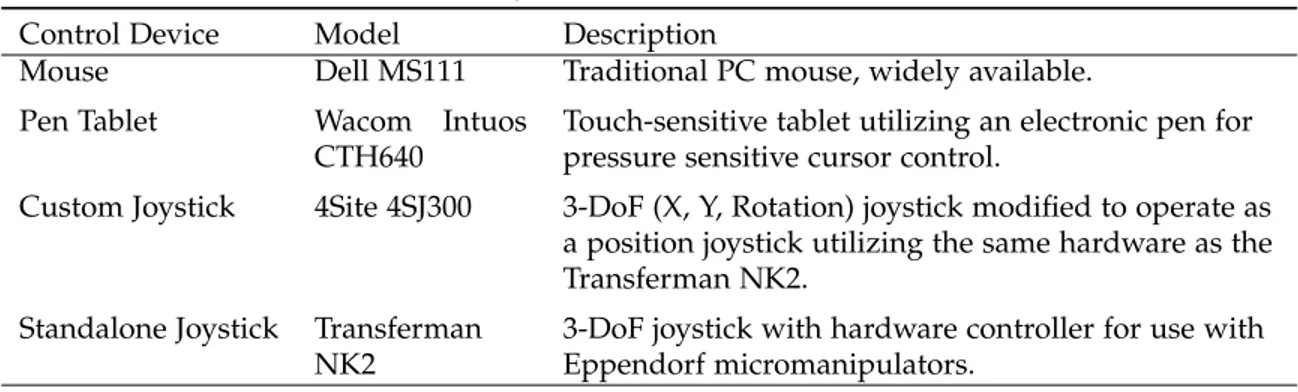
Table 3.1: Summary of selected hardware control devices.
Control Device Model Description
Mouse Dell MS111 Traditional PC mouse, widely available.
Pen Tablet Wacom Intuos CTH640
Touch-sensitive tablet utilizing an electronic pen for pressure sensitive cursor control.
Custom Joystick 4Site 4SJ300 3-DoF (X, Y, Rotation) joystick modified to operate as a position joystick utilizing the same hardware as the Transferman NK2.
Standalone Joystick Transferman NK2
3-DoF joystick with hardware controller for use with Eppendorf micromanipulators.
Eppendorf micromanipulators and has a 3 DOF joystick. A modified standalone joystick
was created for latency testing utilizing similar hardware to the Transferman NK2. It
consists of the same 3 DOF joystick as the NK2 but is interfaced with MATLAB by Serial
connection to an Arduino programming board. For latency testing with both joysticks a
mapping was assigned such that the edges of the joysticks range of motion corresponds
with the edges of the virtual environment. The computer mouse was selected due to
wide familiarity and availability. The pen tablet was selected because it was shown to be
particularly effective at offering a high level of engagement when used for educational
purposes [41–43]. Other manipulation systems utilize other controllers, such as haptic
feedback devices [25, 50], but these devices were not utilized in this study because they
are more expensive and less intuitive than the selected devices making them less suitable
for wide adoption in the future.
3.2.2 Task Selection and Design
Virtual environment testing is a common tool for evaluating task performance and
allows all aspects of a task to be quantified and timed while artificially imposing precise
latencies. A virtual environment was developed to study the effect of latency on
micro-manipulator tasks. It is important for tasks in a virtual environment to simulate real tasks
users perform during micromanipulator applications. Tasks were selected based on two
primary requirements. The first requirement was that the task is similar to actual
were preferred. Three independent tasks were selected for this purpose and are listed in
the order of least complex to most complex, as shown in Figure 3.1: Approach, Slow
Ap-proach, and Nudge. Other tests were considered and implemented but ultimately were
not used in the study because they did not simulate realistic uses of the manipulators. An
example of such a task was a line-following test with performance measured as the total
deviation from the target line. Line following is quantifiable however manually driving
a manipulator in perfectly straight lines is not a typical use scenario. In every task the
visual feedback provided to the user was delayed by the imposed latency.
heig
h
t
1
1
1
3
Figure #. Illustration of the Approach test (a), Slow Approach test (b) and the Nudge test.
The cursor (1), the current randomly generated target (2) and the virtual object used in
the Nudge test (3) are shown.
2
350
px
2
350 px
𝑉<
75 px/s
1
1
2
1
3
a)
b)
c)
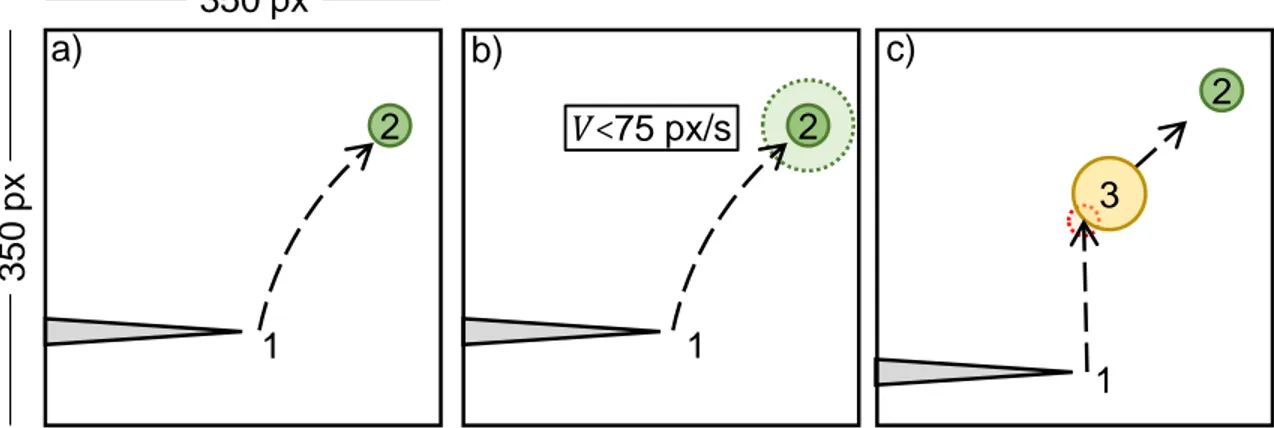
Figure 1
Figure 3.1: Illustration of the Approach test (a), Slow Approach test (b) and the Nudge test. The cursor (1), the current randomly generated target (2) and the virtual object used in the Nudge test (3) are shown.
The Approach task prompts the user to drive the cursor to a randomly generated
target location. This task is the simplest and there is no way for the user to fail an
attempt. The user must navigate the cursor to the randomly generated target at which
time a new target is generated. The new target always appears