Direct Reaction of Silicon with Ethyl
Chloride in a Fluidized Bed Reactor
Ihsan Hamawand
∗Thamer Mohammed
†Moayyed G. Jalhoom
‡∗Monash University, [email protected] †University of Technology, Baghdad, thamer [email protected] ‡Ibn Sina State Company, Baghdad, [email protected] ISSN 1542-6580
Abstract
The aim of this work was to study the production of diethyldichlorosilane [(C2H5)2SiCl2]. The catalytic reaction of silicon (Si) of purity 99.9% with ethylchlo-ride (C2H5Cl) was investigated in a fluidized bed reactor. Cuprous chloethylchlo-ride (CuCl) of purity 99.9% was used as a catalyst of the reaction. Gas chromatography was used on-line for analysis of the reaction products. The experimental work was car-ried out using a stainless steel column of 5cm internal diameter and 50cm height as the fluidized bed reactor.
The experiments start with different bed temperatures between 200 and 300 C to identify the optimum reaction temperature. This temperature was found to be at 250 C, which resulted in the maximum of ethylchloride (EtCl) conversion and diethyldichlorosilane yield. In fifteen runs, the variables considered were sieve-analysis average particle size dp (50,100, and 150 µm), contact mass weight wt (100 – 200 gm) and reacted gas velocity Ug (1.41 – 2.83 cm/s). It was found that the conversion of EtCl increases with decreasing reacted gas velocity, increasing bed contact mass and particle diameter. The yield of Et2SiCl2was not affected by these variables, but bed temperature was found to have a significant affect.
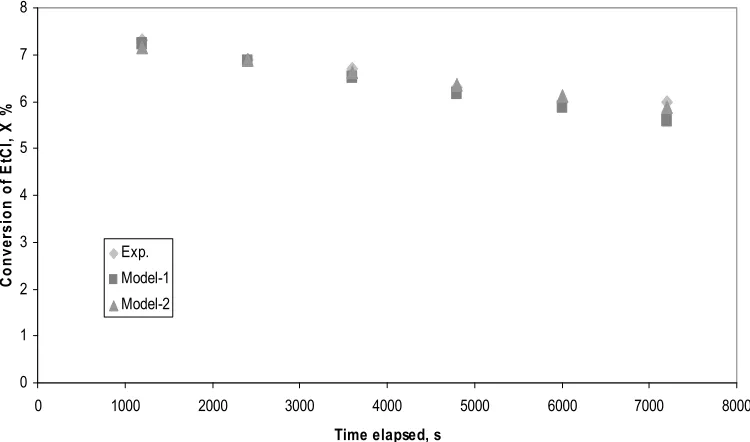
Two mathematical models, the Orcut model and the continuous CSTR model were used to predict theoretical data for the conversion of EtCl. The comparison be-tween the experimental and the theoretical data showed good agreement with an absolute error of less than 9%.
Introduction
The discovery of the ‘Direct Synthesis’ or ‘Direct Process’ for organochlorosilanes by Rochow and Muller, generally referred to as the Rochow process, promptly led to the first practical large scale production of organosilanes and silicone polymers. The silicones industry proceeded to expand rapidly starting in the 1940’s.
Rochow (1945), effected a reaction between the silicon and the hydrocarbon halide while the latter was in vapor state, and, associated with a metallic catalyst (e.g. copper) for the reaction.
Rochow and Patnode, (1945), found that the efficient utilization of methyl chloride is enhanced as the proportion of the metallic catalyst, specifically copper, is increased up to about 10. Ward and et al., (2001), described a method for enhancing the formation of alkylhalosilane during the direct method reaction between powdered silicon and a catalyst comprising copper, zinc, tin, and phosphorus.
The direct process is operated primarily for the commercial production of methylchlorosilanes for this reason the most published papers and patent are concerned the reaction of silicon and methylchloride [ Bablin et al.(2002), De Cookerand et al., 1975, Flaquent et al., 1994, Gasper Galvin et al., 1991, Jung, 1996, lewis Larry N. et al., 20002]. Ethylchlorosilanes were manufactured in the soviet union, polyethylsiloxane products used in various branch of engineering; fluids, lacquers, rubbers, elastomers, compounds [Endovin 1997]. Ethyl silicones produced from (C2H5)2SiCl2 like methyl and phenyl polymers, are used in
electrical varnishes, hydraulic and heat transfer fluids and lubrication however (C2H5)SiHCl2 is the major objective of commercial operation in the Soviet Union,
the objective is unknown [Lewis and Rethwish, 1993].
A great number of papers have been written about how to increase the selectivity for dimethyldichlorosilane which result from the reaction of silicon with methylchloride and copper (or its compounds as a catalyst), promoters [Kuivila et.al., 1996, Kim et.al., 1992, Olakangil et.al., 2000], however there is little known about the reaction with ethylchloride. Ethylchloride was chosen to be the reacted gas with silicon as the topic of this paper given the lack of published literature.
The copper catalyzed reactions of ethyl halides with silicon give fair yields of the corresponding ethylhalosilanes. Some of the many reaction products are shown in Equations (1).
C2H5Cl+Si/CuCl
The uncatalyzed reaction of ethyl chloride with silicon is initiated above 300oC. This event may be the result of dehydrohalogenation of ethyl chloride and subsequent reaction of ethyl chloride with trichlorosilane. In the presence of copper, initiation occurs about 200oC. Selectively to (C2H5)2SiCl2 is improved by
copper catalysis and lower reaction temperatures. Under favorable catalytic and fluidization conditions, (C2H5)2SiCl2 yields of up to 65wt. % are obtained [Lewis
and Rethwish, 1993].
The aim of the present work was to investigate the Production of product mixture especially Et2SiCl2 by the reaction of EtCl with silicon using CuCl as
catalyst in fluidized bed reactor at different parameters: temperature of the bed, particle diameter, contact mass and reacted gas velocity (EtCl), to find the optimum values and the interaction between these variables. Et2SiCl2 is selected
as the desired product due to its application in the production of polymers. The advantage compared to Me2SiCl2 it can significantly cheapen the manufacture of
organohalosilanes polymers as the boiling points of the ethylchlorosilanes are more widely spread from each other and the separation requires fewer column.
Experimental Work
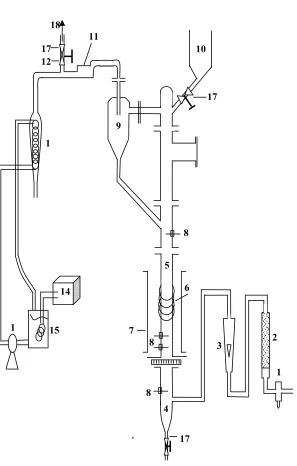
A stainless steel column with (5cm) inner diameter and (50cm) height was used as the ethylchlorosilane reactor, an electrical heater rod with (1.5m) was turned around the column, the outlet from the reactor was connected to a cyclone to collect the fine particle to be recycled to bed; off-gas from cyclone go to a filter to collect any particle that cyclone did not catch. Solids-free off-gas from the filter entered the condenser or the GC. The condenser used ethanol as a cooling liquid, a chiller was used to cool the ethanol and a pump used to recycle the liquid through the condenser. Figure (1) show parts of the reactor system.
The silicon crystal grinder was designed and assembled for this purpose combined of a pressure vessel with stainless steel blades connected to high speed motor at the bottom of the vessel. The silicon crystals were crashed first with a hammer to suitable size for the grinder and then grinded with different residence time in the grinder to have different particle size.
Particle size in micrometers
Min. Max average
25 75 50 75 125 100 125 175 150
Table (1): The average silicon particle size between every two meshes.
Two temperature readers were used, one connected to selector to read temperature in three places (gas inlet, inside the reactor, and the outlet gas), the second read and control the temperature inside the bed.
Analysis:
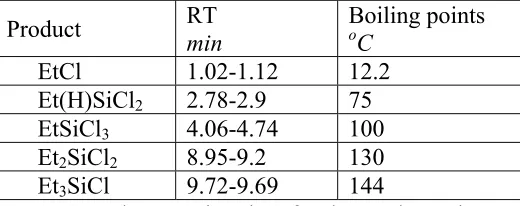
Gas chromatography was used to analyze the reacted gas and the product on-line directly. The GC name is ‘Gaw-Mac Spectra’ by Gaw-Mac internment Co. LTD. The retention times for each product are shown in table (2). Table (2) shows the major product of the reaction, other products with less than 1 % were neglected.
Product RT min Boiling points oC
EtCl 1.02-1.12 12.2
Et(H)SiCl2 2.78-2.9 75
EtSiCl3 4.06-4.74 100
Et2SiCl2 8.95-9.2 130
Et3SiCl 9.72-9.69 144
[image:5.612.201.407.108.180.2] [image:5.612.177.437.373.476.2]Figure (1); Reactor system, 1- air filter , 2- silica gel column, 3- flow meter, 4- stainless steel cone under distributor, 5- stainless steel column (diameter = 5 cm), 6- electric heater, 7- jacket aluminum covered with fiber glass, 8- sensors, 9- cyclone, 10- stainless steel feed storage, 11-product filter , 12- connection to GC, 13- condenser, 14- Chiller, 15- ethanol storage vessel, 16- pump, 17- valve, 18- line goes to GC
4 11
9
8
3 2
10
6
8 7 14
1 15
1 18
1 8
5
.
17 12
17
[image:6.612.166.463.112.578.2]Material specification
Silicon [Si];
Reference; Ibn Sina State Company / Baghdad – Iraq. Name: Silicon
Description: crystalline, reflective bluish-black Molecular formula: Si
Molecular Weight: 28 Density: 2.3290 g/cm3 Boiling Point: 1414 C Melting Point: 3265 C
PROPERTY (SOLID PHASE) SPECIFICATION
Si, Wt. % 99
Fe 2000 ppm
Al 2000 ppm
Zn 250 ppm
Ca 200 ppm
P 20 ppm
Cuprous Chloride [CuCl]; Reference; Aldrich
Name: Cuprous Chloride
Description: Greenish Yellow Powder Molecular formula: CuCl
Molecular Weight: 99 Density: 3.53 g/cm3 Boiling Point: 1490 °C C Melting Point: 430 C
PROPERTY (POWDER) SPECIFICATION
CuCl, Wt. % 99.995+ % trace metals basis
Moisture less than 0.5%
Insoluble less than 100ppm
Water Soluble less than 5%
Iron Content Max 30 ppm
Ethylchloride [EtCl];
Reference; Ibn Sina State Company / Baghdad – Iraq. Name: Ethyl Chloride
Description: Colorless Gas Molecular formula: C2H5Cl Molecular Weight: 64.52 Density: 0.9214 g/cm3 Boiling Point: 12.3 C Melting Point: -138.7 C
PROPERTY (GAS PHASE) SPECIFICATION Ethyl Chloride, Wt. % 99
HCl, <10 ppm
Nonvolatile Matter, <10 ppm
Water, <150 ppm
Experimental Procedure
A Typical run began with preparing an amount of pulverized silicon with loading of 15 weight % CuCl [catalyst] of the silicon contact mass, [Wessel and Rethwisch, 1996, Lewis and Ward, 2002], and pouring it inside the reactor from the top. 15 weight % of CuCl was selected for the entire of the experiments due to its higher production of diethyldichlorosilane compare to the other products. The Cu counts of around 10 % of the contact mass because the CuCl contain 62.3 % Cu. The comparison with other percentages CuCl was left over for further work.
Promoter’s usage in methylchlorosilane is to increase the selectivity for diethyldichlorosilane product. The silicon itself contains some impurities including one of the promoters such as Zinc. The promoters have not been used in this study as the CuCl catalyst and the silicon composition used gave the highest diethyldichlorosilane. Usage of promoters could be potential for further work. Set the controller on the reaction temperature (250oC),[ Lewin, 2001, Aramata et.al., 2002], the heater began to work slowly because it was connected to voltage variant which was set on 60%. The temperature rise slowly, to avoid any deflection so the temperature of the reactor did not rise more than ±5oC after reaching the set point of 250oC. Nitrogen (inert gas) was supplied to the reactor at low flow rate after it flowed through 2m long pipe inside furnace to preheat the gas to (150-200oC), then after 15min the flow of Nitrogen was stopped and flow of Ethylchloride (EtCl) began to enter to the pre-heater and then to the reactor.
the line going to the condenser was closed and the line to the GC was opened and vice versa.
Every 20 min the product was injected into the online GC for analysis. These steps were repeated for each parameter.
Models Applied to the Reaction
Two models were used to show the behaviour of the reaction. The first model, which uses the design equation of CSTR, shows the conversion of EtCl as a function of temperature of reaction, contact mass of the bed, molar flow rate of reacted gas, and time, [Voorhoeve, 1997].
In the second model, a material balance was done on the bubble phase to predict the conversion of EtCl as a function of variables included in the design of fluidized bed reactor such as; diameter and height of the bed, temperature of reaction, fluidizing velocity, particle diameter, contact mass (weight of the bed),[ Kunni, 1969, Levenspiel, 1999, Geldart, 1986 ].
Model (1) Kinetic Model
Using the design equation for CSTR reactor (well mixed) which is very near in behavior to fluidized bed reactor [Fogler, 1997].
Also assumed first order decay equation for the deactivation of CuCl catalyst, the deactivation may be a result of formation of coke over the surface of the catalyst[Wessel and Rethwisch, 1996], and also for the decrease in silicon concentration because of consumption.
The final equation after these assumptions shows the conversion of EtCl. The theoretical data from this equation compared with the experimental one and it shows a good agreement.
(
)
Product...(2) 2C2H5 Cl+Si ⎯⎯→) 3 ..( ... ... ... ... ... ... ... ... ... 2
1 2 1
C B
A+ ⎯⎯→
) 4 ..( ... ... ... ... ... ... ... ... ... ... ... 0 =
B θ
The design equation of CSTR is;
) 5 ....( ... ... ... ... ... ... ... ...
S gm
gmol wt
X F r A A
A = ⋅
) 6 ...( ... ... ... ... ... ... ... ο ο ο ο ο υ T R Y Pt A U C F g A A A ⋅ ⋅ ⋅ ⋅ = = ) 7 ...( ... ... ... ... ... ... ... ... ... a C K r n A n
A′ = ⋅ ⋅
−
Assuming first order deactivation, gives;
) 8 ..( ... ... ... ... ... ... ... ... ... ... a K dt da d ⋅ = − ) 9 .( ... ... ... ... ... ... ... ... ... ... dt K a da d ⋅ = − ) 10 ...( ... ... ... ... ... ... ... ... ... ... t Kd e a= − ⋅
(
)
(
)
(
1(
0.667)
)
...(11)1 667 . 0 1 1 T T X X T R Y P T T X X C C A A g A t A A A A ο ο ο ο
ο − − ⋅ = ⋅ ⋅ − − ⋅
=
Assume first order reaction (n=1.0), [ Rethwisch and Wessel 1996 , Bablin et.al. 2002]
(
)
(
1 0.667)
...(12)1 1 t K A A A A
A e d
X X T T C K wt X
F ⋅ − ⋅
− − ⋅ = ⋅ ο ο ο
(
)
(
1 0.667)
...(13)1 1 A A A o t K X X X T T wt K e d − − ⋅ ⋅ ⋅ ⋅ = ⋅ + ο υ
(
)
(
1 0.667)
ln ...(14)1 ln 1 t K T wt K T X X X d A A
A + ⋅
⋅ ⋅ ⋅ = − − ο ο υ
intercept slop
t (sec.)
T = 200oC T = 250oC T = 300oC XA (( ) )
A A A X . X X 667 0 1 1 ln − −
XA (( ) )
A A A X . X X 667 0 1 1 ln − −
XA (( ) )
A A A X . X X 667 0 1 1 ln − −
1200 0.03 3.4963 0.129 1.9998 0.148 1.854
2400 0.047 3.0413 0.157 1.7913 0.17 1.705
3600 0.06 2.7923 0.149 1.8471 0.15 1.840
4800 0.053 2.9189 0.143 1.8908 0.13 1.991 6000 0.045 3.0855 0.137 1.9362 0.11 2.166
7200 0.018 4.01129 0.128 2.008 0.088 2.398
Table (3): Conversion of EtCl at different temperature (Experimental).
Set Eq.(16 ) as a linear equation as below
[image:11.612.106.505.106.246.2] [image:11.612.141.465.390.460.2]) 15 ..( ... ... ... ... ... ... ... ... ... ... 1 2 a b V
V = + ⋅
Where V2 = f(XA) , V1 = t , and a , b are constant.
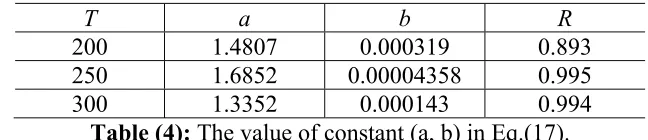
The constants of Eq.(17) are predicted by statistical program as shown in Table (4).
T a b R
200 1.4807 0.000319 0.893
250 1.6852 0.00004358 0.995
300 1.3352 0.000143 0.994
Table (4): The value of constant (a, b) in Eq.(17).
Input variables: s cm U A gm
wt=150 , = ⋅ =27.685 3/
ο υ s cm / 786 . 47 273 30 273 250 685 . 27 3
250 + =
+ ⋅ = ο υ ) 16 ...( ... ... ... ... ... ... ... ... ... ln 1 ο ο υ T w K T a ⋅ ⋅ ⋅ =
) 17 ...( ... ... ... ... ... ... 10 541 . 8 4
1 e a Te a
T w
T
K ⋅ − = × − −
⋅ ⋅ = ο ο υ
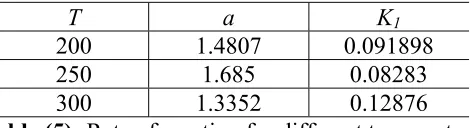
Substituting the values of (a) in Eq.(19) we can have the rate of reaction at different temperature as shown in Table (5).
T a K1
200 1.4807 0.091898
250 1.685 0.08283
300 1.3352 0.12876
Table (5): Rate of reaction for different temperature.
Using the data for (K1) in Table (5), to predict the constant in Arrhenius equation.
) 18 ...( ... ... ... ... ... ... ... ... ... / 1 T R E g e A
K = ⋅ − ⋅
) 19 ...( ... ... ... ... 9998 . 0 95977 . 13 57 . 220314
1= =
⋅ −
R e
K RgT
Eq.(21) represent the rate constant
We predict the deactivation rate constant from the slop of Eq.(17) as shown in Table (6)
T b = Kd
200 0.000319 250 0.000044 300 0.000143
Table (6): Deactivation rate versus temperature.
Assuming polynomial equation to fit the data in Table (6).
) 20 ...( ... ... ... ... ... ... ... ... 2 T c T b a
Kd = + ⋅ + ⋅
) 21 ...( ... 00 . 1 10 48 . 7 10 916 . 3 10 159 .
5 × 3− × 5⋅ + × 8⋅ 2 =
= − − T − T R
Kd
) 22 ..( ... ... ... ... ... ... ... ... ... 1 t K A
A K C e d
r′ = ⋅ ⋅ − −
Back to CSTR design equation;
(
)
(
1 0.667)
...(23)1 95977 . 13 . 57 . 220314 t K A A g A t T R A
Ao g e d
X X T R Y P e wt X
F ⋅ −
− ⋅ − − ⋅ ⋅ ⋅ ⋅ = ⋅ ο
The conversion of EtCl then is:
(
)
(
1 0.667)
...(24)1 . 57 . 220314 exp 957 .
13 K .t
A A g A t g A
A e d
X X T R Y P T R F wt
X ⋅ −
− − ⋅ ⋅ ⎥ ⎥ ⎦ ⎤ ⎢ ⎢ ⎣ ⎡ ⋅ − ⋅ ⋅ ⎟⎟ ⎠ ⎞ ⎜⎜ ⎝ ⎛ = ο ο
Where Kdis represent by Eq.(23), XA is the amount of ethylchloride converted to
product which represent the percent of ethylchloride enter to the reactor (100%) minus percent recorded at the outlet.
Eq.(26) was used in a computer program to predict theoretical result for conversion of EtCl, the equation go through a trial and error method.
Fluidized Bed Model (2) Orcut Model
Assuming no particles in the bubble phase, the change in molar flux of species A at any height in the bubble phase must be accounted for by interphase transfer [Eurgen, 1999]
(
)
...............................(25)1 1 1 1 K e e K X x x
A − + ′
− ′
= − −
β β
Eq.(27) was used in a computer program to predict theoretical result for conversion of EtCl.
Where:
(
)
) 26 ..( ... ... ... ... ... ... ... ... 1 1 1 U H e KK′= −Kd⋅t mf −∈mf
) 27 ...( ... ... ... ... ... ... ... ... ... U H a K
x q b b
β ∈ = ) 28 ..( ... ... ... ... ... ... ... ... ... ... U U
U − mf
=
Results and Discussions
The experiments included the study of the catalytic reaction for different variables: Velocity of reacted gas, particle diameter, and weight of the contact mass. Conversion of EtCl and percent of Et2SiCl2 measured with time were
experimental results which were compared with the models.
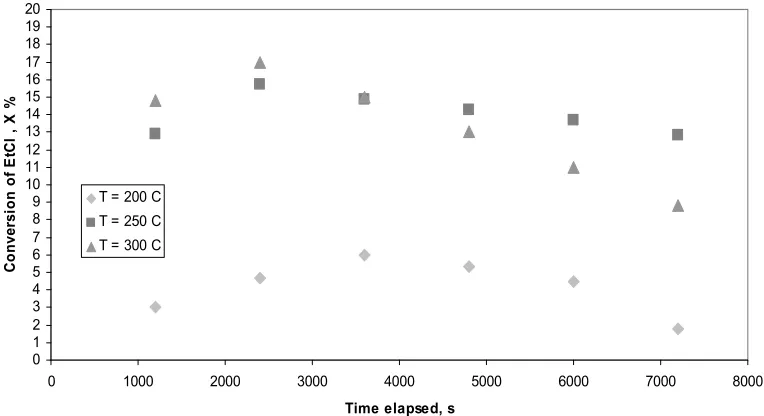
Conversion of reacted gas EtCl with time at different temperatures is shown in Figure (2). The conversion of EtCl for each temperature increases in the first half hour then start to decline. The increase in conversion of EtCl may be due to increase in formation the (η- phase; Cu3Si) with time which is reported by
[Weber et.al., 1989; Ward et.al., 2000; Lewis and Ward, 2002; Weber et. al., 1989; Ward et. al., 2000]. These references are concerned with eta phase in production of methylchlorosilanes. Eta phase is not measured for the work reported in this paper but assumed to follow the analogous methylchlorosilane chemistry. This is could be subject for further work as the eta phase has been reported as key factor in the production. The decline is decay in the catalyst which may due to the formation of coke which is responsible for the decrease in conversion as reported by [Wessel and Rethwisch, 1996]. Cracking products have not been considered in this paper and only assumed theoretically that coke formation is the only parameter that results in decline in the conversion of EtCl.
Also Fig.(2) shows the increase in conversion of EtCl as the temperature of the reaction increases from 200C to 300 C. The average optimum conversion of EtCl is at 250 C, also this temperature has been reported as the best and stable temperature for the reaction [Lewin, 2001, Aramata et. al., 2002].
0 1 2 3 4 5 6 7 8 9 10 11 12 13 14 15 16 17 18 19 20
0 1000 2000 3000 4000 5000 6000 7000 8000
Time elapsed, s
Co
n
ver
si
o
n
o
f E
tCl
,
X
%
T = 200 C T = 250 C T = 300 C
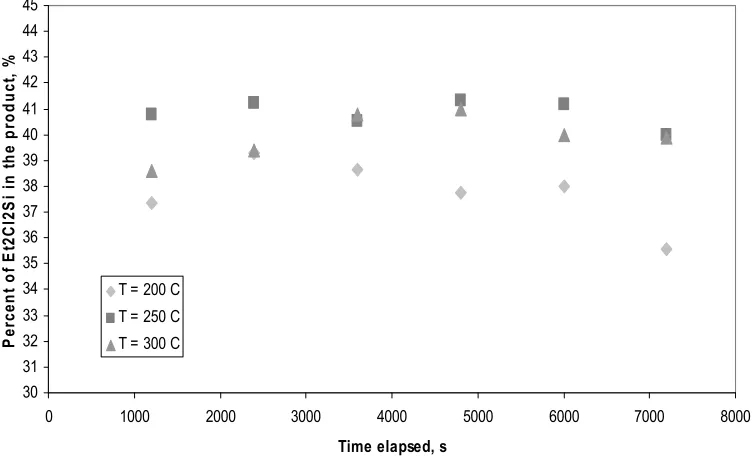
[image:14.612.116.498.450.658.2]Figure (3) shows the percent of Et2SiCl2 in the product at different reaction
temperature. The individual component conversion represents the percent of individual components in the product excluding the unreacted ethylchloride. It is clear from the figure that 250 C is preferable for optimization of Et2SiCl2 production compared to 200 C and 300 C. This lead to select the temperature of 250 C for the reminder of the experiments as it shows the optimum percentage of conversion and desired product yield.
30 31 32 33 34 35 36 37 38 39 40 41 42 43 44 45
0 1000 2000 3000 4000 5000 6000 7000 8000
Time elapsed, s
Pe
rc
en
t o
f Et
2C
l2
Si
i
n
t
h
e p
ro
d
u
ct
,
%
T = 200 C T = 250 C T = 300 C
Figure (3); Percent of diethyldichlorosilane in the product at different temperature
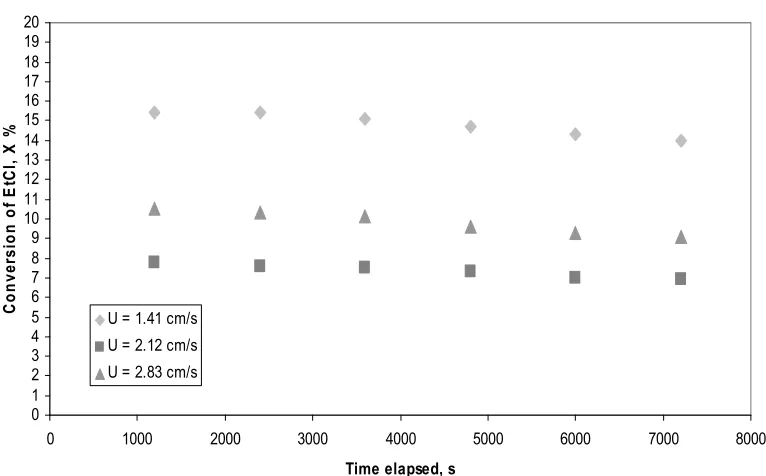
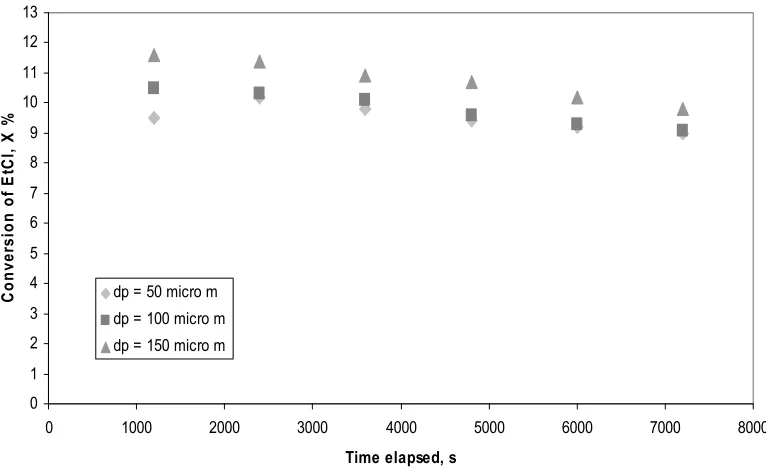
Three figures (4), (5), and (6) have been plotted to show the effect of the reacted gas velocity, weight of the contact mass and the silicon particle diameter. As expected the decrease in the reacted gas velocity resulted in higher conversion of EtCl as shown in Figure (4). Lower velocity of the inlet gas results higher the residence time of the reacted gas. Double the weight of the contact mass (silicon and catalyst) led to 100 % increase in the conversion of the EtCl, which is due to increase in the contact time between the reacted solid and the gas, figure (5).
[image:15.612.118.494.232.460.2]0 1 2 3 4 5 6 7 8 9 10 11 12 13 14 15 16 17 18 19 20
0 1000 2000 3000 4000 5000 6000 7000 8000
Time elapsed, s
C
o
nv
er
si
on
of
E
tC
l,
X
%
U = 1.41 cm/s U = 2.12 cm/s U = 2.83 cm/s
Figure (4); Conversion of ethyl chloride at different reactant gas inlet velocity
0 1 2 3 4 5 6 7 8 9 10 11 12 13 14 15 16 17 18 19 20
0 1000 2000 3000 4000 5000 6000 7000 8000
Time elapsed, s
C
o
nv
er
si
o
n
of
E
tC
l,
X
%
Wt = 100 gm Wt = 150 gm Wt = 200 gm
[image:16.612.115.498.113.351.2] [image:16.612.118.497.416.646.2]0 1 2 3 4 5 6 7 8 9 10 11 12 13
0 1000 2000 3000 4000 5000 6000 7000 8000
Time elapsed, s
C
onv
er
si
on
of
E
tC
l,
X
%
dp = 50 micro m dp = 100 micro m dp = 150 micro m
Figure (6); Conversion of ethyl chloride at different silicon particle diameter
[image:17.612.117.500.118.352.2]0 1 2 3 4 5 6 7 8 9 10 11 12 13
0 1000 2000 3000 4000 5000 6000 7000 8000
Time elapsed, s
C
o
nv
er
si
on
of
E
tC
l,
X
%
Exp. Model-1 Model-2
Figure (7); Comparison of the experimental ethyl chloride conversion with the two models, Wt = 120 gm, U = 1.6 cm/s, dp = 75 micrometer
0 1 2 3 4 5 6 7 8
0 1000 2000 3000 4000 5000 6000 7000 8000
Time elapsed, s
C
o
n
ve
rs
ion
of
E
tC
l,
X
%
Exp. Model-1 Model-2
[image:18.612.119.492.116.337.2] [image:18.612.119.494.404.625.2]0 1 2 3 4 5 6 7 8 9
0 1000 2000 3000 4000 5000 6000 7000 8000
Time elapsed, s
C
onv
er
si
o
n
of
E
tC
l,
X
%
Exp. Model-1 Model-2
Figure (9); Comparison of the experimental ethyl chloride conversion with the two models, Wt = 120 gm, U = 1.6 cm/s, dp = 130 micrometer
0 1 2 3 4 5 6 7 8 9 10 11 12
0 1000 2000 3000 4000 5000 6000 7000 8000
Time elapsed, s
C
o
nv
er
si
on
of
E
tC
l,
X
%
Exp. Model-1 Model-2
[image:19.612.117.488.115.345.2] [image:19.612.117.486.408.623.2]10 11 12 13 14 15 16 17
0 1000 2000 3000 4000 5000 6000 7000 8000
Time elapsed, s
C
onv
er
si
o
n
of
E
tC
l,
X
%
Exp. Model-1 Model-2
Figure (11); Comparison of the experimental ethyl chloride conversion with the two models, Wt = 150 gm, U = 1.4 cm/s, dp = 100 micrometer
The percentage of Et2SiCl2 in the product mixture are predicted and
compared with different particle diameters, height of bed, and velocity of the reacted gas, as shown in figures (12), (13), and (14). Figure (12), shows the Et2SiCl2 % in the product mixture for different velocities, weight of the constant
mass and particle diameter, the overall formation of Et2SiCl2 increases with
[image:20.612.120.496.113.343.2]30 32 34 36 38 40 42 44
0 1000 2000 3000 4000 5000 6000 7000 8000
Time elapsed, s
P
er
cen
t o
f E
t2
S
iCl2
in
p
ro
d
u
ct
,
%
U = 1.41 cm/s U = 2.83 cm/s U = 2.12 cm/s
Figure (12); Percent of diethyldichlorosilane in the product at different reactant ethylchloride inlet velocity, Wt = 150 gm, dp = 100 micrometer
30 32 34 36 38 40 42 44
0 1000 2000 3000 4000 5000 6000 7000 8000
Time elapsed, s
P
er
ce
n
t of
E
t2
S
iC
l2
i
n
pr
o
duc
t,
%
Wt = 100 gm Wt = 150 gm Wt = 200 gm
[image:21.612.120.489.118.338.2] [image:21.612.117.496.403.627.2]30 32 34 36 38 40 42 44
0 1000 2000 3000 4000 5000 6000 7000 8000
Time elapsed, s
P
er
ce
n
t of
E
t2
S
iC
l2
i
n
pr
od
uc
t,
%
dp = 50 micro m dp = 100 micro m dp = 150 micro m
Figure (14); Percent of diethyldichlorosilane in the product at different weight of reactant solid, Wt = 150 gm, U = 2.1 cm/s
[image:22.612.117.488.112.348.2]0 1 2 3 4
0 1000 2000 3000 4000 5000 6000 7000 8000
Time elapsed, s
In
d
ivit
u
al co
m
p
o
n
en
t
co
n
ver
si
o
n
, % Et3SiCl Et2SiCl2 EtSiCl3 Et(H)SiCl2
Figure(15); Individual components conversion in the product at 200 C
temperatures
0 1 2 3 4 5 6 7 8
0 1000 2000 3000 4000 5000 6000 7000 8000
Time elapsed, s
In
d
ivit
u
al co
m
p
o
n
en
t
co
n
ver
si
o
n
, % Et3SiCl
Et2SiCl2 EtSiCl3 Et(H)SiCl2
Figure (16); Individual components conversion in the product at 250 C
[image:23.612.115.500.116.350.2] [image:23.612.117.503.412.643.2]0 1 2 3 4 5 6 7 8
0 1000 2000 3000 4000 5000 6000 7000 8000
Time elapsed, s
In
d
ivi
tu
al
co
m
p
o
n
en
t c
o
n
ver
sio
n
,
%
Et3SiCl Et2SiCl2 EtSiCl3 Et(H)SiCl2
Figure (17); Individual components conversion in the product at 300 C
temperatures
Conclusions
The best temperature for reaction of EtCl with Si-CuCl mixtures was 250 C, the temperature reported in literature is between 250-280oC. The highest formation of Et2SiCl2 (16%) has been predicted in this experimental work as 250 C. The
conversion of EtCl and percentage of Et2SiCl2 increased with decreasing the
velocity of reacted gas and increasing the weight of the contact mass. Increase in silicon particle diameter shows a low increase in the conversion of EtCl . These results are for the experimental variable ranges used in the experiments; because high decreasing gas velocity may lead to pyrolysis of the product, increasing the weight of the contact mass may leads to slugging which decreases the conversion and finally increasing the particle diameter need higher velocity to fluidize which decreases the conversion. The data predicted from the selected Kinetic and Fluidized bed models show good agreement with the experimental results. The maximum error between experimental results and model prediction was below 9%. The percent of Et2SiCl2 in product mixture spread between (36-46%) slightly
[image:24.612.119.495.116.349.2]Nomenclature
Symbol Definition Units
a Deactivation rate (kgmol/kg.s)
ab Interfacial area of bubble based on unit volume (m2/ m3)
CA Reactant concentration (kgmol/m3)
CAo Reactant concentration at the inlet to the reactor (kgmol/m3)
dp Particle diameter (m)
FAo Molar flow rate (kgmol/s)
Hmf Bed high at minimum fluidization velocity (m)
Kd Deactivation rate constant (1/s)
M, Wt Weight of bed (kg)
Mwt Molecular weight (kg/kgmol)
Pt Total pressure (mbar)
Q Volumetric flow rate (m3/s)
R, Rg Universal gas constant (m3.atm/kgmol.k)
rA Reaction rate (kgmol/kg.s)
T Bed temperature (oC)
To Initial bed temperature (oC)
Umf Minimum fluidization velocity (m/s)
Uo , U Superficial gas velocity (m/s)
Wt , Ms Weight of contact mass (---)
X , XA Fluid (gas) conversion (---)
∈ Voidage of the bed (---)
b
∈ Fraction of bed occupied by bubble (---)
mf
∈ Porosity at minimum fluidization (---)
β Ratio of gas flow via bubble phase to total gas flow (---)
ρB , ρb Bed density (kg/m3)
ρg , ρf Gas density (kg/m3)
ρp Particle density (kg/m3)
DMDCS, Di Dimethyldichlorosilane
Eqs. Equations EtCl Ethyl Chloride Exp. Experimental FBR Fluidized bed reactor Figs. Figures
MeCl Methyl chloride Temp. Temperature Theo. Theoretical
References
Bablin John M., Lewis Larry N., Bui Pierre, and Gardner Martha, Silicon for the chemical industry VI, “The Mechanism of the Methylchlorosilane Reaction: Improved Lab Reactor Design and Kinetic Data”, loen, Norway, 2002.
De Cooker M.G.R.T, De Bruyn J.H.N. and Van Den Berg P.J., “The Direct Synthesis of Methyldichlorosilane and Dimethylchlorosilane”, J. of Organaometallic Chem., 1975, 99, pp.371-377.
Endovin Yurri P., Russia, Internet, 1997.
Ergun 6.0, software program manual, 1999.
Feki M. et. Al., The Canadian Jornal of Chem. Eng., 1987, vol. 65.
Floquet N., Yilmaz S., and Falconer J. L., “Interaction of Copper Catalyst and Si(100) for the Direct Synthesis of Methylchlorosilane”, Journal of catalysis, 1994, vol. 148, No. 1.
Fogler H. Scott., “Elements of Chemical Reaction Engineering”, second edition, prentice-Hall of India, 1997.
Gasper–Galvin L. D., Sevenich D. M., Friedrich H. B. and Rethwisch D. G., “Role of Metallic Promoters in the Direct Synthesis of Methylchlorosilanes”, Journal of catalysis, 1991, 128, pp.468-478.
Geldart D., “Gas Fluidization Technology”, Wiley John and Sons, 1986.
General Electric Company, London patent office, 947841, 1964.
Jung Il Nam, Organosilicon Chemistry Lab., “New Starting Materials For Silicones by Modified Direct Synthesis and Alkylations”, 1996.
Kim Jong Pal and Rethwisch David G., “Direct Synthesis of Methylchlorosilanes”, Journal of catalysis, 1992, 134, pp.168-178.
Kunii Daizo and Levenspiel octave, “Fluidization Engineering” Wiley John and sons, 1969.
Levenspiel Octave, “Chemical Reaction Engineering”, third edition, Wiley John and Sons, 1999.
Lewin John H., European patent office. T1142/97, 2001.
Lewis K.M. and Rethwish D.G, “Catalyzed Direct Reactions of Silicon”, Elsevier science publishers, 1993.
Lewis Larry N., and Ward William J., “The Use of Fixed Bed Reactor to Elevate the Interactions of Catalysts and Promoters”, Ind. Eng. Chem. Res., 2002, vol. 41, pp.397-402.
Lewis Larry N., Ligon Woodfin V., and Carnahan James C., “A Study of Copper Oxide Catalysts Used in the Methylchlorosilane Reaction and Determination of the Fate of Oxygen”, silicon chemistry, 2002, vol. 1, pp.23-33.
Olakangil J. F. and Rehwish D. G., silicon for the chemical industry V, “Effect of Promoters On the Reaction Kinetics of the Direct Process”, Troms, Norway, 2000, pp.325-330.
Patnode Winton I. and Schiessler Robert W., U.S. patent office, 2381000, 1945.
Rethwisch D. G., and Wessel T. J., Silicon for the chemical industry III, “Kinetics of the Direct Reaction: Mechanistic Implications”, sandefjord, Norway, 1996.
Rochow Eugene G. and Patnode Winton I., U.S patent office, 2380996, 1945.
Rochow Eugene G., U.S. patent office, 2380995, 1945.
Voorhoeve R.J.H., “Organohalosilanes”, Elsevier publishing company, 1967.
Ward W. J., Ritzer A., Carroll K.M., and Flock J.W., “Catalysis of the Rochow Direct Process”, Journal of catalysis, 1986, 100, pp.240-249.
Ward William J., Lewis Larry N., Bablin Mathew, and Demoulpied Cheney, U.S. patent office, 6258970 B1, 2001.
Weber G., Viale D., Souha H., Gillot B. and Barret P., “Kinetic Data and Mechanistic Model For the Reaction Between Si And CuCl”, solid state ionics 32/33, 1989, pp.250-257.