Students’ perceptions of primary teachers’ interpersonal behavior and of cultural
dimensions in the classroom environment.
Darrell Fisher, Curtin University of Technology, Australia
Bruce Waldrip, University of Southern Queensland, Australia
Perry den Brok, Utrecht University, The Netherlands
Presented at the annual meeting of the American Educational Research Association, San Francisco, 7-11 April 2006.
Accepted for publication in: International Journal of Educational Research
Corresponding Author
Perry den Brok
IVLOS Institute of Education Utrecht University
P. O. Box 80127 3508 TC Utrecht The Netherlands Tel. +.31.30.2532231 Fax. +.31.30.2532741
Abstract
Within the domain of learning environments research many studies have investigated students’ perceptions of their teachers’ interpersonal behavior. The present study adds to this line of research by (a) focusing on primary education, rather than secondary education, (b) establishing associations between perceptions of teacher interpersonal behavior and perceptions of cultural elements of the learning environment rather than uniquely focusing on interpersonal behavior, (c) linking perceptions of teacher interpersonal behavior to affective student outcomes taking into account perceptions of cultural elements of the learning environment.
Results of correlation analyses and multilevel analyses of variance, conducted on perception and outcome data of a sample of 2,178 Australian years 5, 6 and 7 students in 103 primary classrooms are presented. Students’ perceptions of their learning environment were mapped with the Questionnaire on Teacher Interaction (QTI) and a primary version of the Cultural Learning Environment Questionnaire (CLEQ).
Results indicate that, after correction for covariates, teacher proximity (QTI) and congruence (CLEQ) are significantly associated with students’ enjoyment in science. Also, strong associations were found between teacher proximity and all of the CLEQ scales.
1. Rationale
Recent reviews (e.g. Fraser, 1994, 1998) have demonstrated the importance of the field of classroom environment research, particularly the use of student perceptions, over the last three decades, and how this field has contributed much to understanding and improving student achievement, particularly in science. For example, classroom environment assessments provide a means of monitoring, evaluating and improving science teaching and curriculum. A key to improving student achievement and attitudes is to create learning environments that emphasize those characteristics that have been found to be linked empirically with student outcomes. However, classroom environment research has been somewhat limited in primary schooling compared with secondary schooling. Thus, the present study aims to contribute by focusing on primary education students’ perceptions and attitudes.
Increasingly, cultural issues are being addressed within (science) education. The classroom teaching and learning is influenced by the cultural world views of the student (Fisher & Waldrip, 1999; Gay, 2002; Jacobs, 2003; Jegede & Okebukola, 1991; Squire, MaKinster, Barnett, Luehmann & Barab, 2003). Hofstede (1986), and Banks & Banks (1993) argued that teachers from different cultural backgrounds from their students must be made aware of possible conflicts that might arise from their expectations of students. To survive the school process, some of these students, besides resisting assimilation (Driver, 1989), tend to compartmentalize their learning (Waldrip & Taylor, 1999) into what is relevant to passing school and what is external to success at school. Changing students’ views is not easy, especially when these views continue to be used by their family and peers (Hodson, 1999). The challenge for the teacher is to stimulate learning while not resulting in the student becoming alienated from their society knowledge, beliefs and values.
environment - in Australia and Asia (e.g. Fisher & Waldrip, 1999; Fraser, 2002), the United States (e.g. Levy, den Brok, Wubbels & Brekelmans, 2003) and the Netherlands (Wubbels, den Brok, Veldman & van Tartwijk, in press; see for an overview den Brok and Levy, in this issue). An important issue, however, is how to conceive the role of culture in the classroom. In this contribution, the term culture refers to the perspectives (values, worldviews, etc.), practices and products of a social group, that define how this group interprets and interacts with others (e.g. Eriksen, 2002).
Learning environments researchers and researchers interested in teacher interpersonal behavior have studied and addressed cultural issues by means of including these issues in their design and analyses (see den Brok & Levy, this issue). In most of these cases ethnicity rather than culture was studied, since differences between groups were conceived of in terms of a set of (rather crude and unchangeable) indicators that can be collected from respondents and that mainly focus on such indicators as student or teacher country of birth, self-defined ethnic membership, language spoken at home or number of years of residence in the country of interest.
orientation, performance orientation and humane orientation (e.g. House, et al., 2002)1. Although some authors (e.g. Hofstede, 1991) have described how these cultural dimensions may be observed in the classroom or how they may have influenced respondents’ perceptions within the learning environment (e.g. Levy, et al., 2003), they have not attempted to directly map them with individual students (or teachers) and connect such information to perception data in order to understand the processes at work.
Research on student perceptions of teacher interpersonal behavior has investigated how perceptions of teacher interpersonal behavior are linked to (perceptions of) other elements of the learning environment. These studies investigated and found strong associations between interpersonal behavior and elements such as teacher clarity (den Brok, 2001), activating instruction (Brekelmans, Sleegers & Fraser, 2000), monitoring, emphasis on student learning and student centeredness (Levy, Rodriguez & Wubbels, 1992), involvement, negotiation, task orientation and emphasis on understanding (Rawnsley, 1997). None of these studies focused at cultural sensitive elements of the learning environment, nor were cultural sensitive elements of the learning environment taken along when determining the effect of teacher interpersonal behavior on students’ subject related attitudes and achievement. The present study aims to measure some of these cultural aspects directly with individual primary education students, thereby adding specifically to the before mentioned line of research. Throughout this manuscript we use the term ‘cultural aspects’ to refer to ‘culturally sensitive elements of the learning environment’.
1 Uncertainty avoidance can be described as the degree to which individuals strive to avoid uncertainty in their environment.
2. Cultural Factors of the Learning Environment
With the cultural issues (see Rationale section) in mind, Fisher and Waldrip (1999; 2002) developed an instrument named the Cultural Learning Environment Questionnaire
(CLEQ), to specifically assess cultural factors of the learning environment. The instrument utilized in their study was based on previously developed learning environment scales that (a) showed conceptual overlap with the cultural dimensions such as those described by Hofstede (1991) and House et al (2002), and (b) had shown strong associations with student outcomes (achievement and attitudes) in previous learning environments research (e.g. Fisher & Waldrip, 1999; 2002).
literature on multicultural education (e.g. Banks & Banks, 1993) indicated this method as particularly powerful in the multicultural classroom, and therefore seemed relevant as a cultural factor. Congruence refers to the degree to which the learning environment at home is connected to (and similar compared to) the learning environment at school. It was included because research has shown that (large) differences between home and school environment may have a negative effect on students’ outcomes and behavior at school (e.g. Creemers, 1994; Majoribanks, 1994) and that connections between the home and school environment may vary across cultures (e.g. Hofstede, 1991; Steinberg, Dornbusch & Brown, 1992; Spera, 2005).
- insert Table 1 about here –
It was decided to modify the CLEQ for use in primary schools in this study. Part of this modification involved a reduction in the number of scales to three to alleviate workload for the students, namely, Equity, Collaboration and Congruence. These scales were selected because they were consistent predictors of students’ attitudes and achievement in previous research using the questionnaire (Fisher & Waldrip, 2002). Therefore, the CLEQ (primary) contained 15 items which had been construct and content validated by teachers, students and fellow researchers. Appendix A lists all items of each of the three scales.
Rawnsley (1997) discovered that positive classroom environments with higher levels of students’ perceptions of equity were associated with higher levels of leadership, helpful friendly and understanding interpersonal behavior and also behavior which give students some responsibility and freedom. Positive learning environments (e.g. high amounts of equity) were negatively associated with uncertain, dissatisfied, admonishing and strict behavior.
work in groups, challenge the teacher, be competitive and model learning. Students saw little congruence between school and home learning with these teachers.
3. Research aims
The overall aim of this paper was to investigate relationships amongstudents’ perceptions of cultural aspects that affect their primary classroom learning environment, teacher interpersonal behavior, and attitude towards science in upper primary school science classes. The first large-scale adaptation of the CLEQ to the primary level was an important component of this study and the study adds to our understanding of primary school classroom learning environments. This contribution, while clearly related to the previously discussed ones, is distinct in that it incorporates classroom environment theory and research to examine the contribution that primary students’ perceptions of cultural aspects related to their learning environment have on their attitudes and understanding of science concepts. The objectives were:
• to develop and validate an instrument to assess students’ perceptions of cultural aspects
that affect their classroom learning environment for use with primary school students;
• to investigate the quality of the QTI with the primary school sample; and
• to investigate associations between students’ perceptions of cultural aspects that affect
their classroom learning environment, teacher interpersonal behavior, and their attitudes toward science.
4. Method
4.1 Sample
perceived cultural aspects of the learning environment (CLEQ Primary); students’ perceptions of their teachers’ interpersonal behavior (QTI Primary); and students’ attitudes. Of the students, 1,114 (51.4 percent) was female. Also, 710 students (32.7 percent) were grade 5 students, 697 students were located in grade 6 (32.1 percent), and the remainder of the students (35.3 per cent) in grade 7.
4.2 Instrumentation
4.2.1 Student attitudes: enjoyment
Klopfer (1976) conceptualized the term ‘attitude toward science’ by developing six categories of conceptually different attitudinal aims. These categories were: manifestation of favourable attitudes to science and scientists; acceptance of scientific enquiry as a way of thought; adoption of scientific attitudes; enjoyment of science learning experiences; development of interest in science and science-related activities; and development of interest in pursuing a career in science (Shulman & Tamir, 1972). The Test of Science Related Attitudes (TOSRA), designed to measure these scales separately, was written for use with secondary school students (Fraser, 1981). One of the TOSRA scales, from which the 7-item
For the Enjoyment (ENJ) scale, a Cronbach alpha of 0.88 was found at the student level and of 0.95 at the class level. On a scale of 0 to 1, the average score was .68 and the standard deviation was .20. Eta-squared was .20, indicating that about 20 percent of the variance was on the class and school levels.
4.2.2 Cultural Learning Environment Questionnaire (CLEQ)
Given the fact that the CLEQ was originally devised for secondary education students, it was decided to elaborately establish validity and reliability for the present study conducted in primary education. First, a factor analysis was conducted on the 15 CLEQ items at the class level. This analysis indicated that three factors with an eigenvalue larger than one could be extracted, explaining 68.0 percent of the variance. A varimax rotation of the factor loadings indicated that most of the items conformed to their a-priori scales (see Appendix A). From Appendix A it appears that the item ‘I like it when my work receives as much praise as other students’ work’ (eq1) loads best on the equity scale, but also has some affiliation with the congruence scale. Similarly, the item ‘I feel that it is important for the class to work together as a team’ (col2) loads on all three scales, and highest on the congruence scale, rather than the collaboration scale. Also, the item ‘ It is important for me to be involved in class discussions’ (col4) is interpreted by students more in terms of equity (or congruence) than in terms of collaboration.
strong, however, sufficiently low to warrant the fact that the three elements are distinctive from each other.
- Insert Table 2 about here –
With MLN for Windows we determined the percentage of variance of each CLEQ scale at the student, class and school level. As can be seen in Table 3, roughly 90 percent of the variance in each CLEQ scale is located at the student level, with small percentages left at the class and school levels. Surprisingly, all scales have variance at the school level, suggesting that schools can vary across classes with respect to the amount of equity, collaboration and congruence perceived. This is particularly true for the congruence scale.
- Insert Table 3 about here –
4.2.3 Questionnaire on Teacher Interaction (QTI)
influence and proximity and to the interpersonal profiles (see Wubbels & Brekelmans in this issue).
5. Results
5.1 Associations between CLEQ and QTI perceptions
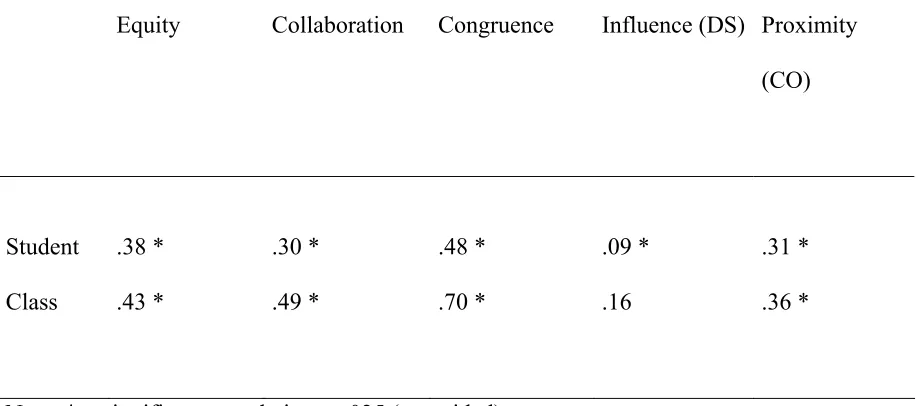
First, it was determined to what degree students’ perceptions of their teachers’ interpersonal behavior and perceptions of the cultural aspect of the classroom environment were associated. Correlations between the dimension scores and the CLEQ scales (see Table 4) indicated that perceptions of teacher Influence were weakly positively associated with Equity, Collaboration and Congruence. However, perceptions of teacher Proximity were statistically significantly associated with Equity, Collaboration and Congruence. Thus, a teacher perceived as more cooperative (e.g. helpful/friendly and understanding and less dissatisfied and admonishing) will also be perceived as having a class with more equity between students, more cooperation and collaboration between students and more connection between the class and home environment.
- Insert Table 4 about here –
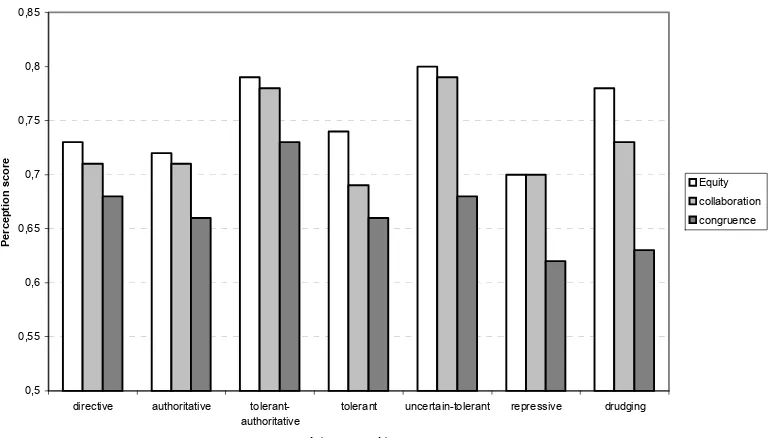
In terms of teacher interpersonal profiles (see Wubbels & Brekelmans in this issue), it seemed that Tolerant-Authoritative and Uncertain-Tolerant teachers are perceived as establishing most equity, collaboration and congruence, whereas Repressive teachers are perceived as establishing least of these elements (see Figure 1).
Percentages of variance explained in CLEQ scales by interpersonal types are 20 (equity), 26 (collaboration) and 22 (congruence). This means that some (interpersonal) types of teachers are much better able to realize equity, congruence and collaboration in their classroom than do other types of teachers. In fact, teachers’ interpersonal style can predict up to one fifth of the variation in equity, collaboration and congruence between teachers. This provides, similar to the previous analysis, evidence for the fact that perceptions of cultural aspects of the learning environment and teachers’ interpersonal behavior are strongly connected and influence each other.
5.2 Associations between enjoyment and student perceptions of their learning environment
Results of correlational and multilevel analyses display a distinctive pattern (Table 5 and 6). First of all, student gender displays no (statistically significant) association with enjoyment. Both grade level and class size are negatively related to enjoyment, meaning that the larger the class and the higher the grade level, the less enjoyment students experience in class.
Interestingly, teacher Proximity and Influence are both positively associated with student enjoyment, taking into account grade level, student gender and class size. Although the raw coefficient of teacher Influence is higher than the coefficient of teacher Proximity, this trend is opposite in terms of the – more relevant – effect size (see Table 7). In terms of effect sizes, teacher Proximity has twice the effect that teacher Influence has on enjoyment.
when considered uniquely, Congruence explains twice the amount of variance that teacher Influence and Proximity explain.
When QTI and CLEQ variables are entered simultaneously, the effect of teacher Influence reduces and becomes non-significant. In a similar vein, the effects of Equity and Collaboration shrink. Teacher Proximity and Congruence remain significantly associated, with the effect of Proximity shrinking by half in terms of effect size and the effect of Congruence remaining similar. In terms of the amount of variance explained, it seems that the interpersonal variables hardly have an additive effect to the effect of Congruence. This picture remains unchanged when all non-significant variables (e.g. Influence, Collaboration, Equity) are removed from the model.
- Insert Table 5, 6 and 7 about here –
Looking at the percentages of variance (Table 6), it seems that most of the variance is located at the student level (85 percent), the remainder at the class and school level. Interestingly enough, the percentage of variance at the school level is equally high as the percentage of variance at the class level. This means that some schools are able to attract more motivated students and/or to keep their students more motivated. Usually, percentages of variance in affective student outcomes hardly differ between schools (e.g. den Brok, et al., 2004).
6. Discussion
classrooms in Australia. The reliability for each scale for the modified CLEQ was obtained and ranged between the acceptable values of 0.72 and 0.80. The mean correlation of each of the scales with the other two scales indicated that the scales measure different but somewhat overlapping aspects of the learning environment. A multilevel analysis of variance demonstrated that the modified questionnaire is able to distinguish between classrooms, and even schools. This modified CLEQ is a useful addition to the range of primary education learning environment instruments as it assesses important cultural aspects of the environment, namely, equity, collaboration and congruence between school and home. It is also valuable because it takes little time to use, which is particularly important for primary-level students.
All of the CLEQ scales as well as teacher Proximity (QTI) were positively associated with students’ enjoyment. Congruence between home and a school was of particular importance.
This study is significant as it was the first study in Australia to investigate primary student perceptions of cultural aspects that affect their classroom learning environment. In doing so, it is acknowledged that students are active participants rather than passive recipients in the learning processes. Secondly, it is one of the first studies aimed at investigating links between primary students’ perceptions of cultural aspects that affect their classroom learning environment, students’ interactions with their teachers, and their attitude towards science. The underlying premise of this research is that if the nature of cultural aspects of the learning environment and student-teacher interactions, and their associations with student attitudes are understood and widely made known, teachers and teacher educators may be able to implement developments in primary science more effectively.
The results of this study suggest that teachers and schools should attempt to create a strong congruence between the home and school environment. This finding is in line with other research, showing that cognitive and attitudinal outcomes of students are higher if parental and school environment are supportive and in alignment (e.g. Marjoribanks, 1994; Paulson, 1994). For (primary) teachers, it is important to obtain knowledge of the home situation of students. In a similar vein, it might be worth while for learning environments researchers to pay closer attention to the role of parents, and compare perceptions of students with respect to learning environments. Such research could focus on parental interpersonal style as well. The study also suggests that teachers should stimulate cooperation, both between students (collaboration) as well as between teachers and students (proximity). To this end, they could employ such behavioral strategies as smiling, keeping eye-contact, providing humor in the classroom and interacting with students before, during and after lessons, to name but a few.
Acknowledgement
The Netherlands Organisation for Scientific Research (NWO) provided funding for the third author of this study with a grant of the Foundation for Behavioural and Educational Sciences (411-21-206).
References
Banks, J. A., & Banks, C. A. M. (1993). Multicultural education: Issues and perspectives (second edition). Boston: Allyn and Bacon.
Brekelmans, M., Sleegers, P., & Fraser, B. J. (2000). Teaching for active learning. In P. R. J. Simons, J. L. van der Linden, & T. Duffy (eds.), New learning (pp. 227-242). Dordrecht: Kluwer Academic Publishers.
Brok, P. den (2001). Teaching and student outcomes. Utrecht: W. C. C.
Brok, P. den, Brekelmans, M., & Wubbels, T. (2004). Interpersonal teacher behavior and student outcomes. School Effectiveness and School Improvement, 15 (3/4), 407-442. Brok, P. den, Fisher, D. L., & Scott, R. (2005). The importance of teacher interpersonal
behavior for student attitudes in Brunei primary science classes. International Journal of Science Education, 7 (3), 765-779.
Creemers, B. P. M. (1994). The effective classroom. London: Cassell.
Dhindsa, H.S. (2005). Cultural learning environment of upper secondary students.
International Journal of Science Education, 27 (5), 575-592.
Driver, R. (1989). Students’ conceptions and the learning of science. International Journal of Science Education, 11, 481-490.
Fisher, D., Rickards, T., Goh, S., & Wong, A., (1997). Perceptions of interpersonal teacher behavior in secondary science classrooms in Singapore and Australia. Journal of Applied Research in Education, 1 (2), 2-11.
Fisher, D. L., & Waldrip, B. G. (1999). Cultural factors of science classroom learning environments, teacher-student interactions and student outcomes. Journal of Science Education and Technology, 17 (1), 83-96.
Fisher, D. L., & Waldrip, B. G. (2002). Measuring culturally sensitive factors of classroom learning environments with the CLEQ. In S. C. Goh & M. S. Khine (Eds.), Studies in educational learning environments: An international perspective (pp 27-48). Singapore: World Scientific.
Fraser, B. J. (1981). Test of science-related attitudes. Melbourne: ACER.
Fraser, B. J. (1994). Research on classroom and school climate. In D. Gabel (Ed.), Handbook of research on science teaching and learning (pp. 493-541). New York: Macmillan.
Fraser, B. J. (1998). Science learning environments: Assessment, effects and determinants. In B. J. Fraser and K. Tobin (Eds.), International Handbook of Science Education (pp. 527-564). Dordrecht, The Netherlands: Kluwer.
Fraser, B. J. (2002). Learning environments research : yesterday, today and tomorrow. In S. C. Goh, & M. S. Khine (Eds.), Studies in educational learning environments: an international perspective (pp. 1-27). Singapore: World Scientific.
Fraser, B. J., & Fisher, D. L. (1982). Predicting students’ outcomes from their perceptions of classroom psychosocial environment. American Educational Research Journal, 19, 498-518.
Hodson, D. (1999). Going beyond cultural pluralism: Science education for sociopolitical action. Science Education, 83 (6), 775-796.
Hofstede, G. (1991). Cultures and organizations: Software of the mind. London: McGraw-Hill.
Hofstede, G. (1986). Cultural differences in teaching and learning. International Journal of Intercultural Relations, 10, 301-320.
House, R., Javidan, M., Hanges, P., & Dorfman, P. (2002). Understanding cultures and implicit leadership theories across the globe: an introduction to the project GLOBE.
Journal of World Business, 37, 3-10.
Jacobs, D. T. (2003). Shifting Attention from "Discipline Problems" to "Virtue Awareness" in American Indian and Alaska Native Education. ERIC Digest ED480732.
Jegede, O. J., & Okebukola, P. A. (1991). Differences in socio-cultural environment perceptions associated with gender in science classrooms. Journal of Research in Science Teaching, 29, 1-7.
Klopfer, L. E. (1976). A structure for the affective domain in relation to science education.
Science Education, 60, 299-312.
Levy, J., den Brok, P., Wubbels, T., & Brekelmans, M. (2003). Students’ perceptions of interpersonal aspects of the learning environment. Learning Environments Research, 6 (1), 5-37.
Levy, J., Rodriguez, R., & Wubbels, Th. (1992). Teacher communication style and instruction. The Study of Learning Environments, 7, 11-18.
Marjoribanks, K. (1994). Families, schools and children’s learning: a study of children’s learning environments. International Journal of Educational Research, 21, 439-555. Paulson, S. E. (1994). Relations of parenting style and parental involvement with ninth-grade
Rawnsley, D. G. (1997). Associations between classroom learning environments, teacher interpersonal behavior and student outcomes in secondary Mathematics classrooms. Unpublished doctoral dissertation. Perth: Curtin University, Science and Mathematics Education Centre.
She, H., & Fisher, D. (2000). The development of a questionnaire to describe science teacher communication behavior in Taiwan and Australia. Science Education, 84, 706-726. Shulman, L. S., & Tamir, P. (1972). Research on teaching in the natural sciences. In R. M.
W. Travers, (Ed.), Second handbook of research on teaching (pp. 1098-1148). Chicago, IL: Rand McNally.
Spera, C. (2005). A Review of the Relationship Among Parenting Practices, Parenting Styles, and Adolescent School Achievement. Educational Psychology Review, 17 (2), 125-146.
Squire, K. D., MaKinster, J. G., Barnett, M., Luehmann, A. L.,&. Barab, S. L. (2003). Designed curriculum and local culture: Acknowledging the primacy of classroom culture. Science Education, 87, 468-489.
Steinberg, L., Dornbusch, S. M., & Brown, B. B. (1992). Ethnic differences in adolescent achievement: An ecological perspective. American Psychologist, 47(6), 723-729. Triandis, H. C. (1994). Culture and social behavior. New York: McGraw-Hill.
Waldrip, B. G. & Taylor, P. C. S. (1999). Standards for the Cultural Contextualisation of Interpretative Research: A Melanesian Case. International Journal of Science Education, 3, 249-260.
Wubbels, T., & Levy, J. (1993). Do you know what you look like? London: The Falmer Press. Wubbels, T., Brok, P. den, Veldman, I., & Tartwijk, J. van (in press). Teacher interpersonal
competence for Dutch multicultural classes. Manuscript accepted for publication in
Appendix A
Items of the CLEQ used in the present study.
Item Item text F1 F2 F3
Eq1 I like it when my work receives as much praise as other students’ work.
.642 .403
Eq2 I like to get the same amount of help from the teacher as do other students.
.544
Eq3 I like to have the same amount of say in this class as other students.
.851
Eq4 I like to be treated the same as other students in this class.
.822
Eq5 I like it when I get the same chance to answer questions as other students.
.746
Col1 I like working in groups. .860
Col2 I feel that it is important for the class to work together as a team.
.422 .498 .524
Col3 I would rather decide what to do as a group than to make a decision by myself.
.669
Col4 It is important for me to be involved in class discussions.
.591 .440
Con1 What I learn at home helps me to do things at school.
.787
Con2 What I learn in school helps me to do things at home.
.743
Con3 I feel that ideas I learn at school are similar to those I learn at home.
.813
Con4 What I learn in this class agrees with what I learn at home.
.776
Con5 What I learn in this class helps me at home.
.494 .695
Table 1
CLEQ scales and cultural dimensions
CLEQ scale Cultural dimension(s)
Equity Power distance, gender egalitarianism
Collaboration Collectivism
Competition Assertiveness, performance orientation
Teacher authority Power distance
Modelling - Congruence -
Table 2
Cronbach’sAlpha and Average Scale Correlation of CLEQ Scales.
Scale Alpha (student) Alpha (class) Average scale correlation (student/class)
Equity .72 .85 .49 / .63
Congruence .80 .89 .49 / .63
Table 3
Percentagesof Variance in CLEQ Scales at Student, Class and School Level.
Scale Student Class School
Equity 90.0 5.0 5.0
Collaboration 95.2 2.4 2.4
[image:26.595.71.489.254.460.2]Congruence 91.5 2.1 6.4
Table 4
Correlations between CLEQ Scales and QTI Dimensions
Equity Collaboration Congruence
Student level
Influence (DS) .11 * .04 .08 *
Class level
Influence (DS) .09 .05 .14
Proximity (CO) .33* .35 * .36 *
Note: * = significant correlation at .025 (two-sided).
Table 5
Correlations between ENJ (Enjoyment) and CLEQ and QTI at the Student and Class Level.
Equity Collaboration Congruence Influence (DS) Proximity (CO)
Student .38 * .30 * .48 * .09 * .31 *
Class .43 * .49 * .70 * .16 .36 *
[image:27.595.68.527.315.518.2]Note: * = significant correlation at .025 (two-sided).
Table 6
Multilevel Analyses on ENJ (Enjoyment): Estimates (Standard Error)
Empty Covariate QTI CLEQ QTI+CLEQ Final
Constant (ENJ) Student
- Gender - grade
level Class
- classize - DS - CO - Equity - Collab - Congr School
.70 (.01) .86 (.00)
-.002 (.01) -.026 (.01) *
-.005 (.002) *
.75 (.04)
-.002 (.01) -.027 (.01) *
-.005 (.002) *
.12 (.06) * .08 (.02) *
.25 (.09)
-.003 (.009) -.02 (.008) *
-.003 (.001) *
.09 (.13) .10 (.14) .59 (.14) *
.31 (.10)
-.003 (.009) -.02 (.008) *
-.003 (.001) *
.06 (.05) .04 (.02) * .05 (.12) .08 (.14) .50 (.14) *
.36 (.09)
-.004 (.009) -.02 (.008) *
-.003 (.001) *
.04 (.02) *
.60 (.11) * Percentage of variance Explained Student Class School 0 85.0 7.5 7.5 2.5 85.0 7.5 5.0 5.0 85.0 5.0 5.0 10.0 85.0 2.5 2.5 10.0 85.0 2.5 2.5 10.0 85.0 2.5 2.5 -2*loglikelihood
Table 7
Effect Sizes of Variables in Multilevel Models
Covariate QTI CLEQ QTI+CLEQ Final (only sig)
Student
- Gender - grade
level Class
0,5 0,55 0,6 0,65 0,7 0,75 0,8 0,85
directive authoritative tolerant-authoritative
tolerant uncertain-tolerant repressive drudging
Interpersonal type
Percept
ion score
[image:30.595.85.473.109.328.2]Equity collaboration congruence