This is a repository copy of
Testing the adequacy of a single-value Monte Carlo simulation
for space-time interaction of crime
.
White Rose Research Online URL for this paper:
http://eprints.whiterose.ac.uk/124150/
Version: Accepted Version
Proceedings Paper:
Adepeju, M orcid.org/0000-0002-9006-4934 (2017) Testing the adequacy of a single-value
Monte Carlo simulation for space-time interaction of crime. In: Gervasi, O, Murgante, B,
Misra, S, Borruso, G, Torre, CM, Rocha, AMAC, Taniar, D, Apduhan, BO, Stankova, E and
Cuzzocrea, A, (eds.) Lecture Notes in Computer Science. 17th International Conference
on Computer Science and Its Applications (ICCSA 2017), 03-06 Jul 2017, Trieste, Italy.
Springer Nature , pp. 779-786. ISBN 978-3-319-62407-5
https://doi.org/10.1007/978-3-319-62407-5_60
(c) 2017, Springer International Publishing AG. This is an author produced version of a
paper published in Lecture Notes in Computer Science. Uploaded in accordance with the
publisher's self-archiving policy. The final publication is available at Springer via
https://doi.org/10.1007/978-3-319-62407-5_60
[email protected] https://eprints.whiterose.ac.uk/
Reuse
Unless indicated otherwise, fulltext items are protected by copyright with all rights reserved. The copyright exception in section 29 of the Copyright, Designs and Patents Act 1988 allows the making of a single copy solely for the purpose of non-commercial research or private study within the limits of fair dealing. The publisher or other rights-holder may allow further reproduction and re-use of this version - refer to the White Rose Research Online record for this item. Where records identify the publisher as the copyright holder, users can verify any specific terms of use on the publisher’s website.
Takedown
If you consider content in White Rose Research Online to be in breach of UK law, please notify us by
ICCSA, p. 1, 2017.
© Springer-Verlag Berlin Heidelberg 2017
Testing the adequacy of a single-value Monte Carlo
simulation for space-time interaction analysis of crime
Monsuru Adepeju (Orcid ID: 0000-0002-9006-4934)
School of Geogra phy, Uni vers i ty of Leeds , LS21 1HB, Uni ted Ki ngdom
Abstract. The goal of this study is to determine the number of i terations ( )
requi red in a Monte Ca rlo based space-time i nteraction a nalysis of cri me data s ets, i n order to test the a dequacy of using a single va lue of 999 i terations. A ca s e s tudy of burglary cri me data sets is presented in which Knox test is used for the a nalysis of space-time i nteractions. The outcomes of this a nalysis demonstrate that the use of a single value, such as 999, does not always re p-res ent the most appropriate number of i terations especially when multiple ST nei ghbourhood s izes are involved. This analysis opens further research oppor-tuni ties into determining the best s trategy to defining the expected distrib u-ti on i n a space-u-time i nteracu-tion a nalysis of cri me.
Keywords: ST nei ghbourhoods, Monte Ca rlo simulation, cri me, Knox test
1
Introduction
The use of a Monte Carlo (MC) simulation in space -time interaction analysis using the Knox test (Knox, 1964) usually involves 999 iterations in order to generate the expected distribution under the assumption of no space-time interactions. Despite the potentials of varying reliabilities relating to the un-derlying normal distribution for different pairs of spatial and temporal thresholds, the same number of iterations is usually employed in crime ap-plications (Johnson et al., 2007). This study therefore aims to test the ade-quacy of the generally adopted 999 iterations at a chosen reliability level for different spatial and temporal thresholds.
random variables (in this case, the Knox statistic), while the iterations are continuously repeated (Driel and Shin, 2004). Thus, the number of iterations needed ( ) to attain the specified error can be determined by monitoring the convergence of in relation to the actual number of iterations being pe
T
been carried out for space-time interaction analysis in relation to a crime data set. Therefore, the major goal of this study is to address this research gap by determining the number of iterations ( ) required for different spatio-temporal (ST) neighbourhoods of crime, and subsequently, examine the ade-quacy of using a single value of 999 iterations in the context of the generated results.
2
Space-time interaction analysis with the Knox test
The Knox test is the most commonly used technique for the analysis of the spatio-temporal interactions of crime data sets (Johnson et al., 2007). The Knox test measures whether there are disproportionate instances of ob-served pairs of events within a defined spatio-temporal neighbourhood than would be expected if the events had occurred randomly. Therefore, the h y-pothetical random occurrences represent the expected distribution, which is generally modelled as a normal distribution.
M K
The first matrix ( ) describes the closeness of all pairs of events in space, while the second matrix ( ) describes the closeness of all the pairs of events
in time. The closeness is defined by specifying a spatial neighbourhood ( ) and a temporal neighbourhood ( ), within which event j is considered close to event in space and time dimensions, respectively. Technically, each neighbourhood is the intersection of two distance thresholds;
Fig. 1. An illus tra tion of the spa tio-temporal neighbourhood a round a point (i n a Knox tes t). The event is the reference, while events , . Events fall wi thin the spa tial neighbourhood and temporal neigh-bourhood , and a re therefore considered close to in spa ce and time (Diagram from: Adepeju, 2017a ).
For each pair of spatial and temporal neighbourhood, the closeness is eval u-ated for every point ( ) across the entire study area and finally added togeth-er in ordtogeth-er to dtogeth-erive the Knox statistic as follows:
(1)
if event is within of otherwise if event is within of
otherwise
The is referred to as the observed, with which the expected statistics are compared to estimate the critical value ( ) through using the formu-la:
(2) Time
[image:4.596.209.384.150.317.2]Where is the number of iterations generated, is the equivalent list of expected statistics, and I(.) is the indication function.
An expected statistic is calculated via a new replica of the original data set, which is generated by randomising the time attribute of the events, while the spatial locations are kept constant. This process is the MC simulation (also called the iteration process). If each is considered a random
varia-ble, a plot of all
value, and standard errors which can be evaluated at varying confidence
T
close to the mean value of the hypothetical normal distribution within an error bound. Hence, it is assumed that this hypothetical normal distribution can only be attained if the iteration is run infinitely. However, both distribu-tions can be compared in order to examine the reliability of the obtained normal distribution.
3
Determining the number of iterations ( ) needed to attain a
specified error bound.
It is possible to determine the minimum number of iterations ( ) needed to provide a desired degree of reliability for the expected distribution ( ), as described in section 2. This process was used in Driel and Shin (2004) so as to estimate the r required in a precision analysis of military weapon effective-ness. Firstly, it is argued that needs to be large enough to obtain sufficient granularity in the cumulative density function of the . For example, if , it would not be possible to obtain a 1% rank. This is because an ana-lyst needs at least 100 iterations. Using the Driels and Shin (2004) approach therefore requires a continuous generation of large number of replicas in which a plot of r against the number of replicas, at a specified maximum ac-ceptable percentage error of the mean value can be used to monitor the convergence of .
(3)
(4)
Where the population is mean and is the population standard devia-tion of the random variables .
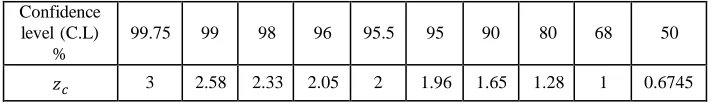
Table 1. Val ues of for different confidence levels for a normally dis tributed random
va ri a ble.
Confidence level (C.L)
%
99.75 99 98 96 95.5 95 90 80 68 50
3 2.58 2.33 2.05 2 1.96 1.65 1.28 1 0.6745
Given a confidence level of 95% for example, the confidence interval of the mean is therefore as follows:
(5)
This is stated as: we are 95% confident that the true mean is within ( ) of a sample of the mean of . The general form of equation 5 can then be wri t-ten as:
(6)
If the simulation is run for a finite number of iterations ( ), the sample mean and the standard error are thus estimates of the population statistics.
(7)
By considering the confidence interval as representing twice this maximum error, we have:
(8)
Hence, the percentage error of the mean becomes:
(9)
[image:6.596.123.479.268.320.2](10)
in equation 5.10 is the number of iterations needed to be carried out for a given error bound and a confidence interval whose coefficient is L imagine we want a confidence level of 95% at an error percentage of 1% of the mean, and will be 1.96 and 1, respectively, and can be estimat-ed from the generatestimat-ed random samples. The value of can thus be calculat-ed continuously as the replicas increase. Furthermore, the requircalculat-ed value of can be taken as the point where stabilises or converges in a plot of r against number of replicas.
4
Case study: data sets and experimental parameters
This test is demonstrated using the burglary crime data set of the San Fran-cisco area of the United States for the year 2015. The two most prominent
sub- T
-in--of- T
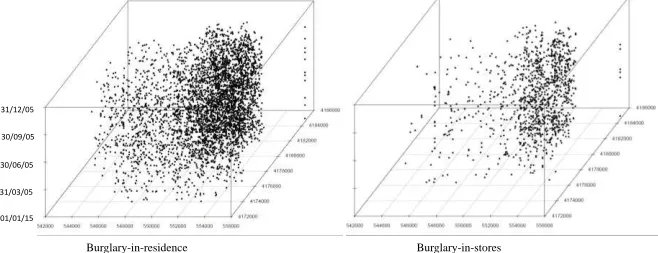
sets is based on a previous finding that demonstrates that sub-categories of burglary crimes possess distinct spatio-temporal interactions (Adepeju, 2017b). Besides, the 3-D visual exploration of both data sets illustrates that
-in- -of- -temporally;
[image:7.596.128.457.523.650.2]indicating a potential for two distinct spatial and temporal interactions (Fig. 2).
Fig. 2. A 3-D s ca tterpl ot of the ca s e s tudy da ta s ets
31/12/05
31/03/05
01/01/15 30/06/05 30/09/05
In order to ensure a robust analysis, three common levels (sizes) of spatial and temporal neighbourhoods in both dimensions are considered. These include small, medium and large levels. Thus, the following lists are can be defined:
Spatial neighbourhoods, = [0-200m], [301-500m], [701-900m]
Temporal neighbourhoods, = [0-2days], [7-21days], [30-60days]
The three levels are as demarcated with the brackets. Based on the two lists, corresponding spatio-temporal neighbourhood are formed by pairing each spatial neighbourhood with a temporal neighbourhood. Hence, a total of nine ST neighbourhoods are formed. This covers a range of levels commonly used in crime analysis.
In this study, the percentage error of 1% is chosen for the mean value, and a confidence interval of 95%. Both the mean value ( ) and the standard devia-tion ( ) are calculated after each iteration step. The values, and are then substituted into equation 10, where = 1 and = 1.96.
5
Results and discussions
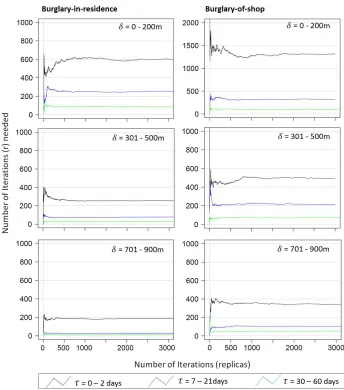
Fig. 3. The number of i terations needed ( ) a ga i ns t the number of i tera ti ons (repl i ca s ) .
Each plot shows the results generated for the selected temporal thresholds at each spatial threshold. For example, the top-most left and the top-most right plots are the results of the three temporal thresholds at the spatial
-in-
is obtained at the smallest spatiotemporal neighbourhood (i.e. intersection of = 0-200m and = 0-2 days), while the lowest is obtained at the largest ST neighbourhood (i.e. = 701-900m and = 30-60days. Technically, at large ST neighbourhoods, the mean values become relatively large in comparison to the standard error, thereby allowing values to converge faster. Whereas, there is higher variabilities at smaller ST neighbourhoods because of the rel a-tively small values of mean in comparison the standard error, thereby requi r-ing larger replicas to converge.
T -in- )
needed at the = 2days across all spatial thresholds is multiple times larger than all of the other temporal thresholds. The largest value of is obtained at the spatial threshold of 0-200m; a value which stabilises after only around 500 iterations. At the other spatial thresholds, stabilises much faster; converging even before 250 iterations. In this case, the values of are generally between 20 and 300. These are relatively small numbers compared
A
a-ry-of- for each corresponding
ST neighbourhoods. Thus, this indicates that t
-of-possesses a relatively higher variability in the ST distribution compared to the
-in- T D F . 2),
-of- ings for the
-in- T -of-
6
Conclusion and recommendations
This study has examined the number of iterations required for different sizes of spatio-temporal neighbourhoods of crime data sets. The aim was to test how reliable the practice of using a single value, such as 999 in a MC simul a-tion process. The result obtained shows that given some specified errors, different spatio-temporal neighbourhoods require different numbers of ite r-ations in order to generate reasonable expected (normal) distribution. This is in contrary to the general practice in which a uniform (single) value, particu-larly 999, is often used. Hence, it is argued that this is generally a practice used for convenience and to ensure the uniformity of precision in the re-ported critical values. In the future, the author would like to investigate how the findings of this study could be employed to achieve a more reliable result using a Knox test.
It is therefore recommended that this type of analysis should first be carried out in any spatial and temporal point pattern analysis. It will help to establish the reliability of the MC simulation process.
References
1. Adepeju, M.: Investigating the Repeat a nd Near-Repeat Pa tterns in Sub-categories of bur-gl a ry cri me. An a bstract s ubmitted to the 2017 International Conference on GeoCompu-ta ti on (2017b)
2. Adepeju, M.: Modelling of Sparse Spatio-Temporal Point Process (STPP) a n application i n Predictive Policing. A PhD thesis s ubmitted to the University College London (2017a ).
3. Dri els, M.R. a nd Shin, Y.S.: Determining the number of i terations for Monte Ca rlo simula-ti ons of weapon effecsimula-tiveness (2004).
4. Johnson, S.D., Bernasco, W., Bowers, K.J., El ffers, H., Ratcliffe, J., Rengert, G., Townsley, M.: Spa ce -time patterns of risk: a cross national a ssessment of residential burglary vi ctim-i za tctim-ion. J Quant Crctim-i mctim-inol,23, 201 219 (2007)