FOR SCATTERED DATA AND
MIXED ATTRIBUTE DATA
KE ZHANG
February 2010
A thesis submitted for the degree of Master of Philosophy
times and bad. Thank you for all the unconditional love, guidance, and support that you have always given me, helping me to succeed and instilling in me the confidence that I am capable of doing anything I put my mind to. Thank you for
I, Ke Zhang, hereby declare that the work on which this dissertation/thesis is
based is my original work (except where acknowledgements indicate otherwise)
and that neither the whole work nor any part of it has been, is being, or is to
be submitted for another degree in this or any other university. I empower the
university to reproduce for the purpose of research either the whole or any portion
of the contents in any manner whatsoever.
Signature:
First and foremost, I would like to thank my supervisor Prof. Marcus Hutter and
Dr. Huidong Jin for their dedicated supervision during my MPhil study. Their
endless help, care, kindness, patience, generosity, and thoughtful consideration are
greatly valued. I would like to thank Dr. Tiberio Caetano for his wonderful course
on Statistical Machine Learning Algorithms. It is his course that stimulated much
of my interest in this area, and which greatly contributed to my MPhil research.
I greatly appreciate Dr. Graham Williams for his willingness to share his wide
of knowledge with me and to give valuable suggestions on parts of my MPhil
research. I would also like to thank Dr. Lei Wang for his interesting course
in Pattern Recognition. I learned much from this course that provided a good
foundation for my long-term research career development.
Thanks also go to the College of Engineering and Computer Science for its
research facilities and atmosphere it created. In particular, I am very grateful
for personal help received from Ms. Debbie Pioch and Ms. Michelle Moravec.
I would like to thank my all colleagues and friends for the good times we have
had in ANU. I would like to thank my family for their continued support and
care. It would be impossible to finish my MPhil study without their continuous
understanding and support.
Finally, the most important person in all this endeavor was my wife, Danling
Zhou. Her love, patience, continuous encouragement and support were present
during all stages. The emotional stability resultant from a healthy relationship
has been the major element in tackling the most varied issues and difficulties
which are typical of the stressful period which is that of a MPhil. program. The
successful completion of this thesis was only possible due to her commitment,
optimism and unconditional support in all senses. I owe her my most profound
Acknowledgements vii
List of Tables xiii
List of Figures xvi
Notation and Terminology xvii
Abstract xix
1 Introduction 1
1.1 Scattered Data Problem . . . 2
1.1.1 Top-n style outlier . . . 3
1.1.2 Local distance-based outlier factor (LDOF) . . . 4
1.2 Mixed Attribute Data Problem . . . 4
1.2.1 Pattern based outlier detection approach . . . 5
1.3 Road Map . . . 6
2 Review on Outlier Detection 7 2.1 Motivation of the Review . . . 7
2.2 Overview of Outlier Detection Techniques . . . 8
2.2.1 Outlier definitions . . . 8
2.2.2 Applications of outlier detection techniques . . . 10
2.2.3 Categories of outlier detection techniques . . . 11
2.2.4 Challenges in outlier detection . . . 11
2.2.5 Review methodology . . . 13
2.3 Statistics Based Approach . . . 13
2.3.1 Typical methods . . . 14
2.3.2 Variants . . . 15
2.3.3 Advantages and disadvantages of statistics based methods 18 2.4 Neighbourhood Based Approach . . . 19
2.4.1 Typical methods . . . 19
2.4.2 Variants . . . 21
2.4.3 Advantages and disadvantages of neighbourhood based meth-ods . . . 22
2.5 Relative Density Based Approach . . . 23
2.5.1 Typical methods . . . 23
2.5.2 Variants . . . 24
2.5.3 Advantages and disadvantages of relative density based meth-ods . . . 26
2.6 Classification Based Approach . . . 26
2.6.1 Multi-class methods . . . 27
2.6.2 One-class methods . . . 28
2.6.3 Advantages and disadvantages of classification based methods 30 2.7 Clustering Based Approach . . . 30
2.7.1 Typical methods . . . 31
2.7.2 Advantages and disadvantages of clustering based methods 32 2.8 Outlier Detection in Special Domains . . . 32
2.9 Summary . . . 35
3 Local Distance-Based Outlier Detection 39 3.1 Introduction . . . 40
3.2 Formal Definition of Local Distance-based Outliers . . . 44
3.4 LDOF Outlier Detection Algorithm and Its Complexity . . . 47
3.5 Experiments . . . 49
3.6 Summary . . . 53
4 Pattern Based Outlier Detection 57 4.1 Introduction . . . 58
4.2 Pattern Definition in Mixed Attribute Data . . . 59
4.3 Pattern Based Outlier in Mixed Attribute Data . . . 62
4.4 Pattern Based Outlier Detection Algorithm . . . 66
4.5 Experimental Results and Comparison . . . 68
4.5.1 Synthetic data . . . 69
4.5.2 Real world data . . . 69
4.6 Summary . . . 75
5 Conclusions 77 5.1 Research Work and Contributions . . . 77
5.2 Limitations . . . 79
5.3 Future Works . . . 79
A Definitions of Outlier 81 B Evaluation of Outlier Detection Methods 85 B.1 Data Configurations . . . 85
B.1.1 Global outliers . . . 85
B.1.2 Contextual outliers . . . 87
B.1.3 Inlier cases . . . 87
B.2 Detection Performance Evaluation . . . 87
B.2.1 Evaluation methods and settings . . . 87
B.2.2 Evaluation of distribution based method . . . 89
B.2.3 Evaluation of graphical-aid based method . . . 91
B.2.5 Evaluation of mixture probabilistic model based method . 92
B.2.6 Evaluation of neighbourhood based methods . . . 93
B.2.7 Evaluation of relative density based methods . . . 94
B.2.8 Evaluation of multi-class classification methods . . . 95
B.2.9 Evaluation of one-class classification methods . . . 96
B.2.10 Evaluation of clustering based methods . . . 97
C Proof of Theorems 103 C.1 Proof Sketch of Theorem 3.4 . . . 103
3.1 The detecting precision for each method based on 30 independent
runs for WDBC dataset. . . 52
3.2 The detecting precision for each method based on 15 independent runs for Shuttle dataset. . . 53
4.1 The detection precisions of the four methods on synthetic dataset. 69 4.2 Experimental and comparison results of POD over the three datasets. The detecting precision for each method based on 30 independent runs. The bold numbers indicate that the detection precision is statistically significantly improved compared to the other three methods (paired T-test at the confidence level of 0.05). . . 72
A.1 Prevalent outlier definitions [65] . . . 82
A.2 Categories of outlier detection methods . . . 83
B.1 Simple data configurations of Global Outliers. . . 86
B.2 Simple data configurations of Contextual Outliers. . . 88
B.3 Simple data configurations of typical Inliers. . . 89
B.4 Detecting abilities over simple data configurations . . . 99
B.6 The names of outlier detection methods . . . 100
B.7 Summary of constrains over simple data configurations . . . 101
2.1 A demonstration of outliers. . . 9
2.2 A demonstration of Gaussian distribution model. . . 15
2.3 A box plot for a univariate dataset. . . 16
2.4 A demonstration of k nearest neighbours method. . . 20
2.5 A demonstration of kth-nearest neighbour distance method. . . . . 21
2.6 The 2-D demonstration of local outlier [7]. . . 24
2.7 The comparision of neighbourhood between COF and LOF. . . . 26
2.8 A demonstration of one-class SVM method [8]. . . 29
2.9 A demonstration of clustering based methods. . . 31
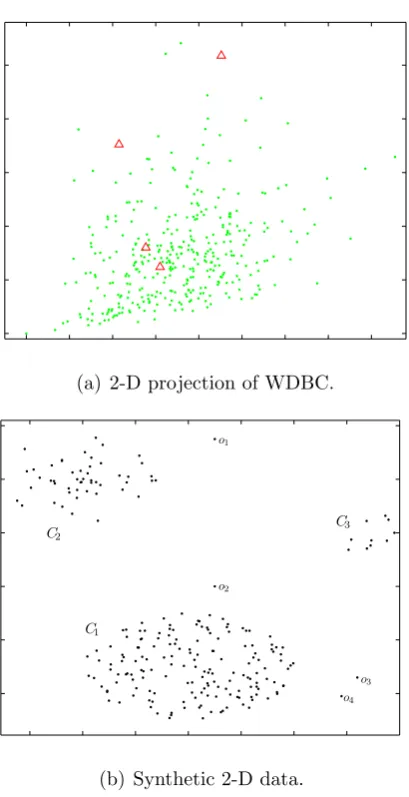
3.1 (a) The 2-D projection of a real world dataset. (b) Simple 2-D illustration. . . 41
3.2 (a) An anomalous object xp with scattered neighbours. (b) The explicit outlierness of object xp with the help of LDOF definition. A is the center of neighbourhood system of xp. The dashed circle includes all neighbours of xp. The solid circle is xp’s “reformed” neighbourhood region. . . 43
3.3 Detecting precisions of top-n LDOF, top-n KNN and top-n LOF on (a) Synthetical dataset, (b) WDBC dataset. . . 50
3.4 Data visualisation for WDBC dataset. . . 51
3.5 Data visualisation for Space Shuttle dataset. . . 53
3.6 Outlier detection precision over different neighbourhood size for
Shuttle dataset. . . 54
4.1 An indicative example of the pattern in a simple mixed attribute dataset. . . 61
4.2 An indicative example of the categorical outlier factors. . . 65
4.3 Mixed attribute outlier factor for each object. The length of line segment is proportional to M ADOF values. . . 70
4.4 Mixed attribute outlier factor for each object . . . 71
4.5 Data visualisation for Adult dataset. . . 72
4.6 Data visualisation for Census income dataset. . . 73
Notation
IR indicates the set of real numbers
D indicates a set of data objects
S indicates a subspace of D
O indicates a mixed attribute data object
x indicates a vector
xi indicates theith element in x
θ indicates a set of parameters
ˆ
θ indicates an estimated value of θ
k · k2 indicates the squared Euclidian distance
Terminology
Outlier An exact definition of an outlier often depends on
hid-den assumptions regarding the data structure and the
applied detection method. In Table A.1, typical outlier
definitions are listed.
Outlierness Outlierness is the degree to which a data object is an
outlier.
Outlier detection Mining outliers in observed datasets based on a
cer-tain outlier definition. It is also known as anomaly
detection or novelty detection.
Top-n style Instead of a binary outlier indicator, top-n style out-lier methods explore the n most suspicious data ob-jects. They provide a ranked list of objects to represent
the degree of ‘outlierness’ for each object. The users
(domain experts) can re-examine the selected top-n
(where n is typically far smaller than the cardinality of dataset) anomalous objects to locate real outliers.
Precision Precision= nreal-outliers in top-n/n. We set n as the
Detecting outliers which are grossly different from or inconsistent with the
re-maining dataset is a major challenge in real-world knowledge discovery and data
mining (KDD) applications.
The research work in this thesis starts with a critical review on the latest
and most popular methodologies available in outlier detection area. Based on a
series of performance evaluation of these algorithms, two major issues that exist
in outlier detection, namely scattered data problem and mixed attribute problem,
are identified, and then being further addressed by the novel approaches proposed
in this thesis.
Based on our review and evaluation it has been found that the existing outlier
detection methods are ineffective for many real-world scatter datasets, due to the
implicit data patterns within these sparse datasets. In order to address this issue,
we define a novel Local Distance-based Outlier Factor (LDOF) to measure the outlierness of objects in scattered datasets. LDOF uses the relative location of an
object to its neighbours to determine the degree that the object deviates from its
neighbourhood. The characteristics of LDOF are theoretically analysed, including
LDOF’s lower bound, false-detection probabilities, as well as its parameter range
tolerance. In order to facilitate parameter settings in real-world applications, we
employ a top-n technique in the proposed outlier detection approach, where only the objects with the highest LDOF values are regarded as outliers. Compared
to conventional approaches (such as top-n KNN and top-n LOF), our method, top-n LDOF, proved more effective for detecting outliers in scattered data. The
parameter settings for LDOF is also more practical for real-world applications,
since its performance is relatively stable over a large range of parameter values,
as illustrated by experimental results on both real-world and synthetic datasets.
Secondly, for the mixed attribute problem, traditional outlier detection
meth-ods often fail to effectively identify outliers, due to the lack of the mechanisms to
consider the interactions among various types of the attributes that might exist
in the real-world datasets. To address this issue in mixed attribute datasets, we
propose a novel Pattern based Outlier Detection approach (POD). A pattern in
this thesis is defined as a mathematical representation that describes the
major-ity of the observations in datasets and captures the interactions among different
types of attributes. The POD is designed in the way that the more an object
deviates from these patterns, the higher its outlier factor is. We simply use
lo-gistic regression to learn patterns and then formulate the outlier factor in mixed
attribute datasets. For the datasets which outliers are randomly allocated among
normal data objects, distance based methods, i.e. LOF and KNN, would not have
effective. On the contrary, as the outlierness definition proposed in POD is able to
integrate numeric and categorical attributes into a united definition, the numeric
attributes would not represent the final outlierness directly but contribute their
anomaly through categorical attributes. Therefore, the POD will be able to offer
considerably performance improvement compared to those traditional methods.
A series of experiments show that the performance enhancement by the POD
is statistically significant comparing to several classic outlier detection methods.
However, for POD, the algorithm sometimes shows lower detection precision for
some mixed attribute datasets, because POD has a strong assumption that the
observed mixed attribute dataset in any subspace is linearly separable. This
lim-itation is determined by the linear classifier, logistic regression, we used in POD
Introduction
“Of all the data mining techniques that are in vogue, outlier detection comes closest to the metaphor of mining for nuggets of information in real world data ever-increasingly collected.– – Sanjay Chawla”
Outlier detection is an important research problem in data mining that aims
to identify objects that are considerably dissimilar, exceptional and inconsistent
with the majority of the observations in the relevant datasets. It is concerned
with discovering the exceptional behaviour of certain objects [54]. Outlier
de-tection techniques have been widely applied in medicine (e.g. adverse reactions
analysis [30]), finance (e.g. financial fraud detection [18]), security (e.g.
counter-terrorism [56]), information security (e.g. intrusions detection [31]) and so on.
In recent decades, many outlier detection approaches have been proposed, which
can be broadly classified into several categories: distribution-based [5],
depth-based [57], distance-depth-based (e.g. KNN) [36], cluster-depth-based (e.g. DBSCAN) [13]
and density-based (e.g. LOF) [7] methods.
To facilitate better understanding of the latest techniques in the outlier
detec-tion domain, dozens of outlier detecdetec-tion techniques are critically reviewed, and
their performances are evaluated via a set of experiments. Based on these studies,
two problems are then found very prevalent among the latest outlier detection
techniques, which are:
1. Scattered data problem. It is found that many of the real world datasets
have very scattered space structures, which then leads to a relatively high
false positive rates for the targets detected by the current outlier detection
methods.
2. Mixed attribute data problem. Real world datasets are usually comprised
of both numerical and categorical attributes. However, because the
inter-actions between different types of attributes are not considered in most of
the current outlier detection methods, the performance on mixed attribute
datasets turned out unsatisfactory.
The scattered data problem and the mixed attribute data issue mentioned
above will be introduced and discussed in Section 1.1 and Section 1.2, respectively.
1.1
Scattered Data Problem
Real world data usually have a scattered distribution, where objects are loosely
distributed in the domain feature space. That is, from a “local” point of view,
these objects cannot represent explicit patterns (e.g. clusters) to indicate normal
data “behaviour”. However, from a “global” point of view, scattered objects
constitute several mini-clusters, which represent the pattern of a subset of objects.
Only the objects which do not belong to any other object groups should be genuine
outliers. Unfortunately, common outlier definitions depend on the assumption
that most of objects are crowded in a small number of main clusters, and thus
are incapable of dealing with scattered datasets, as mini-clusters in the dataset
will cause a high false-detection rate (or low precision).
Besides the scattered data problem, the parameter of outlier detection
ap-proaches are usually difficult to be selected appropriately for real world datasets.
Most outlier algorithms must be tuned through trial-and-error [14] process, which
is somehow impractical, because there is usually no or only very limited number
evalu-ate the detection performance without involving domain experts. Therefore, the
detection result will be uncontrollable if parameters for the algorithms are not
properly chosen.
1.1.1
Top-
n
style outlier
To deal with the parameter setting problem, researchers proposed top-n style outlier detection methods. Instead of a binary outlier indicator, top-n outlier methods provide rankings of objects in regards to the degree of ‘outlierness’ for
each object. The users (domain experts) can re-examine the selected top-n(where
n is typically far smaller than the cardinality of the dataset) anomalous objects to determine true outliers. Since this detection procedure can provide a good
interaction between data mining practitioners and domain experts, top-n outlier detection methods become more and more popular in real world applications.
Distance-based, top-n Kth-Nearest Neighbour distance [46] is a typical
top-n style outlier detection approach. In order to distinguish from the original distance-based outlier detection method in [36], we denoteKth-Nearest Neighbour
distance outlier as top-n KNN in this thesis. In this method, the distance from an object to its kth nearest neighbour (denoted here as k-distance) indicates
outlierness of the object. Intuitively, the larger the k-distance is, the higher the outlierness the object has. Top-n KNN outlier regards the n objects with the highest values of k-distance as outliers [46].
A density-based outlier, Local Outlier Factor (LOF) [7], was proposed in the
same year as top-nKNN. In LOF, an outlier factor is assigned for each object with respect to its surrounding neighbourhood. The outlier factor depends on how the
data object is closely packed in its locally reachable neighbourhood [14]. Since
LOF uses a threshold to differentiate outliers from normal objects [7], the same
problem of parameter setting arises. A lower outlierness threshold will produce
high false-detection rates, while a high threshold value will result in undetected
reliable to use LOF in a top-nmanner [54], i.e. only objects with the highest LOF values will be considered outliers. Hereafter, we call it top-n LOF.
Besides top-n KNN and top-nLOF, researchers have proposed other methods to deal with real world data, such as the connectivity-based (COF) [54], and
Res-olution cluster-based (RB-outlier) [14]. Although the existing top-n style outlier detection techniques alleviate the difficulty of parameter setting, the detection
precision of these methods (in this thesis, we take top-n KNN and top-n LOF as typical examples) is low on scattered data. In Section 3.1 in Chapter 3, we will
discuss further on the problems of top-n KNN and top-n LOF.
1.1.2
Local distance-based outlier factor (LDOF)
In this thesis we propose a new outlierness measurement, named Local
Distance-based Outlier Factor (LDOF), which is sensitive to outliers in scattered datasets.
LDOF uses the relative distance from an object to its neighbours to measure how
much objects deviate from their scattered neighbourhood. The higher the
viola-tion degree an object has, the more likely the object is an outlier. In addiviola-tion,
we theoretically analyse the properties of LDOF, including its lower bound and
false-detection probability, and provide guidelines for choosing a suitable
neigh-bourhood size. In order to simplify parameter settings in real world applications,
the top-n technique is employed in our approach. To validate LDOF, we perform various experiments on both synthetic and real world datasets, and compare our
outlier detection performance with top-nKNN and top-nLOF. The experimental results illustrate that our proposed top-nLDOF represents a significant improve-ment on outlier detection capability for scattered datasets.
1.2
Mixed Attribute Data Problem
The majority of the current outlier detection methods are designed for
or categorical attributes. However, real world datasets are usually more complex.
They often consist of different types of attributes, e.g. categorical (nominal) and
numerical (continuous) types, called mixed attribute data. For example, a data
object in a personal income survey contains numerical attributes (e.g. working
hours per week) and categorical attributes (e.g. occupation). In order to handle
mixed attribute data, researchers usually convert different types of attribute
val-ues into a single type. For algorithms working only on numerical datasets, mixed
attribute datasets have to be recoded. Categorical attribute values are recoded
as integer values (e.g. 0, 1, 2, ...), and then mixed with the numerical attribute
values of the original dataset [6]. Meanwhile, for some algorithms designed for
categorical datasets, numerical values will be discretised into several bins, and
re-garded as a set of categorical values [10]. However, the recoding and discretising
methods for dealing with mixed attribute data have several very obvious
draw-backs. Recoding or discretising will introduce noise or lose information in the
attribute conversion process [19], which could then result in significant
deterio-ration of the detection performance. Furthermore, single type attribute outlier
detection methods are not designed to consider interactions between categorical
and numerical attributes, which implies that the outlierness or anomaly in mixed
attribute datasets caused by the interaction between different types of attributes
can not be effectively detected by existing single type attribute methods. In
Section 2.8, a review of outlier detection techniques for mixed attribute data is
provided. Based on our discussion, the existing mixed attribute algorithms also
share the same problem incapable of handling the interactions between
differ-ent types of attributes. Therefore, the problem motivates us to propose a novel
outlier detection technique for mixed attribute data.
1.2.1
Pattern based outlier detection approach
In this thesis, we propose a Pattern based Outlier Detection approach (POD),
at-tributes without attribute conversion processes (e.g. discretising or recoding).
The pattern mentioned in this thesis in defined as a mathematical representation
that describes the majority of the observations in datasets and captures the
in-teractions among different types of attributes. Based on this definition, a new
outlier factor for mixed attribute data is proposed. The more an object deviates
from these patterns, the higher its outlier factor is. In POD, we simply use
logis-tic regression to learn patterns and formulate the outlier factor in mixed attribute
datasets. To validate our approach, we compare POD with three other typical
methods, LOADED [19], KNN [46] and LOF [7] over a series of mixed attribute
datasets from both synthetic and real world. Experimental results show that the
performance improvement by the POD is statistically significant comparing to
several classic outlier detection methods.
1.3
Road Map
This thesis is organised as following. In Chapter 2, we perform a critical review
and experimental evaluation on current outlier detection techniques, from which
two problems in current outlier detection techniques are identified. In Chapter 3,
our local distance outlier detection method is proposed to solve the scatted data
problem. The pattern based outlier detection technique is presented in Chapter 4
to address the mixed attribute problem. Chapter 5 concludes this thesis with a
Review on Outlier Detection
In this chapter, we provide a structured and luminous review of outlier detection
techniques. In sections followed, the most typical outlier detection techniques
and their variants are critically reviewed and discussed. Furthermore, the most
reviewed outlier detection techniques are theoretically and experimentally
eval-uated using several data configurations in which outliers are obvious, but some
algorithms fail. The process of techniques evaluation provides a great help for
us on deep understanding of current outlier detection techniques and sparking
new ideas. The organisation of the review is as follows. In Section 2.1, we brief
the motivation of the literature review, and in Section 2.2, we give an overview
on outlier detection techniques. In Sections 2.3 - 2.8, we discuss six categories
of outlier detection techniques separately. Finally, conclusions are presented in
Section 2.9.
2.1
Motivation of the Review
We have witnessed considerable research efforts in outlier detection in the past
a few years. Lots of outlier detection techniques have been proposed for solving
specific problems or cases in real world applications. To facilitate better
un-derstanding of latest techniques in outlier detection domain, dozens of outlier
detection techniques are critically reviewed and their performances are discussed
based on the evaluation in experiments. We have two motivations of performing
this review:
1. help us to systemically understand current outlier detection techniques by
the analysis of their advantages and disadvantages.
2. help us to find problems in current outlier detection techniques and spark
new ideas to handle the problems.
In recent years, several surveys on outlier detection have been published, such
as reviews in [25] and [8]. They have done fantastic work on generalising and
de-scribing outlier detection methods in multiple categories. Based on their efforts,
in this review, more attention has been paid for evaluating detection capabilities
applied on typical data configurations in which outliers are obvious, but some
algorithms fail. The detection performance of each method over typical data
con-figurations is discussed in Appendix B, and demonstrated in a table (Table B.4).
In a sum, our contribution to this review is:
• structurally reviewed outlier detection methods, and evaluated their
detec-tion capabilities applicable to a set of typical data configuradetec-tions.
• identified two problems in current outlier detection methods, and provided
research directions on solving them.
2.2
Overview of Outlier Detection Techniques
2.2.1
Outlier definitions
Though a large number of outlier detection techniques have been explored, there
is no universally accepted definition of outlier. Generally, outliers are data objects
which deviate the majority of the observed dataset. The majority in the observed
N1
N2
O1
[image:29.595.176.459.98.368.2]O2
Figure 2.1: A demonstration of outliers.
shown in Fig 2.1, most data objects are crowded into three components/clusters,
N1 and N2. Obviously, the two isolated objects, O1 and O2 are outliers.
However, the definition of an outlier has been differently represented in
vari-ous outlier detection literatures. These definitions are proposed with respect to
specific method-based outlier detection techniques. In Table A.1, typical
defi-nitions of outliers are presented, in that they represent the “interestingness” of
outlier detection tasks in different categories. For example, the outlier
defini-tion in graph-based outlier detecdefini-tion techniques suggests the graphical posidefini-tion
of data objects is crucial for identifying outliers [39]. On the contrary, in the
density based outlier definition, outliers can be only explored in low density
re-gions [7]. Being defined differently, those outlier definitions listed in Table A.1
all aim at identifying instances of unusual behavior when compared to the rest
majority of observations. From the point of view of data attribute type, most
definition, say except Hawkins [23], are for numeric attribute data. In Chapter 4,
2.2.2
Applications of outlier detection techniques
With a large amount of data being collected, applications of outlier detection
abound in fields such as financial fraud, counter-terrorism, criminal investigation
and computer intrusions. Some outlier detection applications are briefly
intro-duced:
• Fraud detection: This refers to criminal activities occurring in commercial
organisations, where malicious users (actual customers or ID theft) consume
the resources provided by the organisations without authorisation. There
are four typical cases:
1. Credit card fraud detection [18].
2. Mobile phone fraud detection [15].
3. Insurance claim fraud detection [62].
4. Insider trading detection [11].
• Medical and public health anomaly detection: Outlier detection techniques have been widely used for monitoring and analysing abnormal medical
records. The applications in the medical domain are:
– Medical sensor data monitoring, e.g electrocardiograms (ECG) and electroencephalograms (EEG), for detecting anomalous organ
condi-tions [40].
– Adverse drug reaction analysis [30], to highlight potential adverse drug reaction patterns.
• Intrusion detection: This type of application is used for detecting mali-cious activities on computer-based networks, such as ID theft, break-ins,
penetrations and other kinds of computer abuse without authorisation [31].
a whole system [34].
• Other domains: novelty detection in text data, sensor data, speech data [2],
digital images; fraud detection in Web applications [28].
2.2.3
Categories of outlier detection techniques
In this review, we classify outlier detection techniques into six categories: statistics-based,neighbourhood-based,relative density-based,classification-based, clustering-based and special domains. In the statistics-based category, outlier detection methods using statistics techniques, e.g. plot-box method and minimum
vol-ume ellipsoid method, are introduced. In the neighbourhood-based category,
k-nearest neighbour outlier detection technique and its variants are reviewed. In the relative density-based category, the typical method referred is local outlier
factor as well as its variants. In the classification-based category, both one-class
and multi-class classification outlier detection techniques are discussed. In the
clustering-based category, several methods based on clustering algorithms are
presented. In the last category, the outlier detection methods for mixed attribute
data are reviewed as the topic in special domain section. Experimental and
the-oretical evaluation of reviewed methods is performed and discussed in Appendix
B. Finally, Table B.4 demonstrates evaluated detection performance of reviewed
outlier detection methods.
2.2.4
Challenges in outlier detection
Currently, there are many difficulties existing in outlier detection tasks, such as
inexplicit boundaries between normal and abnormal, or an inappropriate outlier
definition which cannot represent all features of anomaly objects, or the lack of
labeled data for training and validation [8]. However, at an abstract level, there
are four main challenges for researchers of outlier detection:
techniques, most outlier definitions are designed either for numeric datasets
or for categorical datasets. However, in real world applications, datasets
collected usually contain multi-types of attributes, e.g. categorical, numeric
and interval. Since most outlier detection methods process different types
of attributes separately rather than consider interaction among them, those
methods can not handle mixed-attribute data effectively [19].
2. Outlier detection in high-dimensional datasets. As is known, in high
dimen-sional datasets the distance between a pair of objects has less meaning than
it has in low-dimensional datasets [38]. In other words, in high-dimensional
datasets, the distances between every pair of data objects are almost the
same for a wide variety of data distributions and distance functions [60].
Therefore, it is hard to define an effective measurement to indicate the
anomaly degree in high-dimensional datasets.
3. Outlier detection in evolving datasets. As the objects in evolving datasets
are dynamically changing, the current criteria of abnormal behavior might
not be sufficiently representative in the incoming data. Furthermore, the
learned parameters in outlier detection methods might be significantly
bi-ased by an incomplete dataset.
4. Outlier detection in very large datasets. Scalability is one of the main
fo-cuses in data mining as well as other fields of computer science. In the
applications of outlier detection, the scalability of algorithms is also
cru-cial. For example, in fraud detection, there are huge number of financial
transaction records that need to be processed every day. It is necessary that
fraud detection techniques to be used for very large datasets are efficient.
Because of the research interest of the author, more attention in the survey is
paid for handling of mixed attribute data, while less attention to the other three
challenges. The mixed attribute data challenge will be carefully discussed in the
2.2.5
Review methodology
This literature review aims to obtain a broad picture of current outlier
detec-tion techniques. It is based on the previous work of outlier detecdetec-tion surveys,
such as [25, 65, 8]. The literature to which we refer in the review are extracted
from conferences/journals on data mining and machine learning, such as Inter-national Conference on Knowledge Discovery and Data Mining (KDD), Inter-national Conference on Data Ming (ICDM), International Conference on Very Large Database (VLDB), Pacific-Asia Conference on Knowledge Discovery and Data Mining (PAKDD) and Journal of Machine Learning Research (JMLR).
In this review, we not only focus on the basic idea including definitions and
assumptions for each classic method, but also refer to typical variants of them.
In addition, the advantages and disadvantages for each method reviewed are
summarised at the end of each category. In the evaluation process, we perform
experiments for most of the methods applied to these data configurations by
us-ing source codes implemented by others or by the author. For those methods for
which we cannot neither find the source code nor implement them, we
theoreti-cally analyse their outlier detection performance. The evaluation procedure and
data configurations are discussed in Appendix B.
2.3
Statistics Based Approach
Let us start with very traditional outlier detection methods: statistics based meth-ods. The underlying principle of statistical based outlier detection approaches is: “An anomaly is an observation which is suspected of being partially or wholly irrelevant because it is not generated by the stochastic model assumed” [3]. In statistical outlier detection techniques, an outlier is not only an extreme data
value, but is surprisingly extreme among the dataset we observed.
This kind of outlier detection technique is based on a key assumption:
while anomalies occur in the low probability regions of the stochastic model [8]. Generally, there are two steps under the principle of statistical based
ap-proaches [8]:
1. using statistical techniques to fit a standard statistical model to a given dataset;
2. applying a statistical inference test to determine if a testing data instance
deviates from this model significantly or not.
Using a standard statistical model is the most important difference between statistical based outlier detection methods and other methods discussed in
Sec-tions 2.4 - 2.8.
If we anticipate a normal distribution we may react quite strongly to certain
observations which would arouse no specific concern if the expected model is
longer-tailed, say log-normal or Cauchy. The purpose of statistical method in
examining outliers is, in broad terms, to provide a means of assessing whether
our subjective declaration of the presence of outliers in a particular dataset has
important objective implications for the further analysis of the data.
2.3.1
Typical methods
Gaussian model based methods may be regarded as one of the most typical
statis-tical approaches for outlier detection. Such techniques assume that an observed
dataset is generated from a Gaussian distribution. The simplest method is
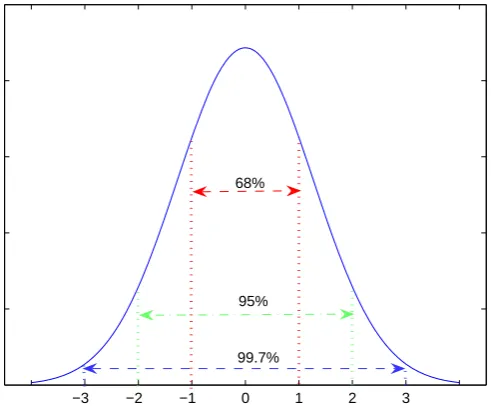
pro-posed in [51], which uses µ±3σ interval to identify an anomalous data object (µis the distribution mean and σ is the standard deviation for the distribution). As shown in Fig 2.2, the µ±3σ interval captures 99.7% of the data instances. A testing data instance is regarded as an outlier if it is more than 3σ distance away from the distribution mean, µ.
Researchers extend it to multivariate datasets, which is proposed in [5] and
dis-−3 −2 −1 0 1 2 3 68%
95%
[image:35.595.196.442.103.310.2]99.7%
Figure 2.2: A demonstration of Gaussian distribution model.
tance [41] to measure the statistical position of each object in the data distribu-tion. If the Mahalanobis distance of an object to the data distribution is greater
than a pre-defined threshold, it will be labeled as an outlier. In order to improve
the robustness of the Mahalanobis distance in the noisy dataset, [22] proposed a
covariance matrix estimator, named Minimum Covariance Determinant (MCD).
The basic idea of MCD is iteratively searching for the minimum determinant of
the covariance matrix with a subset of normal data instances.
2.3.2
Variants
There are several types of variants of the methods used in statistical outlier
detection, exemplified as follows.
Graphical-aid method
This method can be regarded as a data visualisation tool which maps the data into
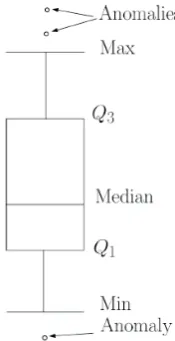
Figure 2.3: A box plot for a univariate dataset.
are allocated outside the majority pattern or in particular positions of the graph.
Laurikkala et al. [39] use box plots to detect outliers in both univariate and
multivariate data sets by producing a graphical representation which allows users
to visually identify the outlying points. This method displays a five-number data
summary: i.e. lower extreme (minimum), lower quartile, median, upper quartile,
upper extreme (maximum) [39]. Outlier is the point beyond the lower or the
upper extreme values of the box plot, as shown in Fig 2.3. For multivariate data
sets, the authors recommend using reduced sub-ordering based on the generalised
distance metric using the Mahalanobis distance measure [25]. The Mahalanobis
distance measurement includes inter-attribute dependencies so that the system
can compare attribute combinations [25].
Anomaly scores
Grubbs [20] defined an anomaly score function, z score, to detect outliers in a univariate data set. It assumes that the data are generated by a Gaussian
distribution. The z score function takes the form:
z = |x−x¯|
wherexis a data object. ¯xandsare respectively the mean and standard deviation of the data sample.
For identifying outliers, the author suggests a threshold, ta/(2N),N−2, which is
taken by at-distribution with degree of freedom of (N−2) at a significance level of 2aN [20]. A test instance is regarded as an outlier with the following condition:
z > N√−1
N
v u u t
t2
a/(2N),N−2
N −2 +t2
a/(2N),N−2
(2.2)
where N is the data size.
Depth based method
Depth based method refers to the methods using the concept of computational
geometry and projects data objects into layers ink-dimensional space [65]. In the statistical textbook [47], the authors define depth based outliers as: “depth based outliers are points in the shallow convex hull layers with the lowest depth”. In this textbook, two classic depth based methods are described: Minimum Volume
Ellipsoid (MVE) and Convex Peeling (CP). The MVE outlier detection method
uses an ellipsoid to fit around the dense area of the dataset. A point is regarded
as an outlier if it is outside the ellipsoid boundary. The CP outlier detection
method is based on computational geometry. Its basic idea is mapping data into
convex hull layers and assigning a depth to each point. The points on the convex
hull are labeled as outliers.
Mixture probability distribution model based method
Eskin [12] proposed a distribution based outlier detection method using a mixture
probabilistic model learned from observing datasets. In the mixture probability
distribution model, each object in the dataset falls into one of two cases:
generating the data: a “majority” distribution M and an “anomalous” distribu-tion A. Thus, detecting anomalies is equivalent to determining which elements are generated by the distribution A and which elements are generated by the distribution M. In order to make this determination, the author measured how likely each object is an outlier by comparing the difference change in the log
likelihood (LL) of the distribution if the element is removed from the majority distributionMt−1 and included with the anomalous distributionAt−1. That is to
say, if the difference (LLt−LLt−1) is greater than a threshold c, the current
ob-ject is regarded as an outlier. The author used uniform distribution to represent
the anomaly distribution PAt, and used a fixed order Markov chain probability
modeling method over the current set of normal objects to build the probability
model PMt. The mixture distribution model outlier detection method takes two
pases through the data. The first pass trains the probability distributions
assum-ing that every element is normal. The second pass computes the change in log
likelihood of the distribution to determine the anomaly of the object.
2.3.3
Advantages and disadvantages of statistics based
meth-ods
Based on the review in statistical outlier detection techniques, the advantages are
summarised as follows.
Firstly, statistical outlier detection techniques represent an unsupervised method
for outlier detection without the requirement of labeled data, while also providing
a statistically justifiable solution for outlier detection if the assumption for the
underlying data distribution is true.
Secondly, for every test data instance, there is a confidence interval associated
with decision. Meanwhile, the confidence interval implies another assumption as
Thirdly, if prior knowledge of the dataset is known, e.g. we know that the
waiting time in a queue follows a Poisson distribution, statistical based methods
will be effective.
However, this kind of methods have several disadvantages.
Firstly, methods in this category are too reliant on the data distribution
as-sumption. If the “real” data distribution is very different (or complex) from that
assumed, these kinds of methods will perform badly.
Secondly, as prior knowledge is required for the given data, e.g. mean and
variance, or number of components (Gaussian mixture model), these kinds of
methods need a lot of more efforts in order to deal with dynamic data, e.g.
streaming data or online data.
2.4
Neighbourhood Based Approach
The key idea of neighbourhood based methods is the use of distance or similarity
measurement to indicate the density of neighbourhoods [35, 37]. In [37], an object
x∈ D is defined as an outlier if at least a fraction p of all data objects in D has a distance above R fromx. In other words, an object, x, is an outlier if the data is sparse within the hypersphere with radius R. Compared with statistical based methods, neighbourhood based outliers are defined by using the distribution of
distance of other objects to a given object.
2.4.1
Typical methods
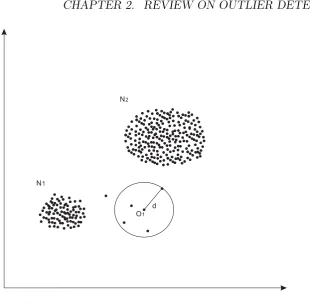
k-Nearest Neighbour outlier (KNN) is a typical distance-based outlier detection approach proposed in [37]. There are two parameters in KNN, neighbourhood
size, k, and hypersphere radius, d. An object O is an outlier if O has less than k
neighbours in the hypershere with radiusd. As shown in Fig 2.4, given a constant
d, the object O1 is identified as an outlier if k is set greater than 4. Therefore,
N1
N2
[image:40.595.132.443.74.379.2]O1 d
Figure 2.4: A demonstration ofk nearest neighbours method.
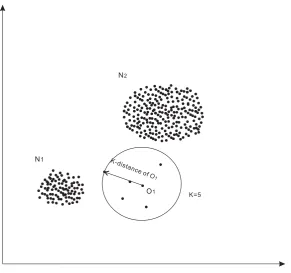
In [46], another kind of distance-based method , kth-Nearest Neighbour
Dis-tance, was proposed. In order to distinguish from the original distance based
outlier detection method in [37], we refer to the kth-Nearest Neighbour Distance
outlier as k-distance in this literature review. In the k-distance outlier, the dis-tance from an object to its kth nearest neighbour distance indicates outlierness of
the object, as shown in Fig 2.5. Intuitively, the larger the kth nearest neighbour distance is, the higher outlierness the object has. Thus, compared with statistical
based methods, thek-distance can be regarded as a kind of “confidence interval”. Thek-distance outlier regards thenobjects with the highest values ofkthnearest
neighbour distance as outliers [46]. The k-distance method does not require the radius of the hypersphere to be set, which is usually crucial for detection
N1
N2
O1
K-distance of O1
[image:41.595.176.468.98.371.2]K=5
Figure 2.5: A demonstration of kth-nearest neighbour distance method.
2.4.2
Variants
In addition to the two typical methods, variants have been proposed in recent
years. They can be broadly classified into the following three categories.
Different anomaly score definition
The first type of variant is that using a different anomaly score definition. In
our proposed outlier detection technique [64], LDOF (local distance based outlier
factor) was proposed to overcome the problems of local outlier and mini-cluster.
LDOF uses the position of an object relative to its neighbours to indicate the
degree of the object’s deviation from its neighbourhood system. Because LDOF
uses the relative distance factor rather than the distance between object pairs
directly, it is suitable for use in scatted datasets. A top-ntechnique was employed in this detection approach, where only objects with highest LDOF values are
Different distance/similarity definition
Another type of variant uses different distance/similarity definitions for different
features of datasets. Ghoting, et al. in 2004 [19] proposed a link-based outlier
algorithm, LOADED, for mixed attribute datasets. For dealing with categorical
attributes, they used association rules to determine dependencies of categorical
attributes. For numeric attributes, they calculated the covariance matrix to
ex-amine the anomaly of numeric values. To compute the anomaly score, the degree
of deviation of the two parts are simply added together.
Scalability
There are also several methods proposed for speeding up or reducing resources.
In [6], the authors proposed a new KNN algorithm, ORCA, in which algorithm
complexity was reduced to be almost linear, i.e., O(NlogN). In [55], based on the outlier notation in KNN, SNIF algorithm was proposed with a minimised I/O
cost.
2.4.3
Advantages and disadvantages of neighbourhood based
methods
Based on the review in neighbourhood based outlier detection techniques, the
advantages are summarised as follows.
Firstly, they provide an unsupervised approach for detecting outliers without
the requirement of prior knowledge of observing data.
Secondly, they can easily deal with different types of data attributes by
defin-ing appropriate distance/similarity measures.
Thirdly, many algorithms are available for significant reduction of
computa-tional resources for large datasets.
However, this kind of methods have several disadvantages.
function used to measure the degree of anomaly for each object, which is hard
to be effectively defined in high dimensional and complex datasets, e.g. mixed
attribute datasets and sequences datasets [8].
Secondly, the outlier definition is not strict. For example, in a sparse dataset,
normal data may be falsely detected as outliers if they do not have enough close
neighbours, where, on the contrary, in a dense dataset, anomalous data will be
ignored if they have enough close neighbours (but LDOF has been developed to
handle this issue to some extent).
2.5
Relative Density Based Approach
The relative density based outlier detection algorithm computes the local density
of a point x by using the average smoothed distances to a certain number of objects in the locality of x. The definition of a relative density based outlier is Outliers are points that lie in the lower local density with respect to the density of its local neighbourhood [7].
2.5.1
Typical methods
In [7], a typical relative density based outlier detection method, LOF, was
pro-posed. LOF focuses on detecting local outliers, which is demonstrated in
Fig-ure 2.6. In FigFig-ure 2.6, there are two clusters, C1 is spare and C2 is dense. p1 is
a global outlier which obviously deviates both C1 and C2. However, p2 is also
obvious an outlier because it significantly aparts fromC2. Thus,p2 is called local
outlier. LOF considers ratios between the local density around an object, x, and the local density around its neighbouring objects. The basic idea of LOF is to
assign a density-based local outlier factor (LOF, i.e. density ratio) to each object
of the database denoting a degree of outlierness [7], as shown in Fig 2.6. An
LOF value of approximately 1 indicates that the corresponding object is located
Figure 2.6: The 2-D demonstration of local outlier [7].
the density in the local neighbourhood ofx and the density around thek-nearest neighbours ofx is higher,x is assigned a higher LOF value. The higher the LOF value of an object is, the more distinctly is it considered to be an outlier.
Originally, in [7], LOF uses a threshold to differentiate outliers from
nor-mal objects, however, this is impractical in real world applications since the
threshold is problem dependent. A lower outlierness threshold will produce high
false-detection rates, while a high threshold value will result in missing genuine
outliers. In [32], the authors propose a new algorithm to efficiently mine the
top-n density-based local outliers in large datasets (i.e. those n objects having the highest LOF value).
2.5.2
Variants
Local correlation integral outlier
In [44], another local outlier detection approach, Local Correlation Integral (LOCI),
for finding outliers in large, multidimensional datasets is reported. The authors
introduce the definition of the multi-granularity deviation factor (MDEF) to
is that MDEF considers the set of objects in the r-neighbourhood rather than the
k-nearest neighbours in LOF. An object is regarded as an outlier if its MDEF
value deviates significantly (e.g. greater than three standard deviations) from
the local average value. The authors also introduced the LOCI plot, which can
provide the outlierness of the object as well as information about nearby clusters
and micro-clusters, their diameters and inter-cluster distances. In this way, this
approach becomes much less sensitive to input parameters. Further, in order
to handle large and multidimensional datasets, an approximative algorithm for
estimating MDEF values, aLOCI is proposed.
Spatial local outlier measure
In [53], another extension algorithm of LOF was proposed, the Spatial Local
Out-lier Measure (SLOM), for capturing the local behaviour of datum in their spatial
neighbourhoods. Because this method is focusing on spatial data mining, there
are two features which need to be taken into account in the spatial database:
spatial autocorrelation (objects are affected by their spatial neighbours) and
spa-tial heteroscedasticity (data variance is a function of the spaspa-tial neighbours).
With the consideration of the two features of spatial data, the authors define a
smoothed distance factor to indicate the degree by which the observed object
deviates from its neighbours. The outliers can be effectively detected with the
minimised influence of local data oscillation [53].
Connectivity based outlier factor
In [54], an improved local outlier factor was proposed, the Connectivity based
Outlier Factor (COF). COF is designed for sparse datasets, especially for sparse
contextual structure data. In COF, a set of nearest-path-of-neighbours of an
object is used to compute its outlierness instead of using their average distance
of each object pair. Thus, COF can effectively detect outliers in contextual
Figure 2.7: The comparision of neighbourhood between COF and LOF.
neighbourhood between COF and LOF in a line data structure.
2.5.3
Advantages and disadvantages of relative density
based methods
Based on the review in relative density based outlier detection techniques, the
advantages are summarised as follows.
Firstly, they provide a unsupervised learning method for outlier detection.
Secondly, they can effectively detect outliers in complex structure datasets
without the requirement of prior data knowledge.
However, this kind of methods have several disadvantages.
Firstly, they use distance measurement to indicate local density, this kind of
method is also inapplicable to high dimensional and complex datasets as well as
neighbourhood based methods.
Secondly, they share the same problem that exist in neighbourhood based
methods in which the outlier definition is not strict. Consequently, the detection
accuracy and detection rate will be significantly influenced in some cases.
2.6
Classification Based Approach
methods do not.
2.6.1
Multi-class methods
The basic idea of multi-class methods requires them tolearn a model (classifier) from a set of labeled data instance and then, classify a test instance into one of the classes using the learnt model [8]. The outliers are the data instances which are miss-classified or having the greatest classification error. Almost all classification
methods, e.g. support vector machines (SVM) [9] and neural networks [42], can
be used directly for detecting anomaly data instance. However, as labeled data
is essential for multi-class methods, it is not widely applied in outlier detection
tasks.
Bayesian networks based method
Bayesian networks are graphical models which can represent probabilistic
rela-tionships among input variables [59]. Many researchers have introduced Bayesian
networks techniques into outlier detection tasks, especially in the domain where
the data attributes show strong interactions, such as network intrusion [4] and
disease outbreak detection [59]. The basic idea of Bayesian networks based
out-lier detection methods is the estimation of the posterior probability of the input
data in a trained network. The class label with the largest posterior probability
is chosen as the predicted class for the given test instance [8]. The prior
proba-bilities for class labels are learned from training data. The data is regarded as
an anomaly instance if it can not be assigned to the correct class. For a
multi-variate categorical dataset, the posterior probability of each attribute should be
aggregated together to assign a class label to the observing data instance [8].
Decision tree based method
Decision tree techniques have been introduced as supervised learning
(classifies) unknown field values from learned data patterns. The Decision Tree
technique was first used for outlier detection in [33]. The author proposed a
ro-bust C4.5 learning algorithm which has less sensitivity to outliers. The basic idea
of robust C4.5 is repeatedly running C4.5 and removing those records which are
misclassified from the training dataset until all records in the reduced training
dataset are correctly classified.
2.6.2
One-class methods
Although there is no unified basic idea for one-class methods, the most important
feature of these kinds of methods is that they do not need class labels. They can
learn a model just from input data features.
One-class support vector machines method
One class support vector machines used for outlier (or novelty) detection were
proposed in [50, 49]. It is an extension of the support vector machine (SVMs)
to the case of unlabeled datasets. That is to say that one-class SVM does not
require labeled data as training data. The basic idea is mapping data into a
feature space by an appropriate kernel function and finding a hyperplane which
maximally separated the data from the origin. Ideally, through the kernel
func-tion, all normal/majority objects will be projected in a “small” region, and the
anomaly objects will deviate from the high density area, as shown in Fig 2.8. The
one class SVM can be regarded as a simple density estimator which is capable of
distinguishing a high density region from a sparse feature space. The objects
lo-cated in a high density region will be labeled as normal while the objects outlying
the hyperplane boundary are regarded as outliers. Similar to the basic SVM case,
the hyperplane parameters are determined by solving a quadratic programming
problem without taking labels into account. Besides the parameters in the kernel
Figure 2.8: A demonstration of one-class SVM method [8].
of data labeled as outliers, and the fraction of support vectors returned by the
algorithm [17].
Neural networks based method
In addition to support vector machines, researchers also use neural networks,
which are often used in safety-critical applications for regression or classification
tasks [65], for dealing with outlier detection problems. As the neural networks are
able to generalise well to unseen data patterns and are capable of learning complex
class boundaries [25], they are employed in special domain outlier detection tasks,
e.g. network intrusion. One-class neural networks outlier detection methods
are used to reconstruct data objects. Outliers are the data objects that are
not reproduced well at the output layer with high reconstruction errors [24].
In [24, 58], a neural network based outlier detection method was proposed, the
replicator neural networks (RNN). RNN has three hidden layers besides the input
and output layers, and it employs a feed-forward multi-layer perception neural
network to construct data models. The basic idea of RNN is to reproduce the
input data with minimised prediction errors. If the input data can be precisely
reconstructed in the trained neural networks, it is regarded as normal data. On
outlier. To help users to make a correct decision, an outlier factor based on the
average prediction error is used to measure the outlierness for each point instead
of a binary decision.
2.6.3
Advantages and disadvantages of classification based
methods
Based on the review in classification based outlier detection techniques, the
ad-vantages are summarised as follows.
Firstly, for one-class classification methods, they provide a unsupervised
tech-nique to effectively detect outliers without any prior information from a dataset.
Secondly, they have fast running speeds on testing phases given a learnt model.
However, this kind of methods have several disadvantages.
Firstly, their detecting performance is sensitive to the parameters, and it also
has a very intensive computing load in the learning phases.
Secondly, their lack of a meaningful anomalous score, which can correctly
indicate the “confidence interval” of detecting results.
2.7
Clustering Based Approach
Clustering algorithms can be regarded as a kind of unsupervised classification
methods, such asK-mean [27], DBSCAN [48], CURE [21] and TURN [16]. These methods can iteratively classify observed data into several (user defined or
auto-matically computed) groups referred to as clusters, as shown in Fig 2.9. Many
clustering methods have been applied to outlier detection applications. Their
basic assumptions for outliers are: “normal data instances belong to a cluster in the data, while anomalies either do not belong to any cluster” or “normal data instances lie close to their closest cluster centroid, while anomalies are far away from their closest cluster centroid” [8].
Figure 2.9: A demonstration of clustering based methods.
methods, clustering based methods evaluate each instance with respect to the
cluster it belongs to, while neighbourhood/relative density based methods
anal-yse each instance with respect to its local neighbourhood.
2.7.1
Typical methods
In [29], the authors propose a clustering based outlier detection method. In
their method, outliers can be identified through two phases. In the first phase,
the objects in the observed dataset are split into several clusters by using the
traditional K-mean algorithm. In the second phase, the minimum spanning tree (MST) technique is employed to detect outliers. The objects in small clusters are
regarded as outliers if the number of MST nodes are fewer than in others. In [14],
a parameter free outlier detection method was proposed, the resolution based
outlier factor (ROF), which is based on the parameterless clustering algorithm
TURN. ROF identifies outliers by changing the clustering resolution of TURN.
2.7.2
Advantages and disadvantages of clustering based
methods
Based on the review in clustering based outlier detection techniques, the
advan-tages are summarised as follows.
Firstly, they provide an unsupervised approach of outlier detection. Secondly,
they can effectively handle complex datasets, based on the good performance of
clustering algorithms.
However, this kind of methods have several disadvantages.
Firstly, they are not optimal for finding outliers as the main aim is to find
clusters. Secondly, their detection performances are determined by the clustering
algorithm they used. The detection performance and computing complexity is a
trade-off.
2.8
Outlier Detection in Special Domains
In this section, we put attention on mixed attribute data problem. Researchers
have noticed mixed attribute problems and proposed several effective methods
for dealing with mixed attribute datasets, such as graphical-aid based (e.g. Box
plot [39]), link based (e.g. LOADED [19]), classifier based (e.g. RELOADED [43])
and counting based (e.g. marginal probability anomaly detection [10]). We review
them briefly below.
Zhexue Huang [27] proposed aK-Mean based method, K-prototype, for han-dling data with numeric and categorical values. Although this algorithm was
designed for clustering, it represented a simple way to combine mixed-attribute
data into computation while previous methods which can process mixed-attribute
data had quadratic computational cost growing along the size of dataset. In the
K-prototype method, a similarity measure function for categorical data was de-fined, which determined by the frequency of categorical values in clusters. The
function)and categorical attributes (proposed categorical similarity measure
func-tion) separatively, and linearly combined those two parts inK-mean cost function.
Ghoting, et al. in 2004 [19] proposed a link-based outlier algorithm for mixed
attribute datasets, named LOADED. They used Association Rules to determine
dependencies of categorical attributes, and calculated covariance matrix to
ex-amine the anomaly of numeric values. Although the categorical and numeric
values could be processed at the same time, the outlier scoring used to detect
anomaly was performed separatively for the two types of attribute values. Thus,
intuitively, their approach for dealing with mixed attribute data could not have
perfect performance due to lack of considering interactions among different types
of attributes.
Otey, et al. in 2005 [43] proposed a classifier-based outlier algorithm, named
RELOADED. It was an improved version of LOADED with reduced memory
usage. The authors employed trained Naive Bayes Classifiers to predict
categor-ical attribute values. If the predicted one violated observed value, the anomaly
scores of this record would be increased. For numeric values, they computed the
covariance matrix over all of unique attribute-value pairs, and used it to check
vi-olation of each numeric attribute value. RELOADED still separatively considered
anomaly of each type of attributes rather than involving their interactions.
Yu, et al. in 2006 [61] proposed a graph-based outlier algorithm. As an
ex-tension of LOF [7], it is aim to detect local outliers in the center, where they are
surrounded by normal clusters, but deviate from others. The authors introduced
a similarity graph which is a weighted connected undirected graph to measure
the relationships between objects. In this method, the observing object and its
neighbours are regarded as a set of nodes (or vertices). If a pair of nodes have
similar components, they are connected by a edge. The more similarities the two
nodes share, the larger weight the edge is assigned. On the graph, there is a
sequence of connected edges, called a walk. A closed walk is defined that a

![Figure 2.6: The 2-D demonstration of local outlier [7].](https://thumb-us.123doks.com/thumbv2/123dok_us/8034256.219650/44.595.154.398.100.295/figure-d-demonstration-local-outlier.webp)

![Figure 2.8: A demonstration of one-class SVM method [8].](https://thumb-us.123doks.com/thumbv2/123dok_us/8034256.219650/49.595.198.439.107.267/figure-demonstration-class-svm-method.webp)