Characterisation of flowmotion in
healthy controls and type 2 diabetes
By
Sarah Blackwood
BMedRes (Hons.)
Submitted in fulfilment of the requirements for the degree of
Doctor of Philosophy (Medical Research)
Menzies Institute for Medical Research
University of Tasmania
ii
Table of contents
Table of contents ... ii
Acknowledgments ... vii
Statement ... ix
Authority of Access ... ix
Abstract ... x
Abbreviations ... xi
Preface ... xii
Chapter 1 - Introduction ... 1
1.1 Vascular structure ... 3
1.1.2 Capillary perfusion ... 5
1.1.2.1 Techniques to measure capillary perfusion ... 7
1.1.2.2 Alternative skeletal muscle blood flow hypotheses ... 12
1.2 Vasomotion and flowmotion ... 13
1.2.1 In vivo measurement of flowmotion ... 15
1.2.2 Cellular mechanism of vasomotion... 18
1.2.2.1 Myogenic input ... 18
1.2.2.2 Neurogenic input ... 19
1.2.2.3 Endothelial input ... 20
1.3 Insulin-mediated changes to skeletal muscle haemodynamics and their effect on metabolism ... 22
1.3.1 Insulin-mediated changes in blood flow ... 22
1.3.2 Insulin-mediated skeletal muscle glucose uptake ... 25
1.3.4 Insulin resistance and microvascular dysfunction ... 26
1.3.5 Flowmotion: Insulin-mediated changes and dysfunction in insulin resistance and T2D ... 29
1.4 Summary of study aims: characterisation of flowmotion ... 32
1.4.1 Clinical hypothesis and aims ... 33
1.4.2 Animal studies hypothesis and aims ... 34
Chapter 2 - General Methods ... 35
2.1 Clinical studies ... 36
2.1.1 Testing conditions ... 36
iii
2.1.3 Skeletal muscle microvascular perfusion ... 38
2.1.4 Brachial artery blood flow ... 40
2.1.5 Blood pressure ... 41
2.1.6 Blood analysis ... 41
2.1.7 Body composition ... 42
2.1.8 Analysis ... 42
2.1.8.1 Microvascular blood flow averages ... 42
2.1.8.2 Complexity ... 42
2.1.8.3 Flowmotion ... 44
2.2 Laboratory experiments ... 47
2.2.1 Animal care ... 47
2.2.2 In vivo protocol ... 47
2.2.2.1 Surgery ... 47
2.2.2.2 Laser Doppler Flowmetry ... 49
2.2.2.3 Contrast enhanced ultrasound ... 49
2.2.3 Haemodynamic and LDF data analysis ... 52
2.2.4 CEU and LDF flowmotion analysis ... 52
2.3 Summary of blood flow measures ... 54
2.4 Statistical analysis ... 54
Chapter 3 - Microvascular flowmotion in the skin and subcutaneous tissue: healthy control versus T2D ... 55
3.1 Introduction ... 56
3.2 Methods ... 59
3.2.1 Screening visit ... 59
3.2.2 Clinic visit ... 59
3.2.2.1 Skin and subcutaneous tissue microvascular blood flow ... 60
3.2.2.2 Total forearm blood flow ... 60
3.2.2.3 Forearm skeletal muscle microvascular perfusion ... 61
3.2.2.4 Blood pressure and heart rate ... 61
3.2.2.5 Blood analysis... 61
3.2.3 Data analysis ... 61
3.2.3.1 Microvascular blood flow averages ... 61
3.2.3.2 Complexity measures ... 62
3.2.3.3 Flowmotion measures... 62
iv
3.3 Results ... 63
3.3.1 Participant characteristics ... 63
3.3.2 Forearm total flow ... 65
3.3.3 Skin and subcutaneous tissue microvascular blood flow and tissue oxygenation ... 66
3.3.4 Skin and subcutaneous tissue complexity measures ... 67
3.3.5 Forearm skeletal muscle microvascular perfusion. ... 67
3.3.6 Skin and subcutaneous tissue flowmotion measures ... 68
3.4 Discussion ... 74
Chapter 4 - Microvascular flowmotion in the skin and subcutaneous tissue in healthy controls and type 2 diabetics: oral glucose challenge ... 80
4.1 Introduction ... 81
4.2 Methods ... 83
4.2.1 Protocol ... 83
4.2.1.1 Skin and subcutaneous tissue microvascular blood flow ... 84
4.2.1.2 Total forearm blood flow ... 85
4.2.1.3 Forearm skeletal muscle microvascular perfusion ... 85
4.2.1.4 Blood analysis... 85
4.2.2 Data analysis ... 85
4.2.2.1 Microvascular blood flow averages ... 85
4.2.2.2 Complexity measures ... 85
4.2.2.3 Flowmotion measures... 86
4.3 Statistical analysis ... 86
4.3 Results ... 87
4.3.1 OGC blood glucose and plasma insulin ... 87
4.3.2 Forearm total flow ... 88
4.3.3 Skin and subcutaneous tissue microvascular blood flow and tissue oxygenation ... 89
4.3.4 Skin and subcutaneous complexity measures ... 90
4.3.5 Forearm skeletal muscle microvascular perfusion ... 91
4.3.6 Correlation between skin and subcutaneous tissue flux and skeletal muscle perfusion .... 93
4.3.7 Correlation between diabetes duration and blood flow measures ... 94
4.3.8 Skin and subcutaneous tissue flowmotion measures ... 95
4.4 Discussion ... 102
Chapter 5 - Microvascular flowmotion in the skin and subcutaneous tissue in type 2 diabetics: the effect of resistance training ... 109
v
5.2 Methods ... 113
5.2.1 Resistance training intervention ... 113
5.2.1.1 Strength assessment ... 114
5.2.2 Protocol ... 114
5.2.2.1 Skin and subcutaneous tissue microvascular blood flow ... 115
5.2.2.2 Total forearm blood flow ... 115
5.2.2.3 Forearm skeletal muscle microvascular perfusion ... 116
5.2.2.4 Blood analysis... 116
5.2.3 Data analysis ... 116
5.2.3.1 Microvascular blood flow averages ... 116
5.2.3.2 Flowmotion measures... 116
5.2.4 Statistical analysis ... 117
5.3 Results ... 118
5.3.1 Participant characteristics ... 118
5.3.1 Strength improvement with resistance training ... 119
5.3.2 OGC blood glucose and plasma insulin ... 120
5.3.2 Forearm total flow ... 121
5.3.3 Skin and subcutaneous tissue microvascular blood flow and tissue oxygenation ... 122
5.3.4 Forearm skeletal muscle microvascular perfusion ... 123
5.3.5 Correlation between skin and subcutaneous tissue flux and skeletal muscle perfusion .. 124
5.3.6 Skin and subcutaneous tissue flowmotion measures ... 125
5.4 Discussion ... 132
Chapter 6 - Adaption of contrast enhanced ultrasound to measure skeletal muscle flowmotion ... 137
6.1 Introduction ... 138
6.2 Methods ... 141
6.2.1 Animal care ... 141
6.2.2 In vivo surgery ... 141
6.2.3 Experimental procedure ... 141
6.2.3.1 Protocol A ... 141
6.2.3.2 Protocol B ... 142
6.2.4 Data analysis ... 143
6.2.4.1 Haemodynamic and LDF flux analysis ... 143
6.2.4.2 LDF + OXY flowmotion analysis ... 143
6.2.4.3 CEU flowmotion analysis ... 143
vi
6.3 Results ... 147
6.3.1 Systemic haemodynamic changes ... 147
6.3.2 Microvascular haemodynamic changes ... 148
6.3.3 Skeletal muscle flowmotion changes ... 149
6.4 Discussion ... 153
Chapter 7 – Discussion ... 158
7.1 Summary of findings ... 159
7.2 Flowmotion in healthy controls ... 160
7.3 Flowmotion in type 2 diabetes ... 162
7.4 Conclusion ... 174
vii
Acknowledgments
First and foremost, I must thank my awesome supervisors for all the time and effort they have put
into me over the last 4.5 years, through honours and a PhD. Their guidance and help has inspired and
pushed me to be the best researcher I can be. A particular thanks to my two main supervisors.
Prof. Steve Rattigan, thank you for trusting me with a project you are so passionate about. You have
always pushed me to be better, to think more, and I know it has made me an infinitely better scientist
as a result. Dr Renee Dwyer I am pretty sure you are the reason I’ve been able to get this PhD done no
matter what life has thrown my way. I am profoundly grateful to you for always giving me time to
discuss the data, checking I’m okay and making sure I kept my sanity. Your ability to edit my first drafts
in a way that doesn’t have me on the floor in the foetal position is also greatly to be admired.
Thanks also goes to Dr Michelle Keske, whom I think of as the voice of reason in my life. Never
underestimate just how grateful I am when you say it like it and give me a straight forward way to
progress. I have immense respect for you because of it. Dr Steve Richards, who swoops in to provides
valuable advice whenever needed. Who is also there with a bottle of red whenever wine is needed.
I am profoundly grateful to you all for your support and friendship.
The collection of some of the data in this thesis was performed by a number of fantastic people in my
group. Michelle Keske and Ryan Russell were the brains and the work behind the clinical study
described in this thesis. Michelle acquired the funding and put hours into the running of the study.
Ryan must be acknowledged for running the day to day operations and collecting the ultrasound blood
flow data (total flow and CEU) in the clinical chapters of this thesis. Michelle, Ryan and Renee also ran
and supervised the RT intervention described in chapter 5. Donghua Hu was responsible for the
analysis of clinical blood chemistry data. Eloise Bradley performed the upper thigh phentolamine
experiments described in chapter 6. I thank them all for providing this data so that my thesis can tell
a more complete story.
There are a number of clinical studies that didn’t make it into this thesis in the end. I would just like
to thank Rach, Dean, James and the two Kates for being incredibly accommodating and helpful
towards me. I thank them for letting me take some LDF measures on the participants of their studies.
viii A thank you to Diabetes Tasmania, as well as Staples and Konica Minolta who have both provided me
with an elite top out scholarship at different times throughout my PhD.
I thank other past and present members of the MRG group for their support and friendship.
Particularly Aascha, Dino, Eloise and Helena who have all helped me whenever I have asked, and put
up with me singing to myself in the lab.
A profound thank you goes out to my fellow PhD students, your support and friendship has kept me
afloat when I was drowning over the last 3.5 years. I thank the OHA hockey club, particularly the
A-pool women, for being a second family to me and for saving me from myself. I thank all my friends
and anyone I have bailed up into a corner and passionately talked science to non-stop. You have all
made doing a PhD much less stressful and much more enjoyable than it otherwise would have been.
To my amazingly supportive family, no words will ever thank you enough for the unconditional love
and support you give me. I know that no matter what happens, no matter what I need, you will
unquestioningly come to my rescue. Because of your love and generosity, I can peruse anything my
heart desires, and that is an incredible gift.
Finally, this thesis is dedicated to two wonderful people in my family who have profoundly enriched
and bettered my life:
To my Grandfather Colin Milford Blackwood (1919 to 2010), a man of exceptional integrity and
courage. His sacrifice and choices have meant that my life is free of limitations. Because of him I am
able follow my passions without question or hesitation, something I will always be immensely grateful
for.
And to my darling Nan, Joan Smythe. A person who has always inspired me with her kindness for
others and passion for life, no matter what comes her way. I not only have your name, but your
strength and determination that makes sure I achieve all that I am capable of and live life to the fullest.
ix
Statement
The work in this thesis has been undertaken exclusively for the use of a PhD in the area of Biochemistry and has not been used for any other higher degree or graduate diploma in any university. All written and experimental work is my own except that which has been referenced accordingly.
Sarah J. Blackwood
Authority of Access
This thesis may be available for loan and limited copying in accordance with the Copyright Act 1968.
x
Abstract
Flowmotion, the rhythmic oscillation of blood flow across a tissue, optimises nutrient delivery at rest and during states of increased metabolic demand. Five known factors influence flowmotion patterns across a tissue, each distinguishable by their rate of input; cardiac, respiratory, myogenic, neurogenic and endothelial components. In disease states such as type 2 diabetes (T2D), flowmotion is thought to be altered and may contribute to dysregulated metabolism. The aim of this thesis was to characterise flowmotion in healthy controls and T2D participants.
Flowmotion was investigated in healthy controls and T2D participants at rest, and following endogenous insulin release in response to a 50g oral glucose challenge (OGC). The effect of a resistance training (RT) intervention in T2D participants was also assessed. Total blood flow to the forearm was measured using 2D-ultrasound and skeletal muscle perfusion was measured with contrast enhanced ultrasound (CEU). Microvascular blood flow in the skin and subcutaneous tissue (skin+SC) of the forearm was examined using a combined Laser Doppler Flowmetry (LDF) and tissue oxygenation probe. Spectral analysis (wavelet transformation) was performed on the data to characterise the individual contributions of the five factors known to influence flowmotion.
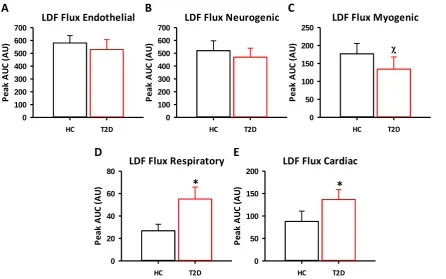
Type 2 diabetics exhibited differences in total blood flow, skin+SC LDF flux and skin+SC flowmotion compared to healthy controls at rest. Flowmotion was altered in response to the OGC in healthy controls, without changes in total flow and skin+SC LDF flux. In contrast, flowmotion and skin+SC LDF flux were unaltered in response to OGC in T2D, while total blood flow to the forearm increased. In the T2D group, a 6-week RT intervention partially restored skin+SC flowmotion.
In response to OGC skeletal muscle microvascular perfusion was reduced in healthy controls, but not in T2D participants. In contrast, skin+SC microvascular perfusion did not change in response to OGC in either group, indicating skin+SC flowmotion may not represent flowmotion in skeletal muscle.
The CEU technique, used to determine skeletal muscle microvascular perfusion, was adapted to investigate flowmotion within skeletal muscle. In anaesthetised rats, skeletal muscle flowmotion patterns were measured with both the LDF and the newly adapted CEU techniques. An α-adrenoceptor antagonist, which inhibits the neurogenic component of flowmotion, was used to compare the two techniques. Both the LDF and CEU methods detected the inhibition. In addition, the CEU method enable identification of different flowmotion patterns within specific fibre types.
xi
Abbreviations
1RM 1 repetition maximum
AUC Area under the curve
BMI Body mass index
Δ Delta, change from basal
Ca2+ Calcium
CEU Contrast enhanced ultrasound CNS Central nervous system
ET-1 Endothelin 1
FBF Femoral blood flow
GMP Guanosine monophosphate
HR Heart rate
LDF Laser Doppler Flowmetry
LDF + OXY Combined Laser Doppler Flowmetry and tissue oxygenation probe MAP Mean arterial pressure
MAPK Mitogen-activated protein kinases
NA Noradrenaline
NO Nitric oxide
O2 Sat Oxygen saturation
PI3K Phosphoinositide 3-kinase
RBC Red blood cell
ROI Region of interest
Skin+SC Skin and subcutaneous tissue SNS Sympathetic nervous system
SNP Sodium nitroprusside
T2D Type 2 diabetes
tHb Total haemoglobin
xii
Preface
Listed below are the data obtained for the present thesis that has been submitted for publication or
presented at scientific meetings.
Papers accepted for publication
Michelle A. Keske, Renee M. Dwyer, Ryan D. Russell, Sarah J. Blackwood, Aascha A. Brown, Donghua
Hu, Dino Premilovac, Stephen M. Richards, Stephen Rattigan. Regulation of Microvascular Flow and
Metabolism: An Overview. Clinical and Experimental Pharmacology and Physiology.
Review article.
Manuscripts in progress
Sarah J. Blackwood, Renee M. Dwyer, Eloise A. Bradley, Michelle A. Keske, Stephen M. Richards,
Stephen Rattigan. Determination of skeletal muscle microvascular flowmotion with novel contrast
enhanced ultrasound technique. Under review at Cardiovascular Research.
Performed all experiments and wrote the manuscript, data from chapter 6.
Ryan D. Russell, Donghua Hu, Timothy Greenaway, Sarah J. Blackwood, Renee M. Dwyer, James E.
Sharman, Graeme Jones, Kathryn A. Squibb, Aascha A. Brown, Meg Boman, Hayder Al-Aubaidy, Dino
Premilovac, Christian K. Roberts, Samuel Hitchins, Stephen M. Richards, Stephen Rattigan, Michelle A.
Keske. Skeletal Muscle Microvascular-Linked Improvements in Glucoregulatory Function from
Resistance Exercise in People with Type 2 Diabetes. Intend to submit to Diabetes Care.
Collected and analysed LDF data and wrote methods and results section pertaining to this data
xiii Oral Presentations at conferences
Invited talk at The Physiological Society (UK) Annual Meeting. Cardiff, Wales, UK. July 2015. Sarah J.
Blackwood, Renee M. Dwyer, Michelle A. Keske, Stephen M. Richards, Stephen Rattigan.
Determination of skeletal muscle microvascular flowmotion with contrast enhanced ultrasound
Invited talk at The Physiological Society (UK) Annual Meeting. Cardiff, Wales, UK. July 2015. S. Rattigan,
S. J. Blackwood, E. Bradley, S. Richards, R. M. Dwyer, M. A. Keske. Methods for assessing microvascular
flowmotion in humans.
Invited talk at the 10th World Microcirculation Meeting in Kyoto Japan. Tokyo Japan. September 2015.
Michelle A. Keske, Sarah J. Blackwood, and Stephen Rattigan. Methods for the investigation of
flowmotion.
Australian Physiological Society Annual Meeting. Hobart, Tasmania, Australia. November 2015. Sarah
J. Blackwood, Ryan Russell, Renee M. Dwyer, Michelle A. Keske, Stephan Rattigan. Forearm blood flow
distribution in healthy controls and T2D: Effect of exercise training.
Posters at conferences
The Physiological Society (UK) Annual Meeting. London, England, UK. July 2014. Sarah J. Blackwood,
Eloise A. Bradley, Renee M. Dwyer, Stephen M. Richards, Michelle A. Keske and Stephen Rattigan. New
xiv Pulse of Asia. Seoul, South Korea. September 2016. Rachel E. Climie, Dean S. Picone, Sarah J.
Blackwood, Ahmad Qasem, Steven Rattigan, James E. Sharman. First evidence of pulsatile pressure
interaction between the macro-vasculature and micro-vasculature: proof-of-concept by association
with kidney dysfunction among patients with type 2 diabetes.
ARTERY16. Copenhagen, Denmark. October 2016. Rachel E. Climie, Dean S. Picone, Sarah J.
Blackwood, Ahmad Qasem, Steven Rattigan, James E. Sharman. First evidence of pulsatile pressure
interaction between the macro-vasculature and micro-vasculature: proof-of-concept by association
1
2 Vascular delivery of nutrients and hormones is normally tightly coupled to the metabolic demands of
the supplied cells, and has been investigated in tissues including the brain, heart, skin and skeletal
muscle (1). In mammals, skeletal muscle makes up a high proportion of body mass (30-40% of body
(2)) and has the potential to be highly metabolically active, which has major implications for the
cardiovascular system. It is therefore critical that blood flow changes with skeletal muscle metabolic
demand to efficiently couple nutrient delivery and waste removal with the function of the tissue (3).
Blood flow is minimised when metabolic demand is low, in order to prevent excess circulatory demand
(cardiac output), but must have the capacity to support the significant rise in oxygen consumption and
nutrient utilisation for fuel production in the myocytes during exercise when the work load and
thereby metabolism is greatly enhanced (4). Additionally, there are other stimuli which cause skeletal
muscle metabolism and blood flow requirements to change, for example, when muscle is storing
nutrients derived from diet (i.e. glucose) (5, 6). Meeting increased metabolism with sufficient blood
flow to the working tissue occurs through both systemic and local mechanisms.
The capillary recruitment theory indicates that at rest when nutrient demand is low, blood flow can
be reduced by intermittently perfusing fewer of the available capillaries; however, to keep nutrient
delivery adequate to all myocytes the sets of perfused capillaries must be continually varied. This is in
part achieved through vasomotion, a function of the vasculature that involves the rhythmical
oscillation of blood vessel diameter to allow or restrict blood flow through individual vessels (7, 8).
The physiological consequence of vasomotion is flowmotion, which is the rhythmical oscillation and
variation of flow through tissue (7, 9). Vasomotion and flowmotion have been observed in skeletal
muscle during rest, and has been seen to change in response to insulin (10, 11). Vasomotion has also
been seen in other tissues in the body such as the skin and subcutaneous tissue (skin+SC) (12). It is
suspected that these processes are critical for the efficient matching of nutrient and oxygen delivery
to demand. Demonstration of how vasomotion and flowmotion affect metabolism, and how they are
3 Flowmotion can be assessed by techniques that are commonly used to measure blood flow through
regions of tissues whereby blood flow data are collected constantly over time, (e.g. Laser Doppler
Flowmetry [LDF]). These techniques can be used to assess changes in skin+SC or skeletal muscle
flowmotion in response to the infusion of insulin or other vasoactive molecules, and in disease states
such as insulin resistance and type 2 diabetes (T2D). The purpose of the studies in this thesis was to
develop methods for the assessment of flowmotion; to investigate normal patterns of blood flow in
both human participants (skin+SC) and animal models (skeletal muscle), and to assess the changes
that occur in T2D.
1.1 Vascular structure
The body’s vasculature is composed of three types of vessels; arteries, capillaries and veins. The
arterial system consists of larger conducting arteries that move oxygenated blood from the heart to
the tissues; these are comprised of an endothelial layer, layers of smooth muscle, and many elastic
connective tissue fibres. The larger arteries branch into smaller arterioles which carry blood
throughout organs into capillaries. Arterioles are known as resistance vessels and consist of an
endothelial layer, connective tissue, and a thick layer of smooth muscle. Capillaries are comprised only
of an endothelial layer, which aids their role in nutrient exchange at the cellular level as it allows for
the diffusion of select nutrients out of the blood into the tissue and vice versa (13). The arrangement
of arterioles in rodent cremaster, soleus, and extensor digitorum longus muscles has been described
by Sweeney and Sarelius (14) and Williams and Segal (15). These studies show that blood enters the
muscle through a feed artery classified as a 1st order arteriole, which then branches into smaller
vessels (numbered in increasing order). 3rd order arterioles transverse the muscle tissue and 5th order
arterioles lead into the capillaries. The capillaries are arranged in groups known as modules, which
consist of approximately 15 capillaries that arise from each 5th order arteriole. A group of modules
4 Figure 1.1: Skeletal muscle microvasculature. Adapted from Boron and Boulpaep 2003 (13).
The prevailing theory indicates that blood flow to the whole muscle (often referred to as bulk or total
flow) is controlled by constriction and dilation of the 1st-3rd order arterioles, whereas flow to the
individual capillary networks is controlled by the 3rd-5th order arterioles (16). A number of animal and
human studies indicate there is intermittent and heterogeneous movement of blood through the
skeletal muscle tissue, differing in both spatial and temporal structure of flow (17-19). It appears that
a rhythmic oscillation of arteriole diameter (vasomotion) occurs at regular intervals so that different
capillary modules are perfused at different times (20, 21). It has been proposed that at any one time
not all capillaries in the muscle tissue are perfused (14, 22) and that control of this blood flow is tightly
linked to changes in metabolic demand and other stimuli such as increased work during exercise or
after a meal (23). Further to this, it is proposed that within skeletal muscle two different capillary
routes exist and changes in distribution between these two pathways may be a means to minimise
blood nutrient utilisation during rest, while also maintaining the ability to meet increased demands
when they arise (24).
First alluded to by Pappenheimer in 1941 (25) using constant-pressure perfused canine gastrocnemius
muscle and then later extensively investigated by Clark et. al. (3, 5, 23, 24) with the constant-flow
perfused rat hindlimb is the idea that the skeletal muscle contains two different capillary networks,
5 networks run parallel to each other in skeletal muscle vasculature, with flow distribution within each
changing based on metabolic demand. Structural studies of skeletal muscle vasculature support this
concept of two separate blood flow routes running parallel to each other (26, 27). Clark et. al. (24)
propose that the nutritive flow route consists of longer tortuous capillaries which wrap around muscle
fibres, thereby providing a large surface area for nutrient exchange between myocytes and blood. The
non-nutritive pathway, believed to consist of lower resistance, shorter and wider capillaries (28), is
thought to act as a shunt through the skeletal muscle tissue. A proportion of the non-nutritive
capillaries are thought to supply connective tissue such as septa and tendons (29), as well as
adipocytes within the tissue (30). Clark and colleagues surmised that in vivo the non-nutritive flow
route in skeletal muscle may act as a flow reserve which can be rapidly redistributed to the nutritive
flow route in response to increased metabolic demand (24). The redistribution of blood into the two
different flow routes in vivo is proposed to be an important component in the regulation of muscle
nutrient utilisation. This allows conservation of nutrient and oxygen supply during rest, while
maintaining the ability of muscle to meet increased demands in response to stimuli such as
contraction (5, 24). It should be noted that the nutritive and non-nutritive capillary theory is not
universally accepted, other theories indicating homogenous capillary structure and continuous
perfusion of all capillaries do exist (31) and these theories have been subject to debate in the literature
(32, 33).
1.1.2 Capillary perfusion
According to the capillary perfusion theory (which is postulated to accurately reflect true
microvascular flow (32)), in skeletal muscle at rest, only a proportion of capillaries are believed to be
perfused at any one time (14, 22), with a constant change in the regions perfused occurring via
vasomotion (20, 21). During times of increased metabolic demand such as during exercise or after a
6 increased. However, the major alternative theory states that there is continuous perfusion of all
capillaries at all time and that only the haematocrit becomes altered when demand is changed (31).
The mechanisms through which this increase in perfusion occurs may vary depending upon the stimuli.
Increased capillary perfusion occurs via dilation of terminal arterioles (4th-5th order), allowing blood
flow through previously quiescent capillaries, a process known as microvascular recruitment (or
capillary recruitment) (6, 34, 35). Greater distribution of flow into the capillaries can occur with or
without the increase in total flow to the muscle, controlled by feeder (1st-3rd order) arterioles (16).
Total blood flow is the bulk volume of blood moving through main arteries into the muscle tissue as a
whole, as distinct from capillary perfusion, which refers to the distribution of the blood within the
muscle capillaries. It is thought that because of the two different flow routes in muscle, capillary
perfusion can change and increase without necessarily requiring a change in total blood flow (36).
Coggins et. al. (37) looked at changes in total blood flow and microvascular perfusion in the forearm
during a 4-hour infusion of physiological levels of insulin (0.05mU/kg/min). This showed an increase
in microvascular perfusion which occurred without a significant increase in total flow to the forearm,
thereby demonstrating that distribution of blood within skeletal muscle tissue can be altered without
changing the total amount of blood delivered into the muscle.
Experiments looking at the vascular control by insulin may have great importance in elucidating the
true behaviour of blood flow through muscle. Commonly, the euglycemic hyperinsulinemic clamp,
where constant insulin infusion is coupled with variable glucose infusion to stabilise blood glucose
levels, is used to assess insulin action within the body. Studies involving infusion of insulin affect the
whole body and allow assessment of partial changes in blood flow within muscle, unlike studies
utilising contraction to assess blood flow behaviour which is a more isolated effect and generally
results in large changes in blood flow. Utilising techniques which assess capillary perfusion, rather than
7 is able to alter blood flow distribution within the tissue, an action that has been linked to increased
glucoses uptake in human (38, 39) and rat (36, 40, 41) studies.
1.1.2.1 Techniques to measure capillary perfusion
A number of techniques exist to measure the change in total flow as well as capillary perfusion.
Changes in bulk blood flow have been investigated using thermodilution (42, 43), dye dilution (44),
plethysmography (45, 46), positron emission tomography combined with [15O]H
2O (47), and
2D-ultrasound (48). However, these techniques only give an insight into the total amount of blood moving
through the skeletal muscle tissue (total/bulk flow), via conducting and feed arteries, and not how
that blood is distributed between capillaries. Importantly, there are a number of techniques which
can be used to look at changes in microvascular perfusion alone (assessing the number of capillaries
which are perfusion at any one time), independent of changes in bulk blood flow (48).
A commonly used technique to measure microvascular flow is laser Doppler Flowmetry (LDF). LDF is a
measure sensitive to both the velocity and number of red blood cells (RBC) within the vasculature,
with the resulting LDF signal (measured as flux) being proportional to the tissue perfusion (49). LDF
probes can be placed onto the skin or into tissue and consist of fibre optic cables that direct a laser
light (700-800nm) into the tissue. As the RBC move through vessels in the illuminated section of tissue
they interact with the laser to create a scatter pattern with a frequency change according to the
Doppler effect. Sensitive photo detectors in the collecting optic fibre of the LDF probe then measure
the scattered light and frequency shift (50-52). The resulting signal gives an indication of the number
and speed of RBCs in the tissue that is being illuminated by the laser. However, the use of LDF to assess
capillary perfusion is limited by a number of factors. LDF is only able measure blood flow in the specific
region of tissue illuminated by the laser, and as such cannot be used to determine whole tissue blood
flow (49). The flow measured in the area illuminated may differ to that of other regions of the tissue.
8 placed in a section of the non-nutritive flow route, the flow rates indicated by LDF measurements will
differ from the flow-rates in another region of muscle where the nutritive pathway predominates.
Additionally, in the assessment of skeletal muscle flow, the inability of the LDF laser to penetrate
beyond the skin and subcutaneous tissue (skin+SC) has limited its use in assessing blood flow within
deeper tissues such as skeletal muscle. The problems with the power of the laser can be overcome by
removing skin and other superficial tissues and placing the probe directly on the muscle, or more
recently, using high power LDF probes that can potentially penetrate into the muscle when placed on
the skin. Previous studies have generally focused upon the change in the averaged LDF signal value
during interventions (53, 54). The average measure gives an overall indication of microvascular blood
flow status of the tissue sampled and if blood flow may have become altered during disease, but not
an in-depth assessment of underlying changes in blood flow function that may be occurring. To give a
greater insight into the control of microvascular blood flow patterns and to identify what specific
changes in microvascular blood flow behaviour may be occurring during diseases such as T2D,
mathematical modelling can be applied to the LDF data to analyse different aspects of the signal.
These include spectral analysis such as Fourier analysis or wavelet transformation which determine
different frequencies in the signal (55-57) and complexity measures which assess the randomness of
the LDF flux (58, 59).
Interestingly, recent advances in technology have produced combined LDF flux and tissue oxygenation
probes (LDF + OXY probe), which can measure LDF flux, oxygen saturation (O2 Sat) and total
haemoglobin (tHb) concurrently at the same site. However, the different light sources for each
measurement type may have different penetration into the tissue, as such these different measures
are detecting blood flow in different volumes of tissue (60, 61). The oxygenation of tissue (O2 Sat) and
total number of RCB (tHb) can be measured and analysed in the same manner as LDF flux to give a
more holistic assessment of microvascular perfusion. O2 Sat and tHb measures are taken with white
9 wavelengths, which is then detected by photosensors in the probe and recorded (62). Kuliga et. al.
(63) validated the novel combined LDF flux and white light reflectance spectroscopy sensor probe. LDF
+ OXY measurement of forearm microvascular blood flow in healthy participants were assessed. The
result showed that resting skin+SC O2 Sat is independently associated with blood flow and skin
temperature, with the relationship between blood flow and O2 Sat best described by a one-phase
association curve fit with a plateau in O2 Sat of 84%. The study concluded that the tissue oxygenation
measures are able to detect similar skin+SC microvascular blood flow as LDF flux, but through
measurement of different parameters. The use of the combined LDF + OXY probe gives a platform for
a more in-depth investigation of microvascular blood flow under different metabolic and disease
conditions.
1-MX metabolism is a biochemical technique used to determine the microvascular perfusion in rat
skeletal muscle (48). It has an advantage over LDF as it can assess whole tissue microvascular
perfusion. This technique relies upon the presence of the enzyme xanthine oxidase (XO) on the surface
of all capillaries in skeletal muscle tissue. XO can metabolise 1-MX into one product, 1-methylurate
(1-MU). The difference between the amount of 1-MX infused into the rat skeletal muscle and the amount
of 1-MU in the venous blood, measured by high performance liquid chromatography, gives an
indication of microvascular perfusion. The 1-MX metabolism technique essentially looks at the total
surface area of microvasculature within the muscle through which the blood passes. With greater
microvascular perfusion, the blood is exposed to a greater surface area of the microvascular
endothelium, and thereby greater metabolism of 1-MX occurs (48). Studies of 1-MX metabolism in the
constant-flow perfusion hindlimb, where the perfusion rate was altered to give more or less total flow
into the muscle, have shown that 1-MX metabolism is not significantly changed with changes in muscle
flow rate, verifying that this technique is a measure of flow redistribution alone (5). There are,
however, limitations to this technique, as it is an indirect measure of microvascular perfusion, and it
10 insufficient for the assay, due to inadequate levels of XO (64). Additionally, 1-MX metabolism cannot
look at changes in microvascular perfusion in real time, only giving an average value for a time period
(usually 60mins) (48). The 1-MX technique is therefore unsuitable for the assessment of flowmotion,
which requires continuously collected data for spectral analysis.
Contrast enhanced ultrasound (CEU) is another means of measuring microvasculature blood flow. It
has an advantage over 1-MX metabolism as it can monitor real time changes in microvascular
responses in the tissue of both rats (40) and humans (65), however it is a more invasive measure as
compared to surface LDF. CEU allows visualisation and quantification of blood flow through a specific
tissue region of interest (ROI). Ultrasound uses sound waves to visualise regions of the body. Within a
specific ROI, contrast agents (which are infused into circulation) can be visualised as each sound wave
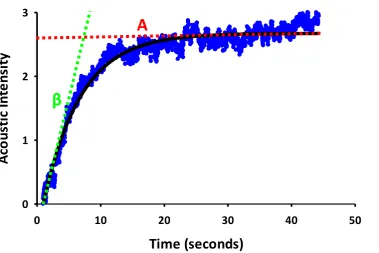
emitted from the transducer results in an acoustic signal produced by the contrast agent (66). Gas
filled phospholipid bubbles, known as microbubbles, are commonly used as contrast agents in animal
and human experiments. The phospholipid microbubbles are introduced into the vasculature via
constant venous infusion and travel in the blood. They are on average 4μm in diameter, constraining
them to the vasculature and allowing them to travel in a similar manner to RBC (67). The acoustic
intensity (AI) of microbubbles that are within the microvasculature can be detected. The AI signal is
proportional to the concentration of microbubbles within the ROI, therefore when the arterial
concentration of microbubbles is constant the AI is related to the blood volume. By imaging a muscle
and measuring its AI signal, an indication of blood volume can be determined. CEU is able to track
changes in blood volume in real time, and can be used to detect differences in microvascular perfusion
with different treatments. Vincent et. al. (41) showed total blood flow (measured with an ultrasonic
flow probe placed around the femoral artery) and microvascular blood volume (measured by CEU),
were monitored during a euglycemic hyperinsulinemic clamp with physiological levels of insulin
(3mU/kg/min) in an anaesthetised rat hindlimb. There was a rapid increase (55% 5-10min into insulin
11 the total blood flow to the hindlimb. The observed increase in microvascular blood volume indicates
that microvascular perfusion has been increased by insulin, independently of change in total blood
flow to the hindlimb.
The minimally invasive nature of the LDF + OXY and CEU techniques is believed to more likely produce
observations of true, non-artificial blood flow changes in muscle, thus eliminating any potential
changes in blood flow that can be caused by experimental intervention. These techniques also allow
the assessment of blood flow through the large load-bearing muscle which makes up the majority of
skeletal muscle tissue in the body. An additional advantage is that blood flow analysis utilising these
minimally invasive techniques can be performed in both animals (36, 48, 68) and humans (65),
combined with measurements of total blood flow, allowing a more holistic assessment blood flow
physiology.
Table 1.1: Summary of microvascular blood flow techniques advantages and disadvantages.
Technique Advantages Disadvantages
LDF + OXY Real-time measurements
Skin measures non-invasive and easy to perform RBC number and tissue oxygenation combined Animal and human applications
LDF flux measures RBC number and velocity
Small tissue section
Invasive to measure deeper tissues
1-MX Whole tissue measurement
Assessment of microvascular surface exposure Measure of flow redistribution alone
Cannot be used in humans Not real-time
Indirect measure CEU Real-time measurements
Animal and human applications Non-invasive to muscle
Able to measure large load bearing muscles Large tissue sections
Measure of microvascular blood volume alone
12 Techniques to assess muscle blood flow directly do also exist, but are inherently more invasive.
Intravital microscopy is a common method used to directly observe many different biological functions
in vivo, including blood flow in skeletal muscle tissue (69-71). Using this technique, muscle in a live
sedated animal is surgically exposed, and a high resolution microscope is used to directly observe
blood flow patterns in the muscle. Intravital microscopy is generally used to assess blood flow in thin,
more specialised muscle, as they are more easily accessed (31). This is as opposed to the less invasive
techniques, which can also assess bulk load-bearing muscle (32). The technique is advantageous as it
allows for direct assessment of blood flow in the muscle tissues, however, the highly intrusive nature
of this method could potentially result in unnatural alteration of blood flow in the muscle, and thereby
not give a true representation of normal blood flow and distribution through the tissue. Additionally,
due to the surgery required, intravital microscopy cannot be used to assess human muscle blood flow.
The only assessable vascular beds for intravital microscopy in humans are the nail fold
microvasculature (12), retinal (72) and oral mucosa (73); studies of blood flow in these tissues are
unlikely to reflect muscle flow, which is the primary tissue of interest when assessing metabolism and
vascular dysfunction during disease. Each method used to assess in vivo muscle blood flow has
inherent flaws, and as such the use of multiple and different techniques may be the best approach to
the assessment of skeletal muscle blood flow.
1.1.2.2 Alternative skeletal muscle blood flow hypotheses
In 1917 Krogh (74) first proposed the idea of capillary perfusion from observations made in
experiments where dye was passed through muscle microvasculature. Krogh noted that not all
capillaries in the tissue gave passage to the dye and hypothesised that in the vasculature there is a
reserve of unperfused capillaries, a concept that is still believed to hold true by many microvascular
researchers (5, 6, 75). However, there are other theories as to how blood flow acts and changes in
13 of capillary recruitment and through their study of blood flow at rest and during contraction suggest
an alternative hypothesis. Poole et. al. propose that instead of only a proportion of capillaries being
perfused any one time during rest, all capillaries within a tissue support plasma flow and almost all
RBC flux, at all times. It is proposed that the haematocrit in capillaries is altered upon changes in
metabolic demand within the muscle tissue (from 15% to 45%) (31). The manner in which the different
components of blood interact with the vessel wall is theorised to allow for this change in haematocrit.
During rest molecules on the vessel wall interact and hold up RBC but not the plasma and upon
stimulation by increased metabolic demand (i.e. exercise) the RBC are released and haematocrit
subsequently increases. Additionally they propose that ‘longitudinal recruitment’ occurs where the
capillaries extend in length upon increased metabolic demand, to increase surface area on which
exchange can take place (31). Poole et. al. based their hypothesis upon studies mostly done using
intravital microscopy of thin more specialised muscle which is observed at ‘basal’ and then under
electrical stimulation to induce contraction (76). The manner of these studies highlights potential
issues with the resulting hypothesis that RBC concentration increases in capillaries during contraction,
not whole blood flow. It is likely that the invasive nature of the techniques itself used by Poole et. al.
may result in capillary recruitment and that ‘basal’ measurements of capillary RBC content may not
be accurate. Questions are also raised about how haematocrit is able to dynamically change in a closed
system. Additionally, Poole et. al. focus upon changes which result from contraction and mention little
about the changes induced by insulin – such as increased glucose uptake (which travels in the plasma)
resulting from an increased capillary flow (6) – or vasomotion within muscle vasculature (77), two key
processes in the overall behaviour of blood flow in skeletal muscle.
1.2 Vasomotion and flowmotion
Vasomotion is the rhythmic oscillation of vasculature diameter (7, 8, 78) which occurs in many, if not
14 within tissues; flowmotion (9). Vasomotion and the subsequent flowmotion which occurs are thought
to be an important component in the distribution of blood flow within tissues such as muscle and
skin+SC. Vasomotion was first described over 150 years ago by Jones (1852) (79), who observed
rhythmical changes in vessel diameter in bat wings. Many in vivo and in vitro studies have since
reported the presence of vasomotion (80). Studies of vasomotion and flowmotion have been
conducted upon a number of different tissues including the testes (81), mesenteric vasculature (11),
skin (82) and skeletal muscle (57), indicating a widespread occurrence throughout the body.
Vasomotion is thought to be generated locally from within the vascular wall, not from systemic
mediators such as heart beat, respiration or nervous system input; though synchronisation of
vasomotion has been reported to occur through neurogenic input (83, 84). Studies by Colantuoni et.
al. (85-88) using the hamster skin-fold window preparations show that the frequency of vasomotion
is greater in smaller arteries, thus terminal arterioles have higher occurrence of vasomotion when
compared to higher order arterioles. Additionally, experimental conditions may affect the study of
vasomotion with varied reports of the presence of vasomotion in animals observed during rest, both
with or without anaesthetic (10). Importantly, in human studies the presence of vasomotion and
flowmotion has consistently been observed during and without anaesthesia (82, 89, 90). The study of
vasomotion since its discovery in 1852, has been difficult due to the limited techniques with the
appropriate sensitivity available to observe and measure vasomotion. There are two fundamental
questions regarding vasomotion which are yet to be fully answered. 1) What are the cellular
mechanisms that produce vasomotion and 2) what is the physiological role of vasomotion?
The physiological consequence of vasomotion, flowmotion, is in contrast relatively easy to detect and
has been assessed using techniques such as oxygen tension measures, local blood pressure measures,
and LDF (81, 90-93). Importantly, flowmotion is not only controlled by vasomotion but is also
influenced by the central factors; cardiac, respiratory and neurological activity. Five different
15 These distinct frequencies correspond to the above factors (10, 11, 94) and have been identified in
vivo using LDF (90, 91, 95-98), oxygen tension measures (99) and through direct observation (92, 100).
Two of the oscillating bands occur at higher frequency and originate from cardiac (0.4-1.6Hz) and
respiratory (0.15-0.4Hz) input (the range of these frequencies are increased in rats due to higher
respiratory and heart rates). The other three factors are present at lower frequencies and through
pharmaceutical intervention it has been established that the mechanistic backgrounds for each is
intrinsic smooth muscle activity (myogenic, 0.06-0.15Hz), nervous system input (neurogenic,
0.02-0.06Hz) and vascular endothelium (endothelial, 0.0095-0.02Hz) (55, 94). Studies in vitro looking at
vasomotion in isolated small arteries suggests that the myogenic frequency of flowmotion at
0.06-0.15Hz seen in vivo is due to vasomotion (11). It is also thought that the endothelium has a role in the
control of vasomotion as vessels stripped of their endothelial layer show an inhibition of vasomotion
that can be rescued by application of endothelial derived agents such as nitric oxide (NO) (10).
1.2.1 In vivo measurement of flowmotion
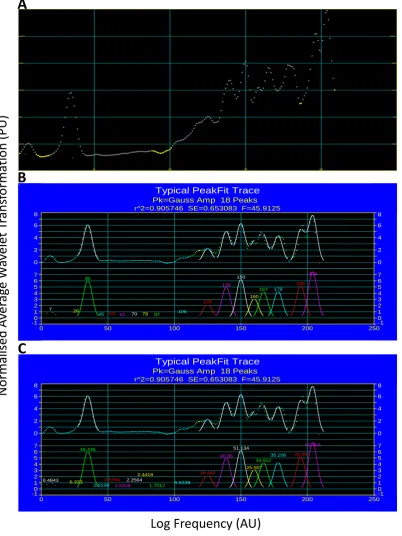
In the 1990’s Stefanovska et. al. (55, 56, 96) showed that the contribution of different frequency
components of flowmotion could be revealed by mathematically transforming skin+SC LDF flux data
with spectral analysis. The presence and relative input of each of the five factors influencing
flowmotion can be determined by performing the mathematical transformation on raw LDF data.
Spectral analysis applies a mathematical equation to the LDF data, which is expressed as perfusion
units (PU) verses time, and transforms the data into average wavelet transformation (PU) verses
frequency (Hz) (101, 102). LDF is unable to measure blood flow in absolute perfusion values, the PU
measurements are therefore an arbitrary, relative measure of flux. It is therefore essential that LDF
probes are correctly calibrated before measures are taken to enable comparison of results. A peak
representing each of the five influencing factors is then able to be identified. Fast Fourier analysis and
16 data. Wavelet transformation is considered advantageous over fast Fourier analysis as it allows a more
precise determination of the lower frequency components of a signal (103). As described by
Stefanovska et al. (55), wavelet transformation also takes time into consideration, producing a 3D
output with wavelet transformation, frequency and time considered (Figure 1.2A). The temporal
information provided by performing a wavelet transformation indicates the variance of the signal and
how often a modulating factor exerts its influence over blood flow. For example, the endothelial
component which influences blood flow at a lower frequency has a great variation over time as the
oscillating signal only occurs at 50-105 second intervals. The cardiac component however, exerts its
influence at a much higher frequency, therefore there is less variation as the oscillations occur at
0.6-2.5 seconds. In most biological circumstances, the wavelet transformation is averaged over time to
give a 2D measure of wavelet transformation against frequency (Figure 1.2B), allowing easier handling
and interpretation of the complex data. The averaging of wavelet transformation data over time for
the interpretation of flowmotion patterns results in the loss of temporal information. In the context
of the data described in this thesis, the temporal data is only of importance in the consideration of the
time period on which the wavelet transformation is performed. To adequately measure the influence
of the lower frequency components on flowmotion longer periods of time (20min or more) need to
be used to overcome the variance in the signal and obtain an accurate reading of the endothelial
17 Figure 1.2: Wavelet transformation of human skin LDF signal. Figure taken from Stefanovska et al. (55) (Figure 2) demonstrates the A) 3D output of wavelet transformation where average transformation (Z axis), frequency (X axis) and time (Y axis) are all taken into consideration. Data is averaged over time to give B) 2D average wavelet transformation against frequency for easier interpretation of data.
By applying a normalisation calculation to the average wavelet transform values – achieved from
wavelet transformation of LDF flux data – the relative contribution of each frequency to flowmotion
can be established. A calculation to establish the relative contribution of each frequency allows the
changes in flowmotion that are induced by interventions such as insulin infusion to be established.
Wavelet transformation of LDF flux data provides an effective means of determining overall
flowmotion patterns and the contribution of each frequency component within this. However, the use
of LDF flux to assess flowmotion is limited in that it can only assess blood flow in one small section of
a tissue. Flowmotion is the oscillation of flow across a whole tissue and it may be blood flow in
different sections of the same tissue differ. LDF does not allow adequate investigation into the idea of
varied flow distribution across a tissue. To overcome this limitation, the same analysis technique
(wavelet transformation) could be applied to blood flow measurement techniques that assess flow
A
18 over larger regions of tissue (i.e. CEU), which can be performed on both animal models and human
subjects.
In order to understand and interpret changes in flowmotion observed by wavelet transformation; it is
first important to understand the cellular mechanisms through which flowmotion is controlled.
1.2.2 Cellular mechanism of vasomotion
1.2.2.1 Myogenic input
The myogenic input is often itself called vasomotion as it is the intrinsic contraction within the vessel
smooth muscle per se. The cellular mechanisms in the smooth muscle which bring about vasomotion
and the mediators which induce these mechanisms have been previously investigated, but are still not
fully understood. The majority of investigations into the mechanism of vasomotion have been done
with intravital microscopy and isolated larger arteries using various agonists and inhibitors of
vasomotion (reviewed by Aalkjaer and Nilsson in (10, 11)). It is thought that two important processes
induce vasomotion in arteries; firstly, generation of Ca2+-dependent oscillators within smooth muscle
cells, which induces cellular depolarisation and secondly, synchronisation of that depolarisation
between the smooth muscle cells (10). Oscillators within the smooth muscles cells are thought to be
generated from cytosolic and membrane actions (80, 104). Vasomotion is thought to be initiated by
release of cellular stores of Ca2+ (from sarcoplasmic reticulum) into the cytosol by cytosolic oscillators
(105, 106). Vasomotion is only established when intercellular Ca2+ release is formed into synchronised
waves (106-108). Prominent vasomotion researchers Aalkjaer and Nilsson hypothesise that the
membrane oscillators induce the intracellular synchronisation (109-111). The waves of Ca2+ within the
smooth muscle cells are believed to induce activation of many Ca2+-dependent membrane bound ion
channels such as Cl- and K+ channels (112-115). Activation of these membrane channels is believed to
19 by Bartlett et. al. (116) showed an abolishment of vasomotion in hamster cheek vasculature upon
blockade of K+ channels, indicating the importance of membrane K+ channels in the activation of
vasomotion through cellular depolarisation. It is proposed that in order for vasomotion to occur in a
whole vessels, a synchronisation of the oscillating depolarisation between smooth muscle cells is
required (10). The depolarisation initiated through generation of Ca2+ waves within cells can be
propagated to the surrounding smooth muscle myocytes via gap junctions, forming an electrical signal
(reviewed in (10)). Through the gap junction mediated synchronisation of cellular depolarisation,
vasomotion in a vessel is believed to occur. Matchkov et. al. (117) used gap junction inhibitors on
isolated rat mesenteric arteries to show a desynchronisation of membrane potential oscillations
between vessel smooth muscle cells, which resulted in an inhibition of vasomotion. The
desynchronisation of membrane potential oscillations was shown to occur without effecting Ca2+
waves within individual smooth muscle cells of the isolated arteries, indicating an inhibition in the
synchronisation required to produce vasomotion, not the cellular mechanism involved. The
observations by Matchkov et. al. (117) has been repeated in other studies which utilise gap junction
inhibitors (117-120). These studies have formed the idea that gap junction mediated synchronisation
of the Ca2+-dependant depolarisation is essential for induction of vasomotion in a vessel. While there
are many studies outlining the possible mechanisms through which vasomotion occurs, the question
of what induces these actions within the smooth muscle cells to bring about vessel vasomotion still
remains and requires a great deal of further investigation.
1.2.2.2 Neurogenic input
Neurogenic input to flowmotion is primarily generated centrally in the brain, constantly outputting
signal to cause vasoconstriction in the smooth muscle of vessel in order to maintain a balanced
vascular tone (121). However, the effector of this process, noradrenaline (NA), acts locally at the tissue
site to induce vasoconstriction. Using skin LDF measures, Kastrup et. al. (122) demonstrated with
20 of about 0.04Hz. Neurogenic input to the skin was removed after both local and ganglionic nerve block
and after a sympathectomy. The control of vasoconstriction by the neurogenic input periodically
modulates the vascular tone of vessels and thereby influences vasomotion patterns. NA is released by
the axons of nerves, which then binds to and activates alpha1-adrenoceptors on the vessel smooth
muscle to result in increased intracellular Ca2+. Increases in intracellular Ca2+ causes contraction of the
myocytes and thereby vasoconstriction (123, 124). Under basal situations, neurogenic input to
vascular smooth muscle is constant to produce a basal level of vasoconstriction in order to maintain
normal blood pressure (121). However, neurogenic control can be more complicated and response to
neurogenic input can vary at different vascular sites (26), likely due to the varied presence of
alpha2-adrenoceptors on vascular pre-synaptic neurons. Alpha2-alpha2-adrenoceptors modulate
alpha1-adrenoceptors mediated vasodilation through the inhibition of NA release into the synapses, thereby
inhibiting neurogenic mediated vasodilation (125). It is worth noting that NA can also be released from
the adrenal gland into circulation as a stress response (126), which may then influence the neurogenic
component of flowmotion.
1.2.2.3 Endothelial input
In addition to smooth muscle cell mechanisms, the endothelium is thought to be of great importance
in the generation of vasomotion (11). Jackson et. al. (127) used α1-adrenergic agonists to stimulate
vasomotion in isolated hamster aortas. This rhythmic activity was not simulated in vessels where the
endothelium had been removed. Jackson et. al. (127) concluded that localised mechanisms within the
endothelium were influencing and controlling the generation of vasomotion in the vessel smooth
muscle. To establish the frequency at which the endothelial component of flowmotion exerts its
effect, Kvernmo et. al. (128) performed wavelet transformation analysis of skin LDF measures during
basal, endothelial-dependent (acetylcholine) and endothelial-independent (sodium nitroprusside)
stimulation of vasodilation. During endothelial-dependent vasodilation there was a significant
21 frequency that the endothelial input exerts control over flowmotion. Several different
endothelium-derived molecules have been suggested to be important for the activation of vasomotion. Restoration
of vasomotion in hamster aorta stripped of the endothelial layer by sodium nitroprusside (SNP) and
cyclic GMP (cGMP) has also been observed by Jackson et. al. (129). The ability of SNP and cGMP
analogues to recovery oscillatory behaviour when vessel endothelium is removed suggests that the
nitric oxide (NO) system (which is initiated in the endothelium) may play an important role in
vasomotion generation. In another study by Gustafsson et. al. (130) isolated rat mesenteric arterioles
and stripped the endothelial cells, resulting in an inhibition of vasomotion, which was then restored
with the addition of the NO donor SNP and a cyclic GMP (cGMP) analogue. Additionally, high
concentrations of cGMP introduced to smooth muscle in the absence of vessel endothelial cells has
been shown to induce synchronisation of Ca2+ waves (106, 131). It appears that NO-mediated process
are important in vasomotion, but other factors such as endothelium-derived hyperpolarising factor
(EDHF) are thought to also play a role (132). Both NO and EDHF have been shown to modulate Ca2+
release in vascular smooth muscle cells (104). The release and synchronisation of Ca2+ is proposed to
be the mechanism by which vasomotion is generated (10), thereby providing a mechanistic link for
the endothelial modulation of flowmotion. The perceived importance of NO-mediated pathways in
vasomotion is perhaps an important point in understanding the physiological role of vasomotion.
Insulin induces NO production in vessel endothelium (133), and it has been shown that insulin induces
vasomotion (57). It is thought that there is a link between insulin-mediated vasomotion and
redistribution of blood flow within skeletal muscle tissue. In the current thesis, the relationship
between insulin and flowmotion will be studied more extensively in an attempt to better understand
22 1.3 Insulin-mediated changes to skeletal muscle haemodynamics and their effect on metabolism
1.3.1 Insulin-mediated changes in blood flow
The vasoactivity of insulin was first described in 1939 when schizophrenic patients were treated with
large doses of insulin (134). A bolus dose of 40-280U of insulin resulted in bulk increases in blood flow
to the leg, forearm and hand. The ability of insulin to increase bulk blood flow to skeletal muscle has
been reported in some subsequent studies (43, 45, 48, 135), but others studies have shown no change
(136-139). Differences in the outcomes of total flow studies are not only attributed to the techniques
used, but to the varied concentration of insulin employed in each case. At a relatively low dose
(75mU/mL) Kelley et. al. (137) failed to see any increase in total blood flow to the leg. However, Laakso
et. al. (43) using a euglycemic hyperinsulinemic clamp, found changes in total leg blood flow were
related to insulin dose. The study used a ramped protocol in which insulin was infused at
10mU/m2/min increasing to 600mU/m2/min and found total leg blood flow increased in a graded
fashion relating to the insulin infusion. In addition to the changes in total flow, studies in humans (65)
and rats (41, 48, 140) exploring insulin mediated distribution of blood within the skeletal muscle
capillary beds have shown that insulin causes an increase in capillary perfusion. Insulin promotes
capillary recruitment through the redistribution of blood flow amongst a greater number of capillaries,
even at lower physiological doses, prior to any changes in whole-limb flow (36). Changes in
microvascular perfusion, leading to enhanced glucose uptake occur primarily via insulin binding to the
endothelial cells of the arterioles, as opposed to acting upon the smooth muscle cells that surround
the vessel. Insulin signalling results in activation of several different pathways in the microvasculature
to alter the tone of vessels, mediating both vasodilation and vasoconstriction, with the overall vascular
23 Insulin mediates vasodilation of arterioles by inhibiting vasoconstriction in vessel smooth muscle cells.
Insulin-mediated vasodilation of the terminal arterioles is believed to induce microvascular
recruitment (6). Binding of the insulin receptor on the endothelial cells leads to phosphorylation –
therefore activation of – the endothelial form of the NO synthase (eNOS) via the phosphoinositide
3-kinase (PI3K) pathway (140-142); resulting in NO production in the endothelial cells (Figure 1.3) (143).
NO then diffuses into the surrounding smooth muscle, where it binds to and activates the enzyme
guanylate cyclase (GC). Activation of GC leads to increased production of cGMP within the smooth
muscle cells (144, 145) and allosteric activation of protein kinase G (PKG), which in turn causes
vasodilation of the vascular smooth muscle cells. PKG inhibits the actions of vasoconstrictors by
removing calcium from the cytosol and de-phosphorylating myosin light kinase (146-149), thus
preventing contraction and producing relaxation.
As can be seen in Figure 1.3, insulin binding to the receptor on endothelial cells also induces an
endothelin-1 (ET-1) dependent vasoconstriction (150, 151). Activation of insulin receptors on an
endothelial cell results in activation of the MAP-Kinase (MAPK) signalling pathway in addition the
activation of the PI3K pathway (152). Activation of the MAPK pathway stimulates the release of the
powerful vasoconstrictor ET-1 (153). The activation of ET-1 in addition to NO by insulin is important in
the regulation of skeletal muscle vascular tone, ensuring a correct balance is maintained. In healthy
24 Figure 1.3: Comparison of endothelial insulin-mediated vascular responses. Insulin induces two different pathways which effect vascular tone. The PI3K pathway leads to NO-mediated vasodilation. Activation of the MAPK pathway leads to ET-1 –mediated vasoconstriction. Overall vasculature tone results from the balances between the two pathways. Adapted from Kim et. al. (152).
Additionally, insulin is known to activate the sympathetic nervous system (SNS) (reviewed in (154)). In
healthy participants physiological concentrations of insulin have been shown to increase venous
catecholamine levels and sympathetic nerve activity (155-157). Activation of the SNS generally leads
to vasoconstriction, which is thought to oppose insulin-mediated NO vasodilation (158). There is
however, evidence of varied responses to insulin by different vessels based on their position on the
vascular tree (6, 159). With elevated SNS activity, distal arterioles have been shown to vasodilate in
response to insulin, whereas proximal arterioles have been shown to vasoconstrict (160). However,
other studies have shown that SNS activity is not involved in insulin-mediated vasodilation (161). It is
clear that the vasoactive interaction between insulin and the SNS is complex and it maybe that
different levels and regions of the vasculature controlled by the SNS respond separately to insulin,
thereby potentially altering the overall outcome of insulin stimulation at different sights in the