Version: Published Version
Article:
Kountouriotis, GK and Wilkie, RM (2013) Displaying optic flow to simulate locomotion:
Comparing heading and steering. i-Perception, 4 (5). 333 - 346.
https://doi.org/10.1068/i0590
[email protected] https://eprints.whiterose.ac.uk/ Reuse
Unless indicated otherwise, fulltext items are protected by copyright with all rights reserved. The copyright exception in section 29 of the Copyright, Designs and Patents Act 1988 allows the making of a single copy solely for the purpose of non-commercial research or private study within the limits of fair dealing. The publisher or other rights-holder may allow further reproduction and re-use of this version - refer to the White Rose Research Online record for this item. Where records identify the publisher as the copyright holder, users can verify any specific terms of use on the publisher’s website.
Takedown
If you consider content in White Rose Research Online to be in breach of UK law, please notify us by
Georgios K. Kountouriotis
Institute of Psychological Sciences, University of Leeds, Leeds LS2 9JT, UK; and Institute for Transport Studies, University of Leeds, Leeds LS2 9JT, UK; e-mail: [email protected]
Richard M. Wilkie
Institute of Psychological Sciences, University of Leeds, Leeds LS2 9JT, UK; e-mail: [email protected]
Received 31 January 2013, in revised form 4 June 2013; published online 26 June 2013.
Abstract. Optic low can be used by humans to determine their direction of heading as well as
controlling steering. Dot-low displays have been widely used to investigate these abilities but it is unclear whether photorealistic textures would provide better information for controlling high-speed steering. Here, we examine the accuracy of heading judgements from dot-low displays of different densities and luminance and then compare to a scene containing a textured ground. We then examine steering behaviour using these same displays to determine whether accurate heading conditions necessarily equate to successful steering. Our indings suggest that the bright dense dot-low displays led to equivalent performance as the ground texture when judging heading, and this was also true when steering. The intermediate dot-low conditions (with fewer and faded dots) revealed that some conditions that led to accurate heading judgements were insuficient for accurate steering. It seems, therefore, that heading perception should not be considered synonymous with successful steering control, and displays that support one ability will not necessarily support the other.
Keywords: optic low, locomotion, heading, steering, dot low, texture.
1 Introduction
Controlling locomotion is a fundamental human behaviour. Moving through the world is crucial for survival since it allows an animal to explore its environment to ind food, shelter and a mate, whilst avoiding predators. Vision is of particular importance for humans during locomotion because it informs
the rapid execution of motor commands that will ensure successful steering. Gibson (1958, 1986)
pro-posed that optic low is the predominant source of visual information for guiding locomotion. Moving through an environment that contains textured surfaces causes an optic low pattern of relative motion that is information rich. Gibson’s proposal was that an animal can use the focus of expansion (FoE) of the low ield (the point from which radial low emanates) to “see where he is going” (Gibson, 1958,
p. 187). Under this proposal, steering control would be executed by aligning the FoE with the desired direction of travel. Though elegant in its simplicity, this control solution does not capture the complex-ity of real-world locomotor control in humans. One problem is that humans use eye movements to sample visual information from the scene; this adds rotation components to the optic low pattern at the back of the eye (retinal low). This rotation causes the FoE to be displaced from the current direction of heading (Regan & Beverley, 1982; Royden, Crowell, & Banks, 1994; Warren & Hannon, 1988), which
means that it is not directly available to inform steering.
There is still debate about how exactly optic/retinal low is used by humans to control locomo-tor steering. Some suggest that heading can be retrieved from low through the use of decomposition algorithms (Longuet-Higgins & Prazdny, 1980) so the information contained within optic low is
suf-icient to partial out the rotation components caused by eye movements. Others propose that extra-retinal information about eye movements is necessary to decompose low (Crowell, Banks, Shenoy, & Andersen, 1998; Royden, Banks, & Crowell, 1992), see Lappe, Bremmer, and van den Berg (1999) for a review of the literature. These investigations have been aided greatly by the use of computer-generated displays that create simulated environments where the properties of the world can be pre-cisely controlled and characteristics of the visual scene manipulated. The irst computer-generated scenes were very simple because of processing constraints; a series of frames containing a number of single white pixels on an otherwise black screen, which when displayed in sequence created apparent “dot-low.” Early experiments relied upon rigorous psychophysical methods to precisely measure the
sensitivity of the human visual system to various low patterns, but there was no capability to interact with the information contained in the display (as would be the case when actually steering). Instead, the standard task involved participants viewing the motion stimulus and then making a judgement of heading direction. Even though computer processors and graphics cards have improved to allow the generation of large ield of view high-idelity interactive displays (that are far more compelling than early simulations), many researchers still use dot-low displays combined with heading judgements because of the level of control provided by these methods. The number, size, luminance, distribu -tion, and lifetime of dots can all be independently manipulated in order to control the quality of low information provided to the viewer in a quantiiable way. A variety of environments can be simulated: from a single ground plane through to dot-clouds and other stimuli that rarely occur in the real world. Such conditions allow researchers to probe the underlying characteristics of low perception to exam -ine what information the human visual system is sensitive to, in order to better understand the neural mechanisms underlying visual processing during self-motion (Wall & Smith, 2008).
Many of these manipulations are dificult (if not impossible) to replicate using photorealistic bitmapped textures (from here on called simply “textures”) but some researchers prefer textures in order to examine visual conditions similar to those experienced in the real world. Dot-low is rarely encountered by humans in natural settings,1 and while this does not mean that it cannot be used to draw valid conclusions regarding human motion perception, it seems sensible to ensure that indings from dot-low also translate to more realistic textures. One of the issues that can arise when compar -ing dot-low and textures is that it is non-trivial to identify the quantity of information contained within optic low. Dot-low could be considered “sparse” compared with real-world low, with only a small number of pixels changing every frame compared with a fully textured scene. Alternatively, it could be argued that the motion of high-contrast well-deined white dots on a black background causes a set of individual motion signals that would induce a stronger percept of low than the poten -tially blurred, low-contrast and variable visual information gained from egomotion through some real environments.
Although the quality and quantity of optic low might intuitively seem crucial for the effective control of locomotion, this is not always evident in the literature examining heading judgements. Warren, Mestre, Blackwell, and Morris (1991) showed that humans are capable of judging heading when travelling along curved paths (circular heading) when optic low was provided by as few as two dots, and they reported that performance was similar when optic low was provided by different dot densities. Because constant circular paths were used, it is possible that these indings may not gener -alise to other curvilinear trajectories (Kim & Turvey, 1998). However, the study does suggest that a
relatively sparse low ield could provide suficient information to judge heading. This research has been followed up by Li et al. (Li & Cheng, 2011b; Li, Stone, & Chen, 2011; Li, Sweet, & Stone, 2006),
comparing not only textures and dot-low but also static versus dynamic displays (in the dynamic dis -plays, the dots have a limited lifetime). The overall conclusion seems to be that heading perception is relatively robust across displays. Much of the research investigating the use of optic low has focussed on the detection of heading; however, it is not necessarily the case that heading is always essential for the control of steering, especially when travelling on curvilinear trajectories. For example, Wann and
Land (2000) argued that successful steering can be achieved simply from retinal low and (non-visual)
extra-retinal signals without the observer having to retrieve heading direction at all. This view has been the matter of much debate (see Fajen & Warren, 2000; Harris, 2001; Rushton & Salvucci, 2001; Wann & Land, 2001; Wann, Swapp, & Rushton, 2000) and it remains unclear whether conditions that allow the perception of one’s heading will invariably support successful steering.
One of the arguments Wann and Land make against heading being essential in steering is that the heading accuracy often adopted (4.2°; Cutting, 1986) is not suficiently sensitive for the successful
control of steering. They give an example of a car travelling at 30 mph on a 4-m wide road where a heading error of 4° would result in the car leaving the lane in less than 1 s. So while heading thresh -olds as low as 0.65° have been reported (travelling at 3.8 m/s with low comprised of 63 dots; Warren, Morris, & Kalish, 1988), these igures are estimates based on a 75% correct threshold. It could be
argued that a more conservative threshold would be required for heading to be an effective input to the
1Driving along a dark road with headlights on when it is snowing can create a high-contrast dot-low pattern akin
control of steering and performance at the 95% correct level leads to heading accuracy estimates that may be insuficient for controlling steering in some circumstances (Wann et al., 2000).
Irrespective of whether heading is suficient to inform steering, it does seem that human sensitiv -ity to heading can be affected by the qual-ity and quant-ity of low (Warren et al., 1988). Most experi-ments that have compared textured ground with dot-low have done so in order to examine heading perception (e.g. Li & Cheng, 2011b). Recently, however, Li and Cheng (2011a) examined steering performance under conditions of dot-low and textured ground. They used the paradigm of steering towards an offset target at walking speeds (2 m/s). While they found that participants initiated steering responses faster when the ground had a dense texture, the inal errors were no different across differ -ent densities. In terms of the paths taken in this study, instead of following a curved path towards the target (as per Wilkie & Wann, 2003), the angle between heading and the target was rapidly nulliied in all visual conditions. This steering behaviour can be explained by the slow locomotor speed used.
Wilkie and Wann (2003) propose that a heading nulling strategy is only implemented at slow, walking,
speeds, when people can change the direction of motion rapidly (e.g. by pivoting on one foot). Because of momentum constraints, attempting to close down the target angle rapidly when running is dificult, and nigh on impossible at higher locomotor speeds, e.g. when steering a bicycle or driving a car.
The purpose of the present study is to examine low conditions simulating fast locomotor speeds. In particular, we wished to determine whether dot-low displays provide equivalent information as a photorealistic texture when making heading judgements and also when steering. The second aim is to examine whether visual displays that produce suficient information to judge heading are also adequate to control steering. To vary the quality of dot-low, displays contained a different number of dots and dots of high or low luminosity. For comparison, a rich ground texture was also used. In the irst experi -ment (Heading) participants indicated the direction of travel after a brief translation. In the second experiment (Steering) participants actively steered towards an offset target. We might expect heading errors to increase as the quality of information in the visual displays is degraded (as per Warren et al.,
1988). Crucially, comparing whether the patterns of errors are similar across the two experiments will
indicate the degree to which performance when judging heading translates to accurate steering.
2 General method
2.1 Participants
In Experiment 1 (Heading), 15 participants were tested. All but two were naïve to the purpose of the experiment. One participant was removed from the analysis after being identiied as an extreme outlier during data analysis (IBM SPSS 19.0).2 The two non-naïve participants were not identiied as outli-ers. The mean age of the participants used in the analysis was 24.5 ± 5.7 years and nine of them were males.
In Experiment 2 (Steering), 10 participants were tested. All were naïve to the purpose of the exper-iment except one. Similar to the Heading experexper-iment, one participant was identiied as an extreme outlier and removed from subsequent analysis. The non-naïve participant was not identiied as an outlier. The mean age of the nine participants used in the analysis was 26.0 ± 3.74 years and one of them was female.
All participants in both experiments had normal or corrected-to-normal vision and it was ensured that they could see all the displays before the experiments started. Participants were recruited through the Institute of Psychological Sciences, University of Leeds. Testing complied with the ethical guide-lines laid out by the declaration of Helsinki and ethical approval was given by the ethics committee of the University of Leeds. Participants gave informed consent to take part in the study knowing that they were free to withdraw at any time; all participants were debriefed at the end of each experiment.
2.2 Apparatus
A PC with Intel i7 950 (3.07 GHz) processor generated images at 60 Hz with a resolution of 1280 3 1024 pixels. Images were created using WorldViz Vizard 3.0 and were projected using a Sanyo Liquid Crystal Projector (PLC-XU58) onto a back projection screen with dimensions of 1.98 3 1.43 m. Par-ticipants sat 1 m away from this screen, making the total ield of view 89.42° 3 71.31°. A height-adjust-able racing-style driving seat was used to maintain eye height 1.20 m above the ground. Participants
2When the analysis in either experiment is carried out including the outliers, the main efects remain the same but
sat in a matt black booth so that the projection provided the only source of light. In the Steering experi -ment, a force-feedback wheel (Logitech G27) was used to control steering. Rotation of the wheel increased the rate of change of heading with a minimum step size of 0.36 deg/s. Steering changes were applied to the simulated direction of motion as though rotated on a point, with no application of vehicle dynamics. When steering, the simulated view direction (line of sight) was always aligned with the direction of travel (heading), as would be the case during normal locomotion. The control charac -teristics of steering changes therefore also apply to the view direction. The same wheel was used by participants in the Heading experiment to move a visual probe presented at the end of each trial in the direction of heading. Participants used a button on the steering wheel to record their response.
2.3 Experimental design
2.3.1 Heading experiment
Participants were seated in front of a large screen and presented with displays that simulated self-motion in an offset direction for 1.5 s at a constant speed of 13.8 m/s (approximately 50 kmh). After the motion stopped, a pointer appeared on the horizon and participants were asked to move the pointer along the horizon using the steering wheel to point to the direction of heading. They made their response by pressing a button which also started the next trial. The pointer always appeared in a ran-dom location on the horizon and the direction of the control mapping between the steering wheel and the pointer was randomly switched (sometimes a left turn moved the pointer left, and sometimes right) to remove any possibility that participants’ might use a remembered motoric response from a previous trial. Participants were given a short practice of approximately ive trials to ensure they understood the task.
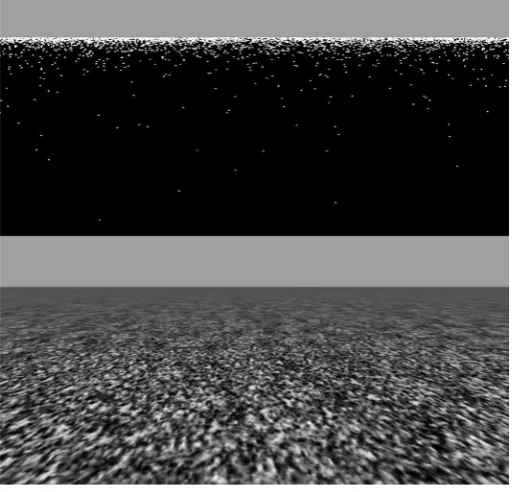
There were ive dot-low conditions with a different numbers of dots: 0.42, 1.25, 3.75, 11.25, and 33.75 dots/m2 (which equates to an approximate range of 45–3,645 visible dots on the screen at one time). Moreover, two luminance levels were used: visible and faded (where dot luminance was reduced by 75%). In addition to dot-low, a single texture-low condition was used with a photorealistic ground
texture (see Figure 1 for example low conditions).
[image:5.595.170.427.498.744.2]Three different offset angles where used for simulated heading direction, at 10°, 14°, and 18° at either side of the centre of the screen. The viewing direction remained constant and was decoupled from the direction of travel (otherwise the centre of the screen would always have been the direction
Figure 1. Example display for the denser dot-low condition (33.75 dots/m2) in the upper panel and the photorealistic
of heading). A jitter of ±1° was added to each heading direction, to minimise learning of the particular heading directions. During analysis, these jittered trials to the left and right were collapsed into three bins (10°, 14°, and 18°). There were six trials per condition (three to left of the centre and three to the right), making it a total of 198 trials (5 (dot-low conditions) 3 2 (visibility conditions) 1 1 (textured
ground condition) 3 3 (heading angle bins) 3 6 trials).
2.3.2 Steering experiment
The same basic displays were used in the Steering experiment as those in the Heading experiment (see the above section), with ive dot-low conditions with two levels of luminosity each and a textured ground condition. An eccentric target (pole) was also added to the scene to provide a steering goal, and because of the change in direction the displays did contain an additional rotation component (not just linear translation as in the Heading experiment).
Participants were seated in front of a large screen and presented with displays that simulated self-motion at a constant speed of 13.8 m/s (approximately 50 kmh) for 3 s (the trial time was longer to allow suficient time to generate a steering response). An eccentric target (pole) was visible in the environment, located 50 m away. The participants’ task was to steer as smoothly and accurately as they could towards the target (although the trial always stopped after 3 s which was before the target was reached).
In the Heading experiment, the offset angles were at 10°, 14°, and 18° (±1°). However, a 10° target offset requires minimal steering to correct; hence, the 10° offset was removed and an offset of 22° introduced (14° and 18° were therefore used in both experiments). As in the Heading experiment, a jitter of ±1° was added. Jittered trials to the left and right were collapsed into three bins (14°, 18°, and 22°) for the analysis. There were six trials per condition (three to the left of the centre and three to the right of the centre of the screen), making it a total of 198 trials (5 (dot-low conditions) 3 2 (visibility
conditions) 11 (textured ground condition) 3 3 (heading angle bins) 3 6 trials).
2.4 Analysis
In the Heading experiment, for each trial the difference between the actual and indicated heading angles was taken. RMS error of the six trials was calculated per condition per participant to provide an overall measure of error (“heading error”). To determine if there was bias in the judgements, a directional heading error was calculated, whereby heading estimates greater than the target offset (overestimates) were positive and heading estimates smaller than the target offset (underestimates) were negative (“signed heading error”). Taken together, these measures will indicate how close esti-mates were to the actual direction of heading and whether there was consistent bias in the estiesti-mates in a particular direction.
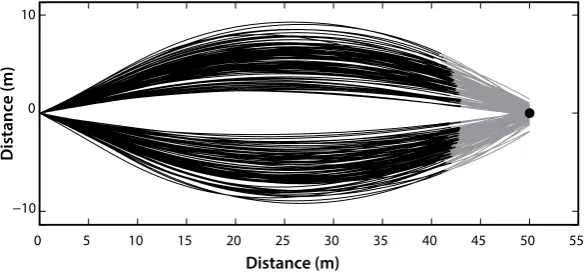
In the Steering experiment, the trajectory of each trial for each participant was extrapolated towards the target from their position and heading in the inal frame (see Figure 2). The error (in degrees) was calculated between the extrapolation and the target position. Similar to the Heading experiment, the RMS error (“steering error”) and steering bias (“signed steering error”) of the six trials per condition per participant was calculated (positive bias was an overestimate of the target offset:
−10 0 10
0 5 10 15 20 25 30 35 40 45 50 55
Distance (m)
[image:6.595.151.444.605.741.2]Distance (m)
Figure 2. Top-down view of steering trajectories of all conditions for one participant (solid black lines). These
“oversteer” whereas a negative bias was an underestimate of target estimate: “understeer”). Each tra -jectory was extrapolated since simulated motion stopped before participants reached the target. This was done to ensure that the measure of steering error relected the use of low information throughout the trial, rather than any last-minute steering adjustments that may have been initiated merely because the target moved rapidly towards the edge of the display (which occurs for even small errors at close distances). The extrapolation was done using third-degree polynomial curve-itting algorithms on the last 0.66 s of each trial.
3 Heading experiment: Results and discussion
3.1 Dot-low
First, to examine whether degrading the low information would indeed lead to an increase in head-ing error, a repeated-measures ANOVA was carried out: 5 (dot-low conditions) 3 2 (visibility
condi-tions) 3 3 (heading angles). The results of this ANOVA are summarised on Table 1. Although there
were signiicant main effects for all three factors, all three two-way interactions were also signiicant and so we will focus on these.
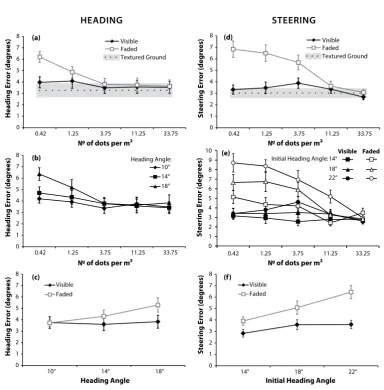
The signiicant interaction between the number of dots and the visibility of the dots is shown in Figure 3(a) (performance of participants in the textured ground condition is also shown for compari-son). Under conditions of diminished optic low (“faded”), heading errors gradually increase as the number of dots decreases, whereas under full visibility there is little effect of decreasing the number of
dots. The other interactions (Dots 3 Angle and Visibility 3 Angle) show that increasing target
eccen-tricity leads to larger heading errors only when low is of reduced quality. Figure 3(b) shows this effect for low containing fewer dots and Figure 3(c) shows it when low is faded.
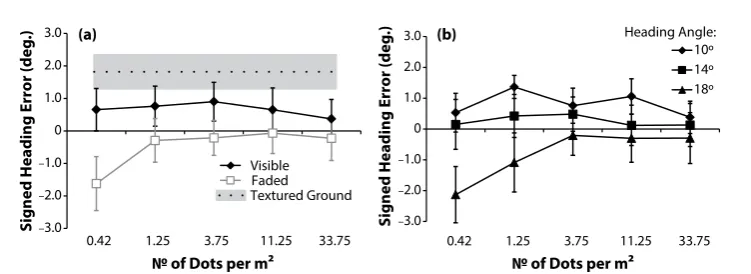
A formal analysis of the signed heading errors revealed a signiicant interaction between number of dots and visibility conditions (F(4, 52) 5 4.50, p5 0.003, p2 5 0.26) and a signiicant interaction
between number of dots and angle (F(8, 104) 5 2.73, p5 0.009, p2 5 0.17) shown in Figures 4(a) and
(b), respectively. The interaction between number of dots and visibility is driven by the large negative
bias for the condition with the fewer dots in the faded condition, while the interaction between number of dots and heading angle is driven by underestimating heading in the largest (18°) heading angle when low contained few dots.
RMS heading errors in the full visibility conditions are approximately 4°, which is at Cutting’s (1986) threshold (4.2°) for locomotor control. Simply reducing the number or luminance of dots was
not suficient to cause errors when heading angles were small; however, a combination of these factors did impair heading judgments. Large heading angles combined with a small number of dots or reduced
luminance dots led to errors .5°. For small heading angles, a combination of reduced numbers and
luminance of dots also led to larger (.4.2°) heading errors. Overall, it appears that this experimental
[image:7.595.183.423.631.768.2]paradigm is able to identify conditions where optic low does not provide suficient information for the participants to estimate their direction of heading to a suficient level of accuracy to inform steering
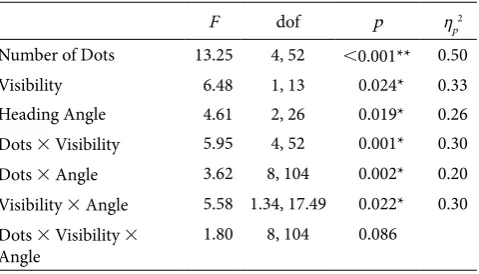
Table 1. Results of the repeated-measures ANOVA in the Heading
experiment using only the ive dot-low conditions with two levels of luminance each and the three heading angles.
F dof p ηp2
Number of Dots 13.25 4, 52 ,0.001** 0.50
Visibility 6.48 1, 13 0.024* 0.33
Heading Angle 4.61 2, 26 0.019* 0.26
Dots 3 Visibility 5.95 4, 52 0.001* 0.30
Dots 3 Angle 3.62 8, 104 0.002* 0.20
Visibility 3 Angle 5.58 1.34, 17.49 0.022* 0.30
Dots 3 Visibility 3
Angle
1.80 8, 104 0.086
(as speciied by a threshold identiied by Cutting, 1986). In the next experiment, we will determine
whether these conditions actually map onto the cases where participants struggle to steer effectively.
3.2 Dot-low and textured ground
Before we examine steering, we still wished to examine whether there was a difference between the information provided by the dot-low and textured ground plane, therefore a 6 (low conditions) 3 3 (heading angles) repeated-measures ANOVA was carried out. In order to keep the factorial design, the faded dots conditions were excluded from the analysis and the textured ground was introduced. In previous experiments conducted by Li et al. (2006, 2011), there were no differences between the accu -racy of heading judgements from dot-low and textured ground. Our RMS error results are consistent with this: there was no signiicant main effect of low, F(5, 65) 5 1.92, p5 0.103, heading angle, F(2,
26) 5 1.26, p5 0.301, and no signiicant interaction, F(10, 130) 5 0.78, p5 0.650 on heading error. While the magnitude of error did not differ between low types, it appears that there were differ -ences in the direction of heading errors. When examining signed heading errors we found a signiicant
0 1 2 3 4 5 6 7 8
0.42 1.25 3.75 11.25 33.75
Visible Faded Textured Ground 0 1 2 3 4 5 6 7 8
0.42 1.25 3.75 11.25 33.75
10° 14° 18° 0 1 2 3 4 5 6 7 8
10° 14° 18°
Visible Faded 0 1 2 3 4 5 6 7 8
0.42 1.25 3.75 11.25 33.75
0 1 2 3 4 5 6 7 8
14° 18° 22°
Visible Faded Visible Faded Textured Ground HEADING STEERING
Heading Error (degrees)
Heading Error (degrees)
Heading Error (degrees)
(a)
(b)
(c)
(d)
(f)
Steering Error (degrees)
Steering Error (degrees)
Steering Error (degrees)
№ of dots per m² № of dots per m²
№ of dots per m² № of dots per m²
Heading Angle Initial Heading Angle
Heading Angle: 0 1 2 3 4 5 6 7 8 9 10
0.42 1.25 3.75 11.25 33.25
22° 14° 18°
Visible Faded (e)
[image:8.595.107.492.94.485.2]Initial Heading Angle:
Figure 3. Comparing RMS errors in the Heading (a–c) and Steering (d–f) experiments. (a) Heading errors for the
main effect of low, (F(2.45, 39.91) 5 3.85, p5 0.025, p2 5 0.23), whereby heading judgements
in texture conditions were overestimated compared with visible dot-low, but no signiicant effect
of angle (F(1.28, 16.64) 5 4.12, p5 0.050, p2 5 0.24) and no signiicant interaction between the
two (F(4.92, 64.03) 5 1.60, p5 0.172, p2 5 0.11). The main effect of low is shown in Figure 4(a)
(black solid line represents the dot-low conditions whilst the black dotted line the textured ground condition). To analyse the main effect of low, planned contrasts were used to compare all dot-low conditions with the textured ground condition. It was found that the textured ground condition was sig-niicantly different from the 0.42 dots/m2 (F(1, 13)
5 5.49, p5 0.036), the 11.25 dots/m2 (F(1, 13) 5 5.07, p5 0.042) and the 33.75 dots/m2 (F(1, 13)
5 7.38, p5 0.018). It seems then that the group tended to overestimate heading direction in the textured ground condition compared with visible dot-low conditions, but these estimates were more consistent (the RMS heading errors were similar for both textured and visible dot-low conditions).
In summary, it appears that the quality of information provided by full luminance dot-low and ground texture supports similar levels of accuracy (RMS heading error) though precision does seem to be somewhat improved for texture. The next experiment will examine whether the same visual condi-tions provide suficient information to support accurate steering performance.
4 Steering experiment: Results and discussion
4.1 Dot-low
A 5 (dot-low conditions) 3 2 (visibility conditions) 3 3 (initial heading angles) repeated-measures ANOVA was carried out on the RMS steering errors to compare steering performance across dot-low conditions when luminance was full (“visible”) or diminished (“faded”). Table 2 shows the results of this ANOVA.
There were signiicant main effects for all three factors (as in the Heading experiment)—steering error increased for larger initial heading angles, fewer dots and reduced visibility (Figure 3). In line with the Heading experiment, dot visibility interacted with heading angle: larger angles caused greater steering errors, an effect that was more pronounced when dots were faded (the open symbols have a
steeper gradient in Figure 3f). There was also an interaction between visibility and dot number. When
the low ield was sparse (0.42–3.75 dots/m2), faded dots led to larger steering errors than when dots
were visible (Figure 3d). The triple interaction between dot number, visibility, and angle shown in
Figure 3(e) indicates that whereas there was little change in steering error in visible dots conditions (black illed symbols) when there were fewer dots or larger heading angles, when dots were faded (grey illed symbols) both fewer dots and larger angles elevated steering errors.
While the general pattern of errors (increasing error when low is degraded and angles increase) looks broadly similar for the Heading and Steering experiments, there are some interesting differences. It is notable that heading judgements seem to be robust to faded low and as few as 1.25 dots/m2, whereas steering errors are elevated under these conditions and only reduce when the number of dots
increase to 11.25 per m2. We are observing conditions, therefore, where participants can accurately
[image:9.595.113.489.99.236.2]judge their heading direction (errors below 4.2°) but this alone does not enable accurate steering. Because steering errors increased with larger initial heading angles, we wanted to ensure that the differences between Heading and Steering were not merely caused by the replacement of the 10°
Figure 4. (a) The interaction between number of dots and dot visibility for signed heading error. (b) The interaction
between number of dots and heading angle for signed heading error. –3.0
–2.0
–1.0 0 1.0 2.0 3.0
0.42 1.25 3.75 11.25 33.75 Visible Faded Textured Ground
№ of Dots per m²
Signed Heading Error (deg
.) (a)
–3.0
–2.0
–1.0 0 1.0 2.0 3.0
0.42 1.25 3.75 11.25 33.75 10º 14º 18º Heading Angle:
№ of Dots per m²
Signed Heading Error (deg
heading trials with the 22° steering trials. A comparison of just the 14° trials (square symbols) and 18° trials (triangle symbols) in Figures 3(b) and (e) conirms that errors were elevated for steering com -pared with heading judgements for intermediate numbers of dots (1.25° and 3.75°). The differences between Heading and Steering are examined more formally in the next section, where we compare visible dot low and texture.
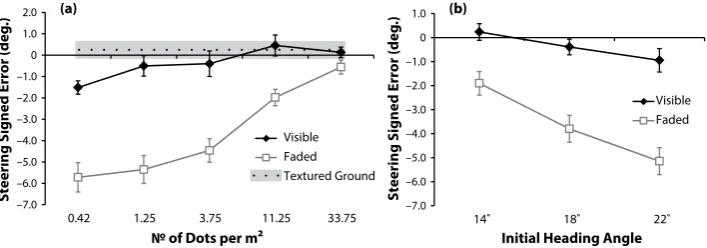
To determine if there were systematic biases in steering, we carried out a 5 (dot-low conditions) 3 2 (visibility conditions) 3 3 (initial heading angles) repeated-measures ANOVA on signed steering error. Whilst all three main effects yielded signiicant results, there were also two signiicant inter -actions, one between number of dots and visibility (F(4, 32) 5 13.66, p, 0.001, p2 5 0.63) and
between visibility and initial heading angle (F(2, 16) 5 9.69, p5 0.002, p2 5 0.55). These
interac-tions are shown in Figures 5(a) and (b), respectively. Figure 5(a) shows that participants understeer
most in the faded conditions when the number of dots decreases.
Figure 5(b) displays the interaction between initial heading angle and visibility condition for the
signed steering error. While a larger initial angle results in greater understeer for both visibility condi -tions, this effect is more pronounced on the faded condition as seen by the steeper slope in Figure 5(b).
4.2 Dot-low and textured ground
A repeated-measures 6 (low conditions) 3 3 (heading angles) ANOVA examined the fully visible dots alongside the textured ground plane in order to determine whether there were differences in the information provided by dot-low and texture as relected in the RMS steering error. No signiicant main effect of the low condition was found (F(5, 40) 5 1.96, p5 0.106, p25 0.20), and while there
was a signiicant effect of initial heading angle (F(2, 16) 5 7.20, p5 0.006, p25 0.47), there was no
signiicant interaction between these factors (F(10, 80) 5 1.37, p5 0.211, p25 0.15). It seems that in
[image:10.595.193.403.139.296.2]terms of steering error there were no differences between rich dot-low and textures. The main effect of
Table 2. Results of the repeated-measures ANOVA in the Steering experiment using only the ive dot-low conditions with two levels of luminance each.
F dof p ηp2
Number of Dots 16.71 4, 32 ,0.001** 0.68
Visibility 46.77 1, 8 ,0.001** 0.85
Heading Angle 28.28 2, 16 ,0.001** 0.78
Dots 3 Visibility 15.38 4, 32 ,0.001** 0.66
Dots 3 Angle 3.80 8, 64 0.001* 0.32
Visibility 3 Angle 9.04 2, 16 0.002* 0.53
Dots 3 Visibility 3
Angle
2.30 8, 64 0.031* 0.22
[image:10.595.122.476.629.753.2]*Signiicant at the p , 0.05 level; **signiicant at the p , 0.001 level.
Figure 5. (a) The interaction between number of dots and visibility condition and (b) the interaction between
initial heading angle and visibility condition for signed steering error. –7.0
–6.0 –5.0 –4.0 –3.0 –2.0 –1.0 0 1.0 2.0
0.42 1.25 3.75 11.25 33.75
Visible Faded Textured Ground
–7.0 –6.0 –5.0 –4.0 –3.0 –2.0 –1.0 0 1.0
14˚ 18˚ 22˚
Visible Faded
№ of Dots per m² Initial Heading Angle
(a) (b)
Steering Signed Error (deg
.)
Steering Signed Error (deg
initial heading angle (shown in Figure 3f, black line) was analysed using repeated contrasts, and while no signiicant difference was found between the 14° and 18° conditions (F(1, 8) 5 3.90, p5 0.084), there was a signiicant difference between the 18° and 22° conditions (F(1, 8) 5 5.89, p5 0.041), with the error on the 22° (M5 3.62°, SEM 5 0.38) being signiicantly larger than the error on the 18°
condition (M5 3.16°, SEM 5 0.28).
To see whether there were differences in error bias, we carried out the same analysis on signed steering error. This revealed a main effect of the low condition (F(5, 40) 5 5.52, p5 0.001, p25
0.41) and a main effect of the initial heading angle (F(1.23, 9.86) 5 5.83, p5 0.032, p25 0.42). The
main effect of low is shown in Figure 5(a) (black solid line for the ive dot-low conditions and black
dotted line for the textured ground condition). The main effect was analysed using planned contrasts comparing all of the dot-low conditions to the textured ground condition: differences were only found for the most sparse dot-low condition when there were 0.42 dots/m2 (F(1, 8) 5 27.32, p5 0.001).
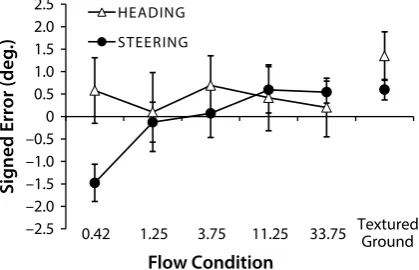
To rule out possible differences because of using the 22° steering angle (rather than the 10° head -ing angle) in the Steer-ing experiment, we repeated the analysis for Head-ing and Steer-ing us-ing just the 14° and 18° angles for the signed errors. Whilst both experiments yielded a signiicant effect of low (Heading: F(5, 65) 5 3.13, p5 0.014, p25 0.19; Steering: F(5, 40) 5 5.32, p5 0.001, p25 0.40),
the directional patterns were different for Heading and Steering, as can be seen in Figure 6. Steering bias was similar for rich dot-low and texture with increased understeer as the number of dots within low reduced. In contrast, heading bias was fairly similar across dot-low containing different numbers of dots, though heading overestimates increased when a texture was used.
5 General discussion
Dot-low has been used within computer-generated displays in order to examine the ability of humans to make heading judgments. Our results show that dense high-contrast dot-low stimuli lead to similar levels of accuracy as when a photorealistic texture is applied to the ground, and this is true for both heading judgements and steering responses. These indings agree with those of Li et al. (2011), who
examined dot-low and textured ground and found no difference between the two conditions at walk -ing speeds. Here, we extend this ind-ing to travell-ing at faster locomotor speeds and steer-ing condi -tions where gradual changes to the direction of motion were executed.
Interestingly, our results do suggest that performance is not wholly equivalent for heading judge -ments and steering responses as low becomes degraded: when dot-low contained an intermediate number of dots steering errors increased as dots were faded, whereas heading judgements were unaf -fected by these degraded conditions. It seems, therefore, that the ability of a human to effectively detect their direction of heading does not necessarily translate into effective steering using the same displays.
The differences between heading and steering are reinforced by the measures of directional error
(see Figures 4a and 5a). Because of the similarity in the magnitude of signed and unsigned steering
errors, we believe that these patterns of bias are fairly consistent for steering. In contrast, unsigned heading errors were much larger than the signed heading errors, which indicates that heading bias was not consistent, and of a different pattern to steering. When comparing heading and steering perfor -mance for only those trials of equivalent eccentricity (Figure 6), the differences in error patterns were
–2.5 –2.0 –1.5 –1.0 –0.5 0 0.5 1.0 1.5 2.0 2.5
0.42 1.25 3.75 11.25 33.75 Textured Ground
H E A D IN G
S T E E R IN G
Flow Condition
Signed Error (deg
[image:11.595.194.404.614.749.2].)
Figure 6. The main effect of the low condition for the Steering and Heading experiments using only the two
still evident: e.g. there was understeer for displays containing fewer dots but no underestimate of head
-ing direction in these conditions (Figure 6). Both heading and steering methods have been used in the
past to understand human locomotor control, but success at making heading judgments has often been the basis of generalised discussions about how human locomotor control is achieved with the natural inference that they will inform steering control. Our evidence is potentially problematic for the sug -gestion that steering is guided solely by heading: if steering is based on heading, then an overestimate of heading angle should lead to oversteer rather than understeer (as we actually observed). We think it unlikely that the overestimation of heading direction could have some functional purpose (e.g. to com -pensate for delays in executing a steering response) because we observed the greatest heading overes
-timation for smaller angles (Figure 4b). It would functionally be more useful to initially overestimate
larger heading angles, but if anything these conditions led to underestimation. Furthermore, whilst an initial overestimate might be functionally useful when initiating steering to close down the angle at a faster rate, accurate heading estimates would actually be required for the majority of the trajectory in order to steer successfully once the angle to the target has been closed down.
The reason we carried out the Heading and Steering experiments was in order to examine the relationship between commonly used experimental displays. In particular, we chose to use linear head -ing trajectories since they have been shown to produce robust estimates which should be useful for maintaining a straight-line trajectory. It should be noted, however, that the Steering experiment clearly differed in a number of ways from the Heading experiment. Heading judgements were indicated after self-motion, whereas steering was executed with a continuous online motor response.3 The Heading
experiment displayed no rotation in the optic low ield (just linear translation), whereas Steering gen -erated displays containing both translation and rotation components. So, while we have shown that pat -terns of errors are sometimes different between these tasks, we are unable at present to pinpoint exactly why this might be. For example, the most degraded conditions may have reduced the perceived speed of self-motion (consistent with studies that show reduced edge rates also reduce perceived speed; e.g. Larish & Flach, 1990) and this could have selectively impaired steering. While it is possible that speed
perception is an important additional information source for steering control (independent of heading) there are a number of successful models of steering that do not explicitly require this information in order to effect successful steering control (e.g. Kountouriotis, Floyd, Gardner, Merat, & Wilkie, 2012; Fajen & Warren, 2003; Wilkie, Kountouriotis, Merat, & Wann, 2010; Wilkie & Wann, 2003). The
model of Wilkie and Wann (2003) relies upon the detection and gradual reduction of rotation rates
detected from multiple sources of information (including retinal low). It could be argued that when retinal low is degraded, then the rotation component becomes more dificult to detect than the linear translational component, which could explain the differences in error patterns for the Steering and Heading experiments. Whilst there is an increased tendency to understeer as low becomes degraded (Figure 5a), which is consistent with impaired detection of rotation, there is also increased understeer
for more eccentric targets (Figure 5b), which would not be expected (the rotation component should
be of greater magnitude for more eccentric targets, and so would be easier to detect).
An alternative experimental approach could have been to try to examine the sensitivity to head -ing under identical locomotor trajectories. In fact, Kelly, Beall, Loomis, Smith, and Macuga (2006) carried out such an experiment by asking participants to steer along a demarked curvilinear trajectory (a curving roadway) but when locomotion stopped, they asked participants to make an instantaneous heading judgement. The vehicle’s deviation from the road centre was used as a measure of steering, and a correlation between heading and steering errors was observed (with bias towards the direction of the bend). Because they used a textured ground plane, it seems reasonable that the rich low provided suficient information to estimate heading as well as perform steering. The present experiment only revealed differences between heading and steering errors when low was somewhat degraded. Another difference between Kelly et al. (2006) and the present experiment is that the heading judgements in the former were made after travelling on a curvilinear trajectory. One problem with this method is that when making heading judgements on a curvilinear trajectory, participants often make judgements of
3We have compared heading and steering based on the initial target angles. Because the steering response changed
the displays, the eccentricity of the target had to reduce over time in order to complete the task. If we had found that the patterns of steering performance across display conditions indicated greater sensitivity when steering,
path (see Lappe et al., 1999). On a straight line path, heading and path coincide, whereas on a bend the
current direction of motion becomes separated from the path that actually leads to the target (Wilkie & Wann, 2006). This might explain the heading bias reported by Kelly et al. (2006) since a judgement in the direction of the bend could relect the inluence of path. When steering, bias towards the direction of the bend (i.e. towards the inside road-edge) has been frequently documented (Kountouriotis et al.,
2012; Raw, Kountouriotis, Mon-Williams, & Wilkie, 2012; Wilkie et al, 2010; see Raw et al., 2012
for a plausible explanation of this behaviour) so a correlation between heading and steering would not be surprising.
In our present work, we have highlighted that there are some key differences between heading and steering. It should be made clear, however, that we are not suggesting that they are completely unrelated. It seems a sensible control solution for an animal to use heading information to maintain a straight line trajectory and to make corrective adjustments using heading. From this standpoint, exist -ing methodologies that use dot-low combined with head-ing judgements should be considered compli -mentary to using photorealistic textures and active steering. Ultimately, the choice of the method will depend upon the degree of control that is required, both over display characteristics and the uniformity of motoric response. These factors need to be balanced against the desire to examine behaviours more closely related to those carried out during real-world locomotor steering. Indeed, research examining the neural basis of locomotor steering in fMRI settings has used a variety of methods: dot-low dis -plays (Wall, Ashida, Lingnau, & Smith, 2008; Wall & Smith, 2008), dot-low and heading (Peuskens,
Sunaert, Dupont, van Hecke, & Orban, 2001) and active steering through textured environments (Billington, Field, Wilkie, & Wann, 2003; Field, Wilkie, & Wann, 2006). The full network of neural circuitry can only be exposed using active steering, but subcomponents of optic low processing can be usefully investigated with heading judgements. It is hoped that a broad set of display methods will allow the ield to develop a general model of locomotion that will ultimately explain human steering behaviour within real-world environments.
6 Conclusions
It appears that although participants can accurately judge their heading from a number of display conditions, accurate steering performance requires richer low displays. Furthermore, it can be argued, based on these results, that whilst there is some relationship between judging heading and effectively steering the quality and quantity of low that supports one is not necessarily suficient for the other. It appears therefore that control of steering curved paths may not solely rely on heading perception.
Acknowledgments. Georgios Kountouriotis was funded by the EPSRC UK for his doctoral training.
References
Billington, J., Field, D. T., Wilkie, R. M., & Wann, J. P. (2010). An fMRI study of parietal cortex involvement in the visual guidance of locomotion. Journal of Experimental Psychology: Human Perception and Performance, 36(6), 1495–1507. doi:10.1037/a0018728
Crowell, J. A., Banks, M. S., Shenoy, K. V., & Andersen, R. A. (1998). Visual self-motion perception during head turns. Nature Neuroscience, 1(8), 732–737. doi:10.1038/3732
Cutting, J. E. (1986). Perception with an eye for motion. Cambridge, MA: MIT Press.
Fajen, B. R., & Warren, W. H. Jr. (2000). Go with the low. Trends in Cognitive Sciences, 4(10), 369–370.
Fajen, B. R., & Warren, W. H. (2003). The behavioral dynamics of steering, obstacle avoidance, and route selection. Journal of Experimental Psychology: Human Perception and Performance, 29(2), 343–362.
Field, D. T., Wilkie, R. M., & Wann, J. P. (2006). The neural correlates of path perception and steering investigated with fMRI. Perception, 35, 65–66. doi:10.1068/v060003
Gibson, J. J. (1958). Visually controlled locomotion and visual orientation in animals. British Journal of Psychology, 49(3), 182–194. doi:10.1111/j.2044-8295.1958.tb00656.x
Gibson, J. J. (1986). The ecological approach to visual perception. Hillsdale, NJ: Erlbaum.
Harris, J. M. (2001). The future of low? Trends in Cognitive Sciences, 5(1), 7–8.
Kelly, J. W., Beall, A. C., Loomis, J. M., Smith, R. S., & Macuga, K. L. (2006). Simultaneous measurement of steering performance and perceived heading on a curving path. ACM Transactions on Applied Perception, 3(2), 83–94. doi:10.1145/1141897.1141898
Kountouriotis, G. K., Floyd, R. C., Gardner, P. H., Merat, N., & Wilkie, R. M. (2012). The role of gaze and road edge information during high-speed locomotion. Journal of Experimental Psychology: Human Perception and Performance, 38(3), 687–702. doi:10.1037/a0026123
Lappe, M., Bremmer, F., & van den Berg, A. V. (1999). Perception of self motion from visual low. Trends in Cognitive Sciences, 3(9), 329–336. doi:10.1016/S1364-6613(99)01364-9
Larish, J. F. & Flach, J. M. (1990). Sources of optical information useful for perception of speed of rectilinear self-motion. Journal of Experimental Psychology: Human Perception and Performance, 16(2), 295–302.
Li, L., & Cheng, J. C. K. (2011a). Heading but not path or the tau-equalization strategy is used in the visual control of steering toward a goal. Journal of Vision, 11(12), 20 (1–12). doi:10.1167/11.12.20
Li, L., & Cheng, J. C. K. (2011b). Perceiving path from optic low. Journal of Vision, 11(1), 22 (1–15). doi:10.1167/11.1.22
Li, L., Stone, L. S., & Chen, J. (2011). Inluence of optic-low information beyond the velocity ield on the active control of heading. Journal of Vision, 11(4), 9 (1–16). doi:10.1167/11.4.9
Li, L., Sweet, B. T., & Stone, L. S. (2006). Humans can perceive heading without visual path information.
Journal of Vision, 6(9), 874–881. doi:10.1167/6.9.2
Longuet-Higgins, H. C., & Prazdny, K. (1980). The interpretation of a moving retinal image. Proceedings of the Royal Society of London. Series B: Biological Sciences, 208, 385–397. doi:10.1098/rspb.1980.0057
Peuskens, H., Sunaert, S., Dupont, P., van Hecke, P., & Orban, G. A. (2001). Human brain regions involved in heading estimation. Journal of Neuroscience, 21(7), 2451–2461.
Raw, R. K., Kountouriotis, G. K., Mon-Williams, M., & Wilkie, R. M. (2012). Age differences in motor-control: Does old age mean middle of the road? Journal of Experimental Psychology: Human Perception and Performance, 38(3), 735–745. doi:10.1037/a0026568
Regan, D., & Beverley, K. I. (1982). How do we avoid confounding the direction we are looking and the direction we are moving. Science, 215(4529), 194–196. doi:10.1126/science.7053572
Royden, C. S., Banks, M. S., & Crowell, J. A. (1992). The perception of heading during eye movements.
Nature, 360, 583–585. doi:10.1038/360583a0
Royden, C. S., Crowell, J. A., & Banks, M. S. (1994). Estimating heading during eye movements. Vision Research, 34(23), 3197–3214. doi:10.1016/0042-6989(94)90084-1
Rushton, S. K., & Salvucci, D. D. (2001). An egocentric account of the visual guidance of locomotion. Trends in Cognitive Sciences, 5, 6–7. doi:10.1016/S1364-6613(00)01562-X
Wall, M. B., Ashida, H., Lingnau, A., & Smith, A. T. (2008). Selective visual responses to expansion and rotation in the human MT complex revealed by fMRI adaptation. European Journal of Neuroscience, 27,
2747–2757. doi:10.1111/j.1460-9568.2008.06249.x
Wall, M. B., & Smith, A. T. (2008). The representation of egomotion in the human brain. Current Biology, 18(3), 191–194. doi:10.1016/j.cub.2007.12.053
Wann, J. P., & Land, M. (2000). Steering with or without the low: is the retrieval of heading necessary? Trends in Cognitive Sciences, 4(8), 319–324. doi:10.1016/S1364-6613(00)01513-8
Wann, J. P., & Land, M. (2001). Heading in the wrong direction. Trends in Cognitive Sciences, 5(1), 8–9. doi:10.1016/S1364-6613(00)01565-5
Wann, J. P., Swapp, D., & Rushton, S. K. (2000). Heading perception and the allocation of attention. Vision Research, 40(18), 2533–2543. doi:10.1016/S0042-6989(00)00115-2
Warren, W. H., & Hannon, D. J. (1988). Direction of self-motion is perceived from optical low. Nature, 336,
162–163. doi:10.1038/336162a0
Warren, W. H., Mestre, D. R., Blackwell, A. W., & Morris, M. W. (1991). Perception of circular heading from optical-low. Journal of Experimental Psychology: Human Perception and Performance, 17(1), 28–43. doi:10.1037/0096-1523.17.1.28
Warren, W. H., Morris, M. W., & Kalish, M. (1988). Perception of translational heading from optical low. Journal of Experimental Psychology: Human Perception and Performance, 14(4), 646–660. doi:10.1037/0096-1523.14.4.646
Wilkie, R. M., Kountouriotis, G. K., Merat, N., & Wann, J. P. (2010). Using vision to control locomotion: Looking where you want to go. Experimental Brain Research, 204(4), 539–547. doi:10.1007/s00221-010-2321-4
Wilkie, R. M., & Wann, J. P. (2003). Controlling steering and judging heading: Retinal low, visual direction, and extraretinal information. Journal of Experimental Psychology: Human Perception and Performance, 29(2), 363–378. doi:10.1037/0096-1523.29.2.363
Copyright 2013 G K Kountouriotis, R M Wilkie
Published under a Creative Commons Licence a Pion publication
George K. Kountouriotis studied for his PhD under Richard Wilkie and Natasha Merat in the University of Leeds looking at eye movements and visual information when steering/driving around bends. Currently, he is working with Geoffrey Bingham in Indiana University examining how children with DCD control arm movements and possible ways of improving control of compliant limb movements. He also has a particular interest in the brain areas that control these processes and how brain damage can affect our ability to use visual information to act effectively upon our environment. Picture taken during the month of “Movember.”