Solar Activity during the Rising Phase of Solar Cycle 24
Aradhna Sharma, S. R. Verma
Post Graduate Department of Physics, DBS (PG) College, Dehradun, India Email: [email protected], [email protected]
Received July 2, 2013; revised August 3, 2013; accepted August 10, 2013
Copyright © 2013 Aradhna Sharma, S. R. Verma. This is an open access article distributed under the Creative Commons Attribution License, which permits unrestricted use, distribution, and reproduction in any medium, provided the original work is properly cited.
ABSTRACT
Solar activity refers to any natural phenomenon occurring on the sun such as sunspots, solar flare and coronal mass ejection etc. Such phenomena have their roots deep inside the sun, where the dynamo mechanism operates and fluid motions occur in a turbulent way. It is mainly driven by the variability of the sun’s magnetic field. The present paper studies the relation between various solar features during January 2009 to December 2011. A good correlation between various parameters indicates similar origin.
Keywords: Solar Activity; Sunspot Number; Solar Radio Emission Flux; Coronal Mass Ejections; Solar X-Ray Background
1. Introduction
The solar atmosphere continues to be one of the richest and most dynamic environments studied in modern as- trophysics. Spanning many orders of magnitude in den- sity and temperature, while linked to the complex system of magnetic field the sun displays a myriad of interesting phenomenon from sunspots in the photosphere to coronal mass ejections—the most energetic events in the solar system. Like earth, the sun has seasons. More precisely, it has a cycle that lasts about 11 years. The number of sunspots rises and falls and rises again in about 11 years. This is due to the variability of solar magnetic field. The variability of the magnetic field has a strong influence on the dynamics of the outer layer of the sun and is regis- tered by several solar parameters such as the sunspot number, the rate at which flux and coronal mass ejections occur, the flux of solar X-rays and radio waves.
The wealth of solar coronal phenomena called as solar activity should be viewed beyond their individual occur- rences [1]. Coronal mass ejections are the most spec- tacular phenomenon of solar activity. CMEs occur in regions of closed magnetic fields that overlie magnetic inversion lines [2]. A study on CME is an important topic that is related directly to space environment [3]. The sunspot cycle is an important form of solar variability that indicates the extent of closed magnetic field struc- ture on the sun, and hence is important to the study of the origin of coronal mass ejections. Based on the 110 Sky- lab CMEs, Hildner et al. [4] found the CME rate (R) to
be correlated with the sunspot number and obtained the relation
R = 0.96 + 0.084 N (based on 7 rotation)
They suggested that this relation is independent of the phase of the solar activity cycle and predicted a rate of 3.2 per day for solar maximum phase.
Webb & Howard [5] studied CMEs from 1973 to 1989 concluding that CME occurrence frequency tends to fol- low the solar activity cycle in both amplitude and phase. Gopalswamy et al. (2009) [6] have also studied CME
occurrence in relation to sunspot number and found that the correlation between them is quite weak during the maximum phase period of solar cycle as compared to that in both ascending as well as descending phase.
Researchers have studied the solar cycle that ended in December 2008 which is known as solar cycle 23. This cycle was longer than normal. The present solar cycle 24 started in December 2008 and is expected to have a shorter time period. In this paper we have studied the relation between various solar features during January 2009 to December 2011 for this cycle.
2. Sources of the Data
Data were obtained from the SOHO-LASCO CME cata- logue http://cdaw.nasa.gov/cme_lis/index.html, from the NOAA websites ftp://ftp.ngdc.noaa.gov/STP/SOLAR_ DA- TA/SUNSPOT_NUMBERS/INTERNATIONAL;
DATA/Satellite_enviornment/XRay_BGND/GOESBGN D.o6 for coronal mass ejection frequency, for sunspot number, for 2800 MHz solar radio emission, and for so- lar X-ray background, in that order.
[image:2.595.79.521.427.727.2]3. Data Analysis
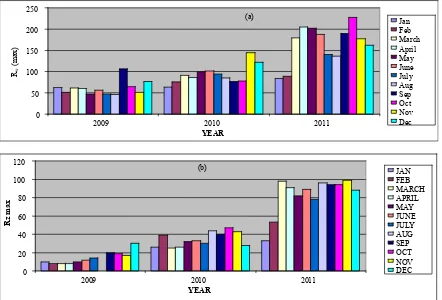
Figure 1 shows the variation of different solar parame- ters during January 2009 to December 2011. The figure shows that the sun is very quiet with less sunspots and solar activity in the beginning of solar cycle 24.
Figure 1(a) shows the monthly occurrence frequency (Rw) of the coronal mass ejections (CME) given in SOHO-
LASCO catalogue. The lowest frequency has been 46 in August 2009. The frequency increases in the year 2010 to a maximum of in the month of November. In 2011 CME frequency increases further, reaching a maximum of 227 in the month of October.
Figure 1(b) shows a similar plot for maximum value of sunspot numbers (Rz(max)) during the same period. In
August 2009, the sunspot number was zero. Like CME, sunspot number was much higher in the year 2011.
In Figure 1(c) a graph for 2800 MHz solar radio emis- sion F-10 (units 10−22·Js−1·m−2·Hz−1) is plotted. This plot
is very much similar to that of sunspot number.
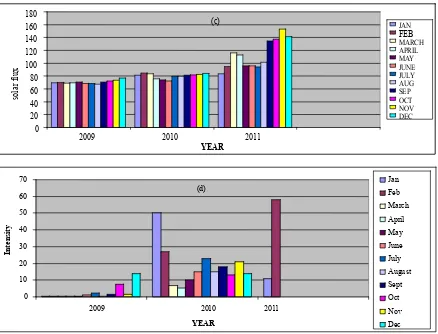
Figure 1(d) shows a similar plot for the X-ray back- ground (W·m−2). The X-ray data are available only up to
February 2011. In the data table, low values are men-
tioned < 1.0. These have been set as 0.50. The matching between (a) & (d) is good.
For detailed analysis linear plots have also been plot- ted. Figure2 shows the linear plot for monthly occur- rence frequency of CME (Rw) and sunspot no. (Rz(max)).
The mismatch in peak occurrence is obvious. The corre- lation coefficient was found to be 0.906.
Figure3 shows the linear plot for Rw and solar flux.
The correlation between Rw and solar flux is 0.813009.
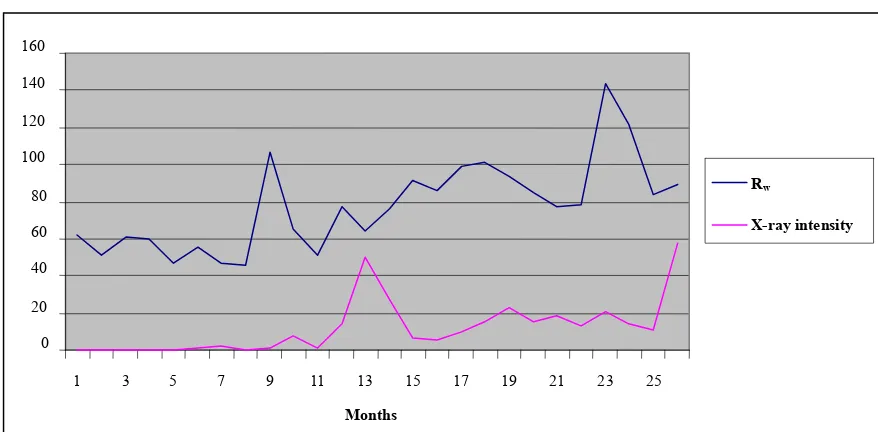
Figure4 is the linear plot for Rw and intensity. The
correlation between Rw and intensity is 0.325.
Figure 5 shows the linear plot between Rz(max) and
solar flux. The correlation coefficient between Rz and
solar flux is 0.88.
4. Conclusions
1) Solar cycle 24 has initially displayed much less ac- tivity;
2) CME occurrence frequency shows almost similar variational pattern with other forms of solar activity. This indicates similar origins, probably due to similar mag- netic configuration affecting all parameter simultane-ously;
3) Rw & Rz show very high & positive correlation.
Kane 2011 [7] has found similar result for earlier cycle. But on comparing the plots of 1(a) & 1(b) we see that CME activity and sunspot cycle do not match exactly. It
(a)
0 50 100 150 200 250
2009 2010 2011
YEAR
Jan Feb March April May June July Aug Sep Oct Nov Dec
Rw
(ma
x)
c
0 20 40 60 80 100 120
2009 2010 2011
YEAR
Rz max
Solar flux
(c)
0 20 40 60 80 100 120 140 160 180
2009 2010 2011
YEAR
JAN
FEB
MARCH APRIL MAY JUNE JULY AUG SEP OCT NOV DEC
so
la
r fl
ux
(d)
0 10 20 30 40 50 60 70
2009 2010 2011
YEAR
Inte
nsi
ty
[image:3.595.80.518.83.417.2]Jan Feb March April May June July August Sept Oct Nov Dec
Figure 1. Plots of monthly values during Januray 2009-December 2011 for (a) CME occurrence frequency; (b) sunspot no. Rz
(max); (c) 2800 MHz solar radio emission F-10 (Js−1·m−2·Hz−1); (d) X-ray background (1 - 8 Å units W·m−2).
0 50 100 150 200 250
1 3 5 7 9 11 13 15 17 19 21 23 25 27 29 31 33 35
Rz(max)
Rw
Rz(max)
Rw
0 50 100 150 200 250
1 3 5 7 9 11 13 15 17 19 21 23 25 27 29 31 33 35
Figure 2. The linear plot for sunspot number Rz and CME occurrence frequency (Rw).
may be due to the fact that CMEs originate not only from sunspot regions but also from non-sunspot regions. Ramesh & Rohini [8] and Ramesh [9] have shown that CME frequency is better related with sunspot area than with sunspot numbers. However, Kane[10] has men- tioned that sunspot areas and sunspot numbers are very
highly correlated. Therefore, sunspot number, sunspot group number and sunspot area could be used as good proxies for each other;
[image:3.595.83.515.454.633.2]0 50 100 150 200 250
1 3 5 7 9 11 13 15 17 19 21 23 25 27 29 31 33 35
Months
Rw
[image:4.595.77.519.87.240.2]solar flux
Figure 3. The linear plot for CME occurence frequency Rw & solar flux.
0 20 40 60 80 100 120 140 160
1 3 5 7 9 11 13 15 17 19 21 23 25
Months
Rw
[image:4.595.77.516.265.481.2]X-ray intensity
Figure 4. The linear plot for CME occurrence frequency Rw & intensity.
0 20 40 60 80 100 120 140 160 180
1 3 5 7 9 11 13 15 17 19 21 23 25 27 29 31 33 35
Months
solar flux
Rz(max)
Rz(max)
solar flux
Figure 5. The linear plot for sunspot no. Rz and solar flux.
5) Rw and X-rays are somewhat correlated with the
correlation coefficient of 0.325. The low correlation may be due to the fact that data in some cases have been <1.0
and to which the GOES instrument is not sensitive; 6) Rz and solar flux show very high correlation. A
[image:4.595.79.518.508.671.2]similar origin.
The study of coronal mass ejections and their rela- tionship to other forms of solar activity provides an im- portant link in the chain of evidence connecting all solar activity to its ultimate physical cause, the structure and evolution of the solar magnetic field. Understanding the solar magnetic fields has become highly important in the present scenario. We have to develop realistic models of the flares and CMEs because they are the main drivers for the space weather disturbances that strongly affect our high-tech life. During their propagation in the solar system, CMEs may frequently interact with the earth, producing a series of impacts on the terrestrial environ- ment and human high-tech activities. Despite years of study we still don’t understand key aspects of CMEs; specifically, how are they initiated in the solar corona, and how they evolve to produce the signatures that are measured with the interplanetary spacecraft. Watching the Sun continuously and analyzing the solar data con- stantly would make predictions of such events. Such quantitative relationships will be important for modeling studies and for space weather predictions.
5. Acknowledgements
We thank to various world data centers for providing the data.
REFERENCES
[1] B. C. Low, “Coronal Mass Ejections, Magnetic Flux Rope and Solar Magnetism,” Journal of Geophysical
Re-search, Vol. 106, No. A11, 2001, pp. 25, 141-25163.
[2] J. T. Gosling, “Coronal Mass Ejections and Magnetic Flux Rope in Interplanetary Space,” AGU Monograph Se- Ries, Vol. 58, 1990, pp. 343-364.
[3] N. J. Fox, M. Peredo and B. J. Thompson, “Cradle to Grave Tracking of the January 6-11, 1997, Sun-Earth Connection Event,” Geophysical Research Letters, Vol. 25, No. 14,
1998, pp. 2461-2464.
[4] E. Hildner, et al. “Frequency of Coronal Transients and
Solar Activity,” Solar Physics, Vol. 48, No. 1, 1976, pp.
127-135.
[5] D. F. Webb and R. A. Howard, “The Solar Cycle Varia-tion of Coronal Mass EjecVaria-tions and the Solar Wind Mass Flux,” Journal of Geophysical Research, Vol. 99, No. A3,
2012, pp. 4201-4220.
[6] N. Gopalswamy, et al., “Magnetic Coupling between the
Interior and Atmosphere of the Sun,” In: S. S. Hasan and R. J. Rutten, Eds., Astrophysics and Space Science Pro-
ceedings, Springer-Verlag, Berlin, 2010, pp. 289-307.
[7] R. P. Kane, “Solar Activity during Sunspot Minimum,”
Indian Journal of Radio & Space Physics, Vol. 40, No. 1,
2011, pp. 7-10.
[8] K. B. Ramesh and V. S. Rohini, “1-8 Angstrom Back- ground X-Ray Emission and the Associated Indicators of Photospheric Magnetic Activity,” The Astrophysical Jour-
nal Letters (USA), Vol. 686, No. 1, 2008, pp. L41-L44.
[9] K. B. Ramesh, “Coronal Mass Ejections and Sunspots- Solar Cycle Perspective,” The Astrophysical Journal Let- ters (USA), Vol. 712, No. 1, 2010, pp. L77-L80.