Copyright©1977 American SocietyforMicrobiology PrintedinU.S.A.
Flow
Field-Flow
Fractionation:
New
Method
for Separating,
Purifying, and Characterizing the Diffusivity
of Viruses
J. CALVIN GIDDINGS,* FRANK J. YANG, AND MARCUS N. MYERS
Department of Chemistry, University of Utah, Salt Lake City, Utah 84112
Received for publication 6July 1976
The nature and theory of flow field-flow fractionation is described, and its
potentialapplicabilityto virus-likeparticles isdiscussed. Different virus types
are shown to be retained at different levels. Retention can be controlled by
variation of the experimental parameters, in good agreement with theory.
However, amild adsorption effectisindicated and requires thedevelopmentof
alternate strategies for measuring diffusion coefficients. For Q(3, our value
agrees well within 10% of literature values; the values obtained for other
viruses, using Q/3as an internal standard, areuntested. Finally, it is
demon-strated thatflowfield-flowfractionation can cleanlyfractionatetwovirusesfrom
one another and from an albumin impurity, that samples as large as several
milligrams in size can be analyzed, and that the method has potential utilityin
the quantitativeand qualitative analysis of virussystems.
Field-flowfractionation (FFF) is a relatively
new tool, developed primarily for the
separa-tion and characterization of macromolecdles
andparticles (4, 5, 10).The technique has
dem-onstrated a capability of dealing with an
enor-mous massrange. Various subtechniques have
beenusedtohandle components varying from a
molecularweight of 600 up to particles of 1 ,um
in diameter. This represents a mass range of
approximately 109.
FFFtakesadvantage of the nature of viscous
flow in narrow channels. Under laminar flow
conditions,the velocity of flow approaches zero as oneapproaches the wall of the channel. Any
soluteor particle confinedinthe quiescent
re-gion nearthe wall will have itsmotionretarded relative to solutes distributed over the total flowcross section.
FFF employs an external field to partition
the desired solutes into the quiescent wall
re-gions of a narrow column. The field isapplied
alonganaxisperpendiculartothe flow axis. As thestrengthof the field isincreased,the solute
is driven further and further toward the wall
and its downstream motionisincreasingly
re-tarded. Differentsolutes will beretarded
differ-entiallybecausetheywillinteract to a different
degree with thefieldand/or theywillexhibita
differentlevelofdiffusivitythatwillselectively
oppose the induced drift toward the channel
wall.
The subtechniques ofFFFare characterized
accordingto the kindof field employed. Many
possibilities exist, but we have so far utilized
thermal gradients (givingusthermal FFF) (1,
6, 14, 19), electrical fields (7), sedimentation
fields (SFFF) (7, 8, 20), and flow gradients (9)
(Giddings, Yang, and Myers, Science,inpress).
A combination of these techniques has given
evidence ofbeing applicable to an
extraordi-nary rangeof solute mass and properties andof
solvent types.
The rate of migration of solutes in FFF
de-pends onthe magnitude and type offield, the
channel dimensions, the solute-field
interac-tion, and the solute-solvent diffusion
coeffi-cient. Inasmuch as the channel is designedto
have a simple and tractable geometry with
per-fectly understood flow characteristics, the
re-tentionof components canbe,intheideal case,
mathematically describedintermsofthese
pa-rameters. Therefore, measurements of
reten-tion canbe inverted to yield some combination
of parameters related to field-solute coupling
anddiffusivity.Ithas beenshown, for example,
that sedimentationFFFcanbe usedtoyield the
effective mass and, therefore, ultimately the
molecularweight of viruses (8).
Inflow FFF, the "field"orinfluenceselected
todrive solute towardachannel wall issimply
thesuperposition of lateral cross-flow fromone
side of the channel to the other. This lateralor
secondary flow is superimposed upon the
pri-maryaxial flow which carriessolute fromone
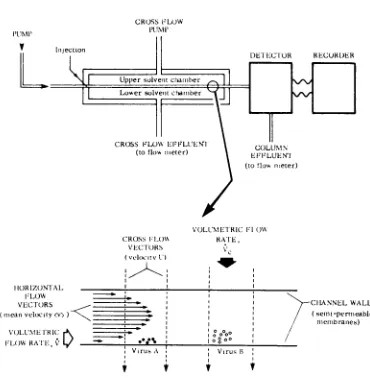
end of thecolumn tothe other (seeFig. 1). The
maintenance oflateral flowis assuredby
con-structingthe column such that it consistsof the
space between two flat, semipermeable
mem-branes. Thelateral flow proceedscontinuously
throughout the experiment, passing crosswise
131
on November 10, 2019 by guest
http://jvi.asm.org/
132 GIDDINGS, YANG, AND MYERS
C:ROSS I_(%k
VrECTlORS
11011[ZONIlALl
IFLO\N
lea,,velicity<v>)< *
VO)LUM.\E Rlt['C
IFLOW\sRATIE ;
VeOLUMAlETRIC F )\ RATIE,
I
Viru..B3
FIG. 1. Schematic edgeviewof flow FFF channel showsthe crossedflow vectors.
through the column, permeating first theupper
membraneand then the lower membrane. The membranes must be semipermeable such that theypreventthepassageof thedesired solutes.
Inasmuch as the imposed cross-flow acts identically onalldissolved materials, diffusion
becomestheonly selective variable in flow FFF thatcontrols the degree ofcompression of solute layers against the channel wall. Diffusion, therefore, controls retention. Because of this, differential retention (separation) is based on
differential diffusion alone. As a consequence,
themeasurementof retentionparameters can,
in theory, be employed to obtain the diffusion coefficients for the different fractionated
spe-cies. This conclusion, which has already been shownvalid forothersystems(9), will betested forviruses inthis paper.
Thediffusion andtransportofparticles in the virus size range are ordinarily very sluggish.
Therefore,alengthyamountof timeisrequired
for experiments based on considerable
dis-tancesoftransport. Thisproblem is largely cir-cumvented in FFF by virtue of the small di-mensions that can be employed for channel
width, i.e., of the order of0.35mm.This
advan-tage ismagnified by the fact that the solute is confined to a narrow layer on one side of the
channel, whose thickness may be 10 to 100
times smaller than the thickness or width of
the channel itself. The advantage of rapid
transport inthin (downto6 ,um) solute layers ofsedimentation FFF has been demonstrated
in the rapid measurement of the molecular weight of T2 virus (8). Itwasfound possibleto
complete a molecular weight measurement in
2.5 h. The same advantage should eventually
prove applicable in measuring diffusivities of individual viruses.
In this paper, we present some preliminary results demonstrating the applicability of flow FFF to theretention, fractionation, and charac-terization ofvirus systems. Despite the exist-enceofan apparentadsorption effect, valid
re-sults are obtained by using an internal
stan-dard method. Additional research is likely to
eliminate the adsorptive effect. This effect
ap-pears to be almost negligible for most ofthe macromolecularandparticle systemsstudiedin the laboratory (9).
The theory of flow FFF has been described (9). Here we review only those results
neces-sary for experimental interpretation and
de-velop a rationale and procedure for using an internal standardinthe measurementof
diffu-sioncoefficients.
Soluteparticlesareforcedby the interplay of
cross-flow and opposing diffusioninto an
expo-nentialsteady-statelayer nearthe lower
(accu-mulative) semipermeable membrane. The con-centration relative to that at the membrane
surface is therefore (5, 10) c/c0 = exp(-xIl)
(equation 1), wherexisthe distance above the
walland1 isthe characteristicthickness of the
layer. The parameter 1 is given by 1 = D/U
(equation 2), where D is the diffusion
coeffi-cient and U is sideways velocity imposed by
the cross-flow. Itishelpfulto express 1 inthe
dimensionless form, X = l/w, where w is the
channel width-the spacing between
mem-branes. We have X =DIUw (equation 3). If
lateral velocity, U, is replaced by volumetric
cross-flow,
Vi,
over the channel (membrane)area (breadth a times length L), equation 3
becomesX =
DVOIV(,wI
(equation4),where VI= awL is thecolumn void volume.
The retention ratio R is an experimental parametergiving the ratio of the elution
vol-ume ofa "void" peak (a peak eluted without
cross-flow), VO, to thatofthe retained compo-nentof interest, Vr. Accordingtothetheory of
FFF,R isrelatedto X by (5, 10) (VO/Vr) =R =
6X[coth(1/2X) - 2X] (equation 5).
From equation 5, it is possible to obtain X
values in terms of themeasuredretention pa-rameterR. (This is done mostsimplyby using aplotof R versus X.)WithX sodetermined, a
diffusivity value can be obtained from
equa-tion 3 or 4 asD= XUw = X
VIw2/VO
(equation 6).We now describe a newprocedure for using an internal standard to eliminate systematic influences frommeasurements of D. If
system-atic departures occur from equation 4 due to
imperfect membrane surfaces, etc., an
inter-J. VIROL.
CROSSF.,OW
PUNIP PLNII
1"Jectio. DEI ECTOR RECURDER
Upper cla,.,be,
L.-er cha.
CROSSI-LO%%EFFLUEII.l COLUNIN
(tofl.,,,eter) EFFLUEN
(t. fl.,"'et-)
CIIANNELWALLS
(-mi-p,.r-eable
-,,!.,bra,,e,;)
on November 10, 2019 by guest
http://jvi.asm.org/
[image:2.505.72.257.64.253.2]nal standard, i, canbe selected for which D is
known to have the value
Di.
Inthis caseequa-tion 4 (or 5) gives for the unknown D D =
Di (Vc/ V.i)x
(equation 7), where(Vc/Vci)K
isthe ratio of cross-flow rates at some fixed
value. We use the ratio of
Vc's
at constant Arather than the Xratiounder constant
experi-mental cross-flow,
Vc,
because surfacedis-turbances are expected tobe a function ofX
andtherefore comparable at a givenX value.
In practice, equation 6 iseasily used by
con-structingacurve ofXversus
VC
or1IVC
for theinternal standard i, thereby making available
the
Vci
value at any X value assumed bytheunknown.
MATERIALS AND METHODS
The flow FFF column and basic system have been previously described (9) (Giddings et al., Science, inpress). The channel dimensions usedin
this study were 44.0 by 1.1 by 0.038 cm, giving a volume of 1.84 ml, a volume verifiedbymeasuring the elution volume of a nonretained (void) peak.
Cellulose acetate membranes were used in this
study. Theywere cast on aporouspolypropylene frit by modifications of a standard method (12). The membranehadathicknessof 0.1 mm.
Thecarrier solution usedwas 0.02 Mphosphate bufferadjustedtopH7.12. This buffersolutionwas
fedintoboth the carrier and the cross-flow streams
by using two Cheminert metering pumps
(Labora-tory Data Control). The desired flow rate of the carrier stream was controlled by using a Nupro
needle valve after a UVdetector (Laboratory Data
Control).
Ferritin and bacteriophages Q8, MS2, f2, and
qX174werepurchasedfrom MilesLaboratories,Inc.
4OX174
asreceivedhad a concentration of 3 x 10'3to 4 x 10l3 particles/ml. The f2,MS2, andQ18viruseseach had aconcentration of 8 x 10¹⁴to 11 x 1014
particles/ml. Ferritin had a concentration of 72.4
mg/ml.
Samples of virus were injected into the carrier stream with aHamilton syringe. As little as 10 ,ug
couldbedetected, and samplesof as much asseveral milligramscould also beemployed.
Allexperiments werecarriedout at ambient
labo-ratory temperature, 24.6t0.5°C.The retention
vol-umeof the eluted virus samplewas measured by using a 10-ml buret. The fractogramwasrecorded
with an Omniscribe recorder (Houston Instru-ments).
RESULTS AND DISCUSSION
Foranynew class of solutematerials,such as
virusesinthe present study, the crucialtest of
the applicability of flow FFF is the positive
retention of solutecomponents beyond that of
theso-called "voidpeak." (The voidpeakis one
thatdoes not interact with thefieldorthat is
elutedinthe absence ofafield.)The retention
should increase smoothly asthe cross-flow
in-creases. Furthermore, the solutesmust not be
lost by adsorptionand should be elutedin
com-pactsymmetrical peaks.
These well-behaved retention requirements
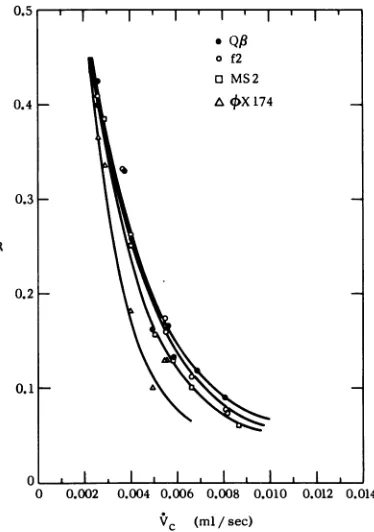
have beenobserved forviruses. Figure 2shows
the consistent trend among a group of four
viruses inhavingadecreasingretentionratio,
R, with increases in the volumetric rate of
cross-flow,
V,.
InthatparameterRisthe ratioof thevoid-peak elution volume(attime)tothe
elution volume (time) of the designated virus
peak; low R values indicate highretention.The
figure shows that R values downtoabout0.07
areobservedathigh cross-flows. This indicates
that the retention volumes up to about 1/0.07,
or approximately 14, times the channel void
volume can be systematically utilized. Sucha
high retention range is an advantage in
provid-ing elution "space" in which fractionation can
occur and in which characterization can be made selective and relatively accurate.
The adherence of experimental retention to
theory is an important consideration for
charac-terization workasopposedtosimple
fractiona-tion.Equation4suggeststhataplot ofXversus
0.4
H-0.3k
R
0.2
F-0 0.002 0.004 0.006 0.008 0.010 0.012 0.014
[image:3.505.255.442.334.600.2]VC (ml/sec)
FIG. 2. Systematic decrease in retention ratio, R
(equivalenttoasystematicincrease in retention
vol-ume),withincreasingvolumetric cross-flowrate,Ve, for four viruses. These plots indicate a systematic
controllable retention.
I I I I I I
* Qf
o f2
o3 MS2
A
OX
1740.1H
, 1 .
on November 10, 2019 by guest
http://jvi.asm.org/
134 GIDDINGS, YANG, AND MYERS
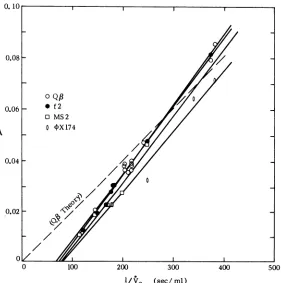
l/Veshould be astraight line passing through
the origin. Such a plotis shown in Fig. 3 for the
four viruses reported in the previous figure.
The solid lines are least-squares plots of the
experimental data. Thedashedline is that
pre-dicted by theory for virus
Q,8.
This line is basedon D = 1.61 x 10⁻⁷, a value taken from the
literature andcorrected to the temperature of
ourexperiments (2).
Figure 4 shows that the experimental data
follow the expected general trend, but are
anomalous in that they uniformly intercept the
1/iV axis at about 75 s/ml. This shows that
retention becomesabnormally large at high V,
(low
1/V,)
values.Several mechanisms can be postulated for
the nonzero intercept,but it mostlikely results
from some added component of retention for
those particles in thatimmediatevicinity ofthe
membrane. Reversible adsorption could give
this result, as well asa "trapping" process, in
whichparticles found in microscopic basins (or
evenlarge pores) are retarded because they are
removed from the normal flow streamlines that
impel them throughthe column.
Some insight into the anomaly is provided
byacomparisonof the retention of ferritin and 0.10
0.08
OQf 0.06 * f2
O MS2
A 0
PX174
Q,8
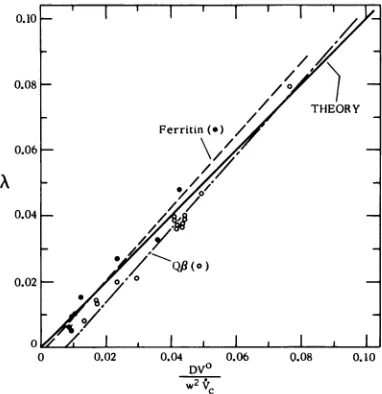
on the same column. The results are plottedin Fig. 4according to equation 4:XversusDV°/
Vcw2.
This form of the retention plot shouldyield a universal curve of zero inteceptand unit
slopeforallsolutes. To make thisplot,the D for ferritin, corrected to our temperature, was
takenas3.50 x 10-7cm2/s. This wascalculated
from sedimentation (16) and molecular weight
(11) data.
Figure 4shows that the least-squares line for
ferritin comes very close to intercepting the
origin. Thisimplies that the intercept anomaly
observed for virusesinFig.3isnotuniversal. It
suggests, but does not prove, a mild form of
reversible adsorption common to the viruses
employed.
Interestingly, the experimental slopes for
both ferritinandQ13inFig.4areabout 10% too
large. This suggests a systematic error inthe
measurementof some column parameter,
per-haps in VO or w2. Undoubtedly the membranes
change with use, affectingbothVO andw.
Fu-ture work should be directed atgaining accu-racy andstability inthese measurements, for
the inaccuracies willreflect themselves in
char-acterizationwork.However, calibration witha
singleknown component should beableto
elim-500
I/VC (sec/ml)
FIG. 3. Dataand least-squares plots ofXversus 1IiV, for fourviruses.
prediction for Q,3. The dashed line is a theoretical
J. VIROL.
on November 10, 2019 by guest
http://jvi.asm.org/
[image:4.505.137.418.343.626.2]FRACTIONATION
inate this uncertainty because of the simple
linearity and predictability of the plots.
Measurementof diffusion coefficients. The
nonzero intercept of viruses does not hinder
fractionation (in fact, it increases the
selectiv-ity), but it does require the development of a
newstrategy forcharacterizing virus
diffusivi-ties.This is apparent from Fig. 5, a plot of the
diffusion coefficient forQ(3calculated from the
experimental data using equation 6. The D
val-uesappear to vary as adistinctfunction of cross
flow,
V,.
Consequently, there is an uncertaintyof up to 50% in D if the data are employed
directly, without further refinement.
One approach to improving the accuracy in D lies in recognizing that the greatest departure
from theory occurs at high
V,'s.
Therefore, anextrapolation of the data to
V,
= 0 suggestsitself. The least-squares curve in Fig. 5
illus-trates this attempt. Unfortunately, this
ap-proach is hindered by the difficulty of gathering
meaningful data at low
V,
values; in thisex-treme, retentiongraduallyvanishes and small
errors in retentionvolume are reflected in
in-creasing errors in D.The least-squares
extrapo-lation, shown by the curve, yields
Do
= 1.72 x10⁻⁷ cm3/s. This is in fair agreement with the
correctedliterature value D = 1.61 x 10⁻⁷cm2/
s, noted earlier.
We should note that we have developed a
somewhatcomplicated model basedona
revers-ibleadsorptioneffect that isreasonably
consist-0.10 /
0.08
/// THEORY
Ferritin(*) / 0.06
0.04 /
0.02
a,0
(o0.02 ~_ IO#
0 0.02 0.04 0.06 DV°
2V
w c
0.08 0.10
FIG. 4. Comparison of ferritin and Q13 ina
'uni-versal"plot of versus DV2Iw2Vc (see equation 4).
Forferritin,V=5.3 -6.3ml/h; forQ,B,V=3.3-9
ml/h. Thesolid line is theoretical; the dashedlines
areleast-squaresplots from the data.
1.8
1.6
1.4
u
1-.
E
r-0 x
a 1.2
1.0
0.8
0.6
0.4
0.2
0 1 2 3 4 5 6
c x103 (ml/sec)
FIG. 5. CalculatedDvaluesas afunction of
volu-metriccross-flow rate,Vt. The horizontal line
repre-sentsaliterature value(15). The arbitrarycurveD =
Do+aV,+ bVc+ bV'2,fit by leastsquares,permits
theextrapolation of the datatoV, =0. ThisgivesDo
=1.72 x10⁻⁷cm2/s(a =3.04 x10² andb = -1.86
x10-2). Channel flow,V,variedfrom3.3to9mlIh.
entwith the data and leadsto D = 1.55 x 10⁻⁷
forQf3.
The other approach to handling the
depar-ture from theory has already been outlined: a
reference such as
Q,8
is used. The parallelbe-havior of the four viruses shown in Fig. 3
en-courages such an approach. The application of thisconceptrequirestheconstructionofan
em-pirical curve of versus Vi, as noted in the
theory section.Thiscanbe doneusingthedata
already presented. With this and the
applica-tion of equation 7, the results of Fig. 6 are
produced forthe threeremainingviruses. The
valuesarefairlyself-consistent and drift
down-ward onlyslightly with large increases in
V,.
Theextrapolationback toV, = 0yieldsD
val-ues of 1.60, 1.49, and 1.39 x 10⁻⁷ for f2, MS2,
and 4X174, respectively, at our experimental
temperatureof24.6°C.
Comparisonswith literature dataareshown
inTable 1. The data have been reducedtoour
operating temperature, 24.6°C.ThetwoD's for
theprimarystandardQj3 obtainedin thisstudy
aresomewhatinconsistent,butfall in thesame
I I - 1 J I
0 0 LITERATURE
--VAL-UE-LEAST
_ ~~~~~SQUARE _
PARABOLIC REGRESSION
I
135 21, 1977
on November 10, 2019 by guest
http://jvi.asm.org/
[image:5.505.250.442.50.330.2] [image:5.505.46.237.410.607.2]136 GIDDINGS, YANG, AND MYERS
1.8 1.6 1.4
1.2
E
IC
x
1.01 0.81 0.6 0.4
0.2
0 1 2 3 4 5 6 7 8
X103 (ml/sec)
FIG. 6. Least-squares linesforthediffusiondataacquired by applyingtheinternal standard methodof equation 7.The internal standardis Q/3.
TABLE 1. Comparison of diffusion coefficientsfrom
the literature andfromthisstudy
Phage XMol10-6wtg D24.6.cm2/sX 107 Reference
Q13
4.55 ±0.16 1.61 24.2 1.75 15
1.72 This worka 1.55 Thisworkb
MS2 3.6 1.85 15
3.6 1.99 18c
5.3 ±0.6 1.31 13
1.49 Thisworkd
f2 1.60 Thisworkd
OX174 6.2 1.79 17C
1.39 Thisworkd
a Byextrapolation to
V,
= 0.bBy using the model for reversible adsorption
notedinthe text.
cCalculated by using the sedimentation
con-stant.
dInternal standard method;Q,B =reference.
range as the literature values. However, we
have,asnoted,used the value from reference 2,
1.61 x 10⁻⁷ cm2/s, as the primary standard
value inderiving the subsequentD's.
Theremainingdiffusion coefficients obtained
inthis work tend toward the low sidein
com-parison with the limited data. However, the
paucity ofthe data and its scatter disallow a
rigorousevaluationatthis point. Improvement
inthe flowFFFmethodshould leadnotonlyto
gainsinreliability but alsotoreliabilitychecks
fromtheself-consistency ofthedata itself.
Figure 7illustrates the separationof
Q3
and P22virusesfromeach other and from albumin. It is obvious that any salts or contaminantswithmolecularweightsaslow as orlower than
Voidpeak
P22 Virus
0 10 20 30 40 50
ELUTIONVOLUME (ml)
FIG. 7. Theseparation of albumin, Q/3, and P22 byflowFFF. V =8mlIh; V, =22.1 ml/h.
that of albumin would be removed from the
virusesduring fractionation.
Most FFF systems so far tested have
dis-played peak widths thataremuchbroader than
the theoretical values(9). This istrueinthese studies as well, with the departure ranging
f2 (0)
0~~~~~~~~0
o 00~~~~~~
- MS 2 (o) 'X 174(0)
J. VIROL.
on November 10, 2019 by guest
http://jvi.asm.org/
[image:6.505.132.430.63.221.2] [image:6.505.71.264.275.488.2]from 50% to a factor of 4 or more. Efforts are
being made to eliminate this discrepancy; if
successful, the method promises to be much'
more versatile than now in separating virus
mixtures at high resolution.
We nextinvestigated the question of whether
sample size can be scaled up to a level that
might be useful in subsequentstudies with the
viruses. When characterization by means of
re-tentionparameters is the objective, it is best to
work at the smallest sample size consistent
with gooddetectability to assure linear
behav-iorof the particles in the channel. To meet this
objective, we ordinarily used samples of 3 to 5
pi
containing, in the case ofQ,8,
25to 41 ,ugofvirus (8.2 g of virus/liter). However, in this
study, sample size was studied over a much
broader range, from 8.2 ug to4mg,by varying
the sample volume. Figure8shows theeffectof
the amount of
Q,3
virus on theelution volumeof thepeak.The effect is,infact,veryslight, as
indicated by the least-squares line shown in the
plot: a minor tendency to speed elution with
increased sample size is the only trend
ob-served. This indicates thatfairly large samples
canberunwithout a seriousdisturbance of the
[image:7.505.249.441.237.382.2]retention.
Figure 9shows how sample size affects peak
width. Bothplate height (a conventional
meas-ureof peak width inchromatographic-like
sys-tems [3]) and relative peak width are shown.
Both are based on width at peak half-height.
Also given is the theoretical value for plate height, indicating the improvement potentially
possible inflowFFFsystems. (Peakwidth
var-ies as thesquare root of plateheight.)
It is clear from Fig. 9 that the peak width
begins to increase noticeably with sample size
at about 0.5 mg and then increases rapidly
beyond 1 mg. At 4 mg of
Q,3,
peak width isalmost70%greaterinmagnitudethanatsmall
sample sizes. This eventual deterioration of
peak sharpness probably constitutes the
ulti-2
-3
12 300
2 2(X)
(.M) 0.1 t1
AM YNT|NrOFQQVIRUS (ng)
FIG. 8. Dataforelution volumeversusmilligrams
ofQ,8virus, alongwith least-squares line.
Parame-ters:V=5.8ml/h; V, =17.7ml/h; VO =1.85ml;R
= 0.2.
matelimitonuseful sample size.
Finally, to check the possible value of peak
area for use inquantitative analysis, Fig. 10 is
plotted to show relative area (adjusted for
re-corder attenuation)versus amount. Areaswere
measuredby cutting thepeaksoutof thestrip chart and weighing them.
Linearity would be indicated by a straight
line of unit slope. Such a line isplotted in the
figure. The agreement of the data is fair,
al-though moderately distorted and scattered.
This can probably beattributed to thedifficulty
of locating the base linepreciselyand the
non-linearity of the signalfrom the UVdetectorat
high sample loads.
It should benoted that the qualitative
analy-0.10 1
[image:7.505.251.445.443.635.2]AMOUNT OFQ#BVIRUS (mg)
FIG. 9. Effect of samplesize onplate heightand relative peak width. The low theoreticalvalue
indi-catesthepotential oftheflow FFFmethod.
Experi-mentalconditions are the sameasthosedescribed in the legend to Fig.8.
En
._ .3
.0
-:
(ml) m
AMOUNT OFQ,8VIRUS (mg)
FIG. 10. Peak area versus sample size. The
pro-portionalityneededforquantitativeanalysisis indi-catedby the solid lineofunitslope.
21, 1977
on November 10, 2019 by guest
http://jvi.asm.org/
[image:7.505.45.239.521.627.2]138 GIDDINGS, YANG, AND MYERS
sisoridentification(asopposedtoquantitative
analysis)of viruses is implicitinthe
reproduci-bleretentionshowninFig. 2. This role is
rein-forced by the association thatcanbemade with
virusdiffusivity.
In conclusion, the potential use of flow FFF in separating, purifying, identifying, quanti-tating, and characterizing diffusivity in virus systemshas been established. The method is in
an early stage ofdevelopment and, therefore,
still beset with anomalies. Still, even in this
initial applicationtoviruses, areasonable
util-ity is apparent. Withfurther refinements of the
method,anexpanded applicabilitycanbe
antic-ipated. The presentworkshouldserve to
intro-duce themethod and its approachestoworkers
concerned withthisimportant areaof research.
ACKNOWLEDGMENTS
We would like to thankSherwood Casjens of the Depart-ment of Microbiology, University of Utah, for valuable advice, data,and thesupplyofP22virussamples.
This research was supported by Public Health Service grantGM 10851-19 from the National Institute of General Medical Sciences.
LITERATURE CITED
1. Caldwell, K. D., L. K. Kesner, M. N. Meyers, and J. C. Giddings. 1972. Electrical field-flow fractionation of proteins. Science1976:296-298.
2. Camerini-Otero, R. D., P. N. Pusy, D. E. Koppel, D. W. Schaefer, and R. M. Franklin. 1974. Intensity fluctuation spectroscopy of laser light scattered by solutions of spherical viruses: R17, Qf8, BSV, PM2, and T7. II. Diffusion coefficients, molecular weights, solvation, and particle dimensions. Biochemistry 13:960-970.
3. Giddings, J. C. 1965. Dynamics of chromatography, part 1. Principles and theory. Marcel Dekker, New York.
4. Giddings,J. C. 1966. A new separation concept based on acoupling of concentration and flow nonuniformities. Sep.Sci. 1:123-126.
5. Giddings,J. C. 1973. The conceptual basis of field-flow fractionation. J. Chem. Educ. 50:667-669.
6. Giddings, J. C., L. K. Smith, and M. N. Myers. 1975.
Thermal field-flow fractionation: extension to lower molecular weight separations by increasing the liq-uid temperature range using apressurized system. Anal. Chem. 47:2389-2394.
7. Giddings,J.C., F. J. F.Yang,and M. N.Myers.1974. Sedimentationfield-flow fractionation. Anal. Chem. 46:1917-1924.
8. Giddings, J. C., F.J. Yang, and M. N. Myers. 1975. Application of sedimentationfield-flowfractionation tobiological particles: molecularweights and separa-tion. Sep. Sci. 10:133-149.
9. Giddings,J. C., F. J. Yang, and M. N. Myers.1976. Theoretical and experimental characterization of flow field-flow fractionation. Anal. Chem. 48:1126-1132.
10. Grushka, E., K. D.Caldwell, M. N. Myers, and J. C. Giddings. 1974. Field-flow fractionation, p. 127-151. In E.S. Perry, C. J.VanOss, andE.Grushka(ed.), Separation and purification methods. Marcel Dekker, New York.
11. Harrison, P. M. 1959. The structures of ferritin and apoferritin: some preliminary x-ray data. J. Mol. Biol. 1:69-80.
12. Lakshminarayaniah, N. 1969. Transport phenomena in membranes. Academic Press Inc., New York. 13. Moller, W. J. 1964. Determination ofdiffusion
coeffi-cientsand molecularweightsof ribonucleic acidsand viruses. Proc. Natl.Acad. Sci. U.S.A. 51:501-508. 14. Myers, M. N., K. D.Caldwell, and J. C.Giddings. 1974.
Astudy of retentioninthermalfield-flow fractiona-tion. Sep. Sci. 9:47-70.
15. Overby, L. R., G. H. Barlow, R. H.Doi, M. Jacob, and S.Spiegelman.1966.Comparisonof twoserologically distinctribonucleicacidbacteriophages.I.Properties of the viralparticles.J.Bacteriol.91:442-448. 16. Rothen, A. 1944. Ferritinand apoferritininthe
ultra-centrifugestudies on therelationshipof ferritinand apoferritin: precision measurementsof the ratesof sedimentation of apoferritin. J. Biol. Chem. 1952:679-693.
17. Sinsheimer, R. L. 1959. Purification andpropertiesof bacteriophageOX174.J.Mol. Biol. 1:37-42. 18. Strauss, J.H., Jr., and R. L. Sinsheimer. 1963.
Purifi-cationandpropertiesofbacteriophageMS2andof its ribonucleicacid. J. Mol. Biol. 7:43-54.
19. Thompson, G. H., M. N. Myers, and J. C. Giddings. 1969.Thermal field-flow fractionation ofpolystyrene samples.Anal. Chem. 41:1219-1222.
20. Yang,F.J.F., M. N. Myers, and J. C.Giddings.1974.
Programmed sedimentation field-flow fractionation. Anal.Chem. 46:1924-1930.
J. VIROL.
on November 10, 2019 by guest
http://jvi.asm.org/