IAC–17–C2.4.6
Multi-dimensional Ablation and Thermal Response Program for Martian Entry Analysis
Viola Renato1 and Thomas Scanlon1
1Aerospace Centre of Excellence, University of Strathclyde, Glasgow, Scotland, United Kingdom
Abstract
A new method to simulate ablative Thermal Protection System (TPS) behaviour during an atmospheric entry is presented. The approach consists of the coupling of two reduced order codes: one for the material behaviour prediction and one for the external heat flux estimation. The latter is a reduced order aero-thermodynamic code developed at Strathclyde University while the internal solver is a unidimensional thermo-ablative code. The three-dimensional spacecraft calculations are generated by running the one-dimensional ablative code on every geometrical vertex. This method produces an estimation of the 3D problem solution while avoiding the complexity of a multidimensional thermo-ablative solver. The test case analysed to prove the method efficacy is the entry of the Pathfinder capsule in the Martian atmosphere.
Keywords: Ablation, Thermal Protection, Modelling, Re-Entry
Nomenclature
A : pre-exponential constant,s−1 B0 : dimensionless mass blowing rate CH : Stanton number for heat transfer
CM : Stanton number for mass transfer
cp : specific heat,J/kg-K
E : activation temperature,K F : view factor
h : enthalpy,J/kg
h : partial heat of charring,J/K ˙
mg : pyrolysis gas mass flux,kg/m2s
qrad : radiative heat flux,W/m2
qcond : conductive heat flux,W/m2
˙
S : surface recession rate,m/s T : temperature,K
t : time,s u : velocity,m/s x : space coordinate,m αw : surface absorption
: surface emissivity
k : thermal conductivity,W /m-K ρ : density,kg/m3
σ : Stefan-Boltzman constant,W/m2-K4
τ : virgin mass fraction
ψ : decomposition reaction order
Subscripts
c : charred
e : boundary layer edge g : pyrolysis gas
i : i component v : virgin w : wall
Introduction
In space missions, the atmospheric entry phase presents a critical challenge for the spacecraft de-sign due to the extreme external temperatures that the spacecraft must endure. Thermal protection sys-tems (TPS) are required to prevent any damage to the spacecraft, its internal components or passengers. TPS are generally divided into two major categories: reusable and non-reusable. Ablative materials are part of the latter group and they are very common and highly reliable. These materials perform their task through the pyrolysis phenomenon: an endother-mic process that consumes external thermal energy to generate a change of state in the material itself, lead-ing to material degradation. This process is complex and not trivial to simulate. Nevertheless, a consid-erable number of ablative material behaviour predic-tion tools exist and these tools are widely applied in space research and industry. One of the most accu-rate ways to perform thermal protection analyses is to consider both the internal and external thermal en-ergy balances and examine how the two interact with each other. The external analysis is generally per-formed by a CFD solver which can produce highly precise results however it can be computationally de-manding. In the present approach the aerodynamics simulations are performed by a reduced order code, Hyflow [1].
simulate a passage in an atmosphere different from Earth’s and because Mars is currently a very impor-tant topic in the space field. There are many Martian missions in various design phases, manned and un-manned, and the ability to simulate an approximated but close to reality, three dimensional behaviour of the TPS in a Mars entry could give a significant ad-vantage in the selection of the most efficient TPS so-lutions for any of those missions. Analyses on similar test cases and on the exact mission studied in this pa-per are present in the literature; the majority of these evaluations are carried out employing codes that can perform very accurate two or three dimensional abla-tive simulations; in addition, they are often coupled with CFD solvers which evaluate the external envi-ronmental conditions during the entry.
The adoption of highly accurate tools improves the precision of the studies but also increases the com-putational resources required, which can be counter productive in the preliminary phases of a mission de-sign when it is necessary to preform a great variety of calculations in order to evaluate the best solu-tion to meet the mission requirements. Olynick et al [2] used the flow solver GIANTS for the air pre-diction and FIAT for the material behaviour estima-tion; the same codes were employed by Milos et al [3] for part of the Pathfinder analyses presented in their paper. Martin and Boyd [4] presented results gen-erated with LeMANS (Unstructured Tridimensional Navier Stokes Solver for Hypersonic Nonequilibrium Aerothermodynamics) and MOPAR as the material response code.
Material Response code Degradation process
The pyrolysis phenomenon is manifested through a change of state in the material during which its density decreases and the material undergoes a degradation[5]. The code employed in this paper presents a three components degradation model to better imitate the real behaviour of the ablative ma-terial. The material density is calculated using Eq. 1, where the subscripts A and B refer to the resin filler components, the letter C refers to the reinforc-ing material and Γ is the volume fraction of the resin. ρ= Γ(ρA+ρB) + (1−Γ)ρC. (1)
The pyrolysis process is described by an Arrhenius equation for each component:
∂ρi
∂t =Ai
ρi−ρic
ρiv−ρic !φi
e−Ei/T. (2)
where Ai, Ei, φi, ρiv, ρic are respectively the
pre-exponential factor, activation energy, decomposition reaction order, virgin and charred density for the component i=A,B,C. The terms in Eq. 2 are empir-ically estimated using thermal gravimetric analysis (TGA)[6].
In-depth energy equation
The following equation describes the internal ex-changes of energy in the TPS thickness,
ρcp ∂T ∂t = ∂ ∂x k ∂T ∂x !
+(hg−h)
∂ρ ∂t+ ˙Sρcp
∂T ∂x+ ˙mg
∂hg
∂x (3) the terms forming Eq.3 can be interpreted as: rate of storage of sensible energy, net rate of thermal conduc-tion, pyrolysis energy rate, convection rate of sensible energy due to coordinate system movement, and net rate of energy convected with pyrolysis gas passing a point. The thermal conduction and the pyrolysis en-ergy rate are the only terms which are implemented in this approach, the other two terms in Eq. 3 are ne-glected in order to decrease the computational time required to complete the simulations. This procedure introduces some errors in the estimated results, how-ever these errors do not appear to greatly decrease the result accuracy as it will be shown in the results section.
The local specific heat is a function of both virgin and charred specific heat values and the local charring state; it is formulated as shown in Eq. 4.
cp=τ cpv+ (1−τ)cpc. (4)
where τ represents the virgin mass fraction. The thermal conductivity k is evaluated by applying the equivalent equation.
Boundary conditions
The external surface energy balance is calculated using the equation:
ρeueCH(Hr−hw) +ρeueCM[Σ(zie∗ −z∗iw)h Tw
i −B 0h
w]
+ ˙mchc+ ˙mghg+αwqrad−F σwTw4−qcond= 0.
some errors and decreases the precision of the gener-ated results; nevertheless the result accuracy is high enough to give a good understanding of all the phe-nomena involved and their roles influencing the ma-terial responses, as it will be illustrated in the next sections when the calculations produced by the pre-sented approach are compared against validated code results.
Pyrolysis gas and Char production
During the degradation, the material decreases its density and produces pyrolysis gases. The assump-tion utilized in this approach is that the whole mass equivalent to density decrease is transformed into py-rolysis gases and that all the produced gas exits the material each time step. Following these assumptions the mass flow rate of the pyrolysis gas can be evalu-ated as follows [7]:
˙ mg=
1 A
Z xw
x0 ∂ρ ∂t ! A∂x. (6) Blowing correction
The blocking effect due to the exiting of the pyrol-ysis gas is introduced through the correction of the heat transfer,CH according to the equation[5]:
CH
CH0
= ζ
eζ−1 (7)
ζ= 2λ(mg+mc) ρUeCH0
(8) where λ is equal to 0.5 in the classical blowing cor-rection formula [5].
Aero-Thermodynamic Model
A Strathclyde internally developed code, HyFlow, is used instead of a more commonly used CFD tool. This aero-thermodynamic model is employed to eval-uate the external heat flux and to estimate the value of the heat transfer coefficient. HyFlow is based on a combination of compression and expansion panel methods: it uses simplified equations and analogies to perform aero-thermal predictions of the heat flux values during hypersonic flight. The simulations are performed under the assumption of thermally and calorically perfect gas and the solver has the capa-bility to generate estimations for both high altitude with free-molecular flow conditions and lower alti-tudes characterized by continuum flow. The heat flux is calculated by employing the flat plate reference temperature method for evaluating the skin friction.
This method adopts an analogy based on the similar-ity between friction and heating mechanisms, called the Reynolds analogy[8]. A different methodology is implemented at the stagnation point for the reason that this analogy is not valid around this particular point. Instead, the Fay-Riddell [9] formula to calcu-late the convective heating rate for three-dimensional stagnation points is employed. This method evalu-ates the convective heating rate starting from the ve-locity gradients in both the streamwise and crosswise directions.
In the current development of the coupled approach the data that is communicated by the thermal re-sponse code to the aerodynamic solver is solely the surface recession values on the different vertices; thus only the changes in geometry during the trajectory influence the aerodynamic code. Other phenomena caused by the material ablation (e.g. blocking, pyrol-ysis gas flux) are not part of the shared data between codes therefore can not impact HyFlow simulations. These ablation effects do influence the aerodynam-ics but their influence is neglected in the current ap-proach.
Code coupling
geome-Table 1: Martian atmosphere properties used in HyFlow
γ cpv R Pr
1.33 730 192 1
Fig. 1: Front and side representation of the Pathfinder geometry as it is utilised for the simulations in this paper.
try and because the number of vertices is inferior to the number of panels making the simulation faster.
Results
The Pathfinder probe performed a successful land-ing on Mars surface in 1997. The aerodynamic code applied in the approach herein presented has performed different Earth atmosphere simulations [1],[10] but this was the first Martian test case that the method has been applied to. Mars and Earth atmospheres differ greatly from one another, both in their composition and in their physical characteris-tics. HyFlow has the ability to simulate any atmo-sphere given the right properties, Table 1 summarizes the characteristics employed by the code to perform the simulation and the values that were selected to describe the Martian atmosphere. The capsule ge-ometry is illustrated in Fig. 1, the forebody heat shield is formed by the SLA-561V material and has a thickness of 1.9 cm. The rest of the heat shield is composed of different materials and thickness; be-cause studies for the leeward surfaced were not found in literature by the authors, it was decided to use the more simplified case and employ the same mate-rial with the same thickness for the entire geometry.
30 40 50 60 70 80 90 100 Time [s]
0 20 40 60 80 100 120
Heat Flux [W/cm2]
[image:4.612.317.540.96.254.2]HyFlow Milo et al
Fig. 2: Comparison of the heat flux as a function of time in the stagnatiuon point between the estima-tion presented by Milos et al [3] and the values calculated by the code heriein presented.
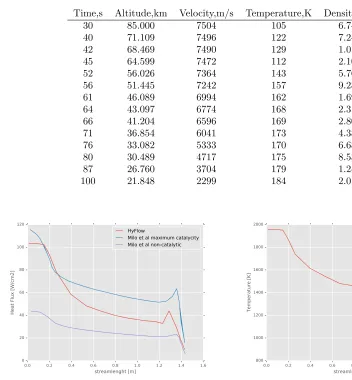
[image:4.612.85.289.120.313.2]Table 2: Time instances for the re-entry trajectory.
Time,s Altitude,km Velocity,m/s Temperature,K Density, kg/m3
30 85.000 7504 105 6.74E-07
40 71.109 7496 122 7.24E-06
42 68.469 7490 129 1.01E-05
45 64.599 7472 112 2.10E-05
52 56.026 7364 143 5.76E-05
56 51.445 7242 157 9.28E-05
61 46.089 6994 162 1.69E-04
64 43.097 6774 168 2.31E-04
66 41.204 6596 169 2.80E-04
71 36.854 6041 173 4.38E-04
76 33.082 5333 170 6.68E-04
80 30.489 4717 175 8.53E-04
87 26.760 3704 179 1.24E-03
100 21.848 2299 184 2.01E-03
0.0 0.2 0.4 0.6 0.8 1.0 1.2 1.4 1.6 streamlenght [m]
0 20 40 60 80 100 120
Heat Flux [W/cm2]
HyFlow
Milo et al maximum catalycity Milo et al non-catalytic
Fig. 3: Heat flux profiles along the capsule as pre-sented in the papare by Milos et all [3] and as evaluated during this study for the time of peak heat flux.
time of peak heat flux as evaluated by the current ap-proach and as calculated by the reference paper for the case of maximum catalycity and the non catalytic case. The methodology used presents results inside these two extremes cases. The differences in the lo-cation of maximum value for the shoulder portion of the capsule can be attributed to the mesh; HyFlow is highly dependant on the mesh distribution and the mesh size, a more refined mesh could give closer re-sults but it was decided not to increase the number of mesh panels for two main reasons. Firstly, because the authors were satisfied with the level of precision of the results and secondly, to avoid an increase in the
0.0 0.2 0.4 0.6 0.8 1.0 1.2 1.4 1.6 streamlenght [m]
800 1000 1200 1400 1600 1800 2000
Temperature [K]
external_temperature
Fig. 4: Temperature profiles along the capsule as evaluated during this study for the time of maxi-mum external temperature.
0.0 0.2 0.4 0.6 0.8 1.0 1.2 1.4 1.6 streamlenght [m]
0.0000 0.0005 0.0010 0.0015 0.0020 0.0025
recession [m]
[image:6.612.75.299.95.255.2]recession
Fig. 5: Recession profiles along the capsule as evalu-ated during this study at the end of the simulation.
present in the next section in comparison with a dif-ferent test case. The test case herein presented is axi-symmetrical thus a simpler two dimensional eval-uation can produce the same outcomes regarding the TPS behaviour as a three-dimensional one; neverthe-less, real atmospheric entries are not perfectly axi-symmetric. To the authors knowledge, fully coupled three-dimensional simulations of the external envi-ronment and the thermo-ablative internal material behaviour are not currently available in the litera-ture due to the computation time required. A non axi-symmetrical case can be simulated by the dis-cussed approach with the same simplicity of an axi-symmetrical case. The following section illustrates the changes that the introduction of an angle of at-tack can produce in the heat flux and temperature trends and why it is important to be able to simulate it.
Non axi-symmetrical case
[image:6.612.363.525.124.248.2]One of the features of the proposed approach is the ability to produce three dimensional approxi-mated results. Unfortunately, to the authors knowl-edge, there are no three dimensional evaluations of the Pathfinder entry in literature. The results that have been used in the previous section to compare against were generated simulating in two dimensions an axi-symmetrical test case. However most capsules entering a planetary atmosphere do not have their axis of symmetry perfectly parallel to the velocity vector for the entire duration of the trajectory. The difference of angle in this case could lead to some serious consequences if the leeward surface, which is shadowed in the axi-symmetric case, is exposed to
Fig. 6: Representation of the streamline. The upper half of the image represents the axi-symmetric case whlie the lower part illustrates the case with an angle of attack equal to 15 degrees.
sec-(a) The upper half of the image represents the axi-symmetric case whlie the lower part illustrates the case with an angle of attack equal to 15 degrees.
(b) The right part of the image represents the axi-symmetric case while the left side illustrates the case with an angle of attack equal to 15 degrees.
Fig. 7: Three dimensional representation of the heat flux at the time of peak heat flux for the geometry surface
(a) The upper half of the image represents the axi-symmetric case while the lower part illustrates the case with an angle of attack equal to 15 degrees.
(b) The right part of the image represents the axi-symmetric case while the left side illustrates the case with an angle of attack equal to 15 degrees.
Fig. 9: Three dimensional representation of the suface recession at end of the trajectory for the geometry surface
tion of the capsule instead of half of the forebody section used in the axi-symmetric case. However this would highly increase the number of cells of the mesh, greatly increasing the computational time. The ap-proach presented in this paper is to always perform three dimensional calculations of the atmospheric en-try, therefore the symmetry of the flux or the lack of this symmetry does not influence the computational time. Consequently complex, non symmetric cases are just as easy to simulate as non symmetric ones.
Conclusions
The coupling of the material response code and the aero-thermodynamic model has been used to simu-late a Martian atmosphere entry. The heat flux val-ues along the trajectory have been evaluated and the ablative TPS behaviour has been computed. The comparisons presented in this paper show that the approach used produces results in good agreement with evaluations generated with more complex tools. The two coupled codes, which were already verified for Earth re-entry [10], are shown to be capable of performing simulations for the Martian atmosphere. Although the precision of the results is lower than the results produced with CFD tools or fully two dimen-sional ablative codes; nevertheless the evaluations are precise enough to give a good understanding of the external flux and internal material behaviour; espe-cially in the preliminary phases of the mission design. Moreover, the simulations performed with this
ap-proach are not too computationally demanding; the simulation time depends on the number of trajectory points to evaluate, the total entry time and the mesh dimension. For the analyses herein presented the tra-jectory is divided into 14 points, its total duration is 70 s and the mesh is composed of 1242 vertices; the running time for a complete simulation is 22 minutes.
References
[1] Romain Wuilbercq. Multi-Disciplinary Mod-elling of Future Space-Access Vehicles. PhD the-sis, Strathclyde University, 2015.
[2] David Olynick, Y.-K. Chen, and Michael E. Tauber. Aerothermodynamics of the Stardust Sample Return Capsule. Journal of Spacecraft and Rockets, 36(3):442–462, May 1999.
[3] Frank S. Milos, Y.-K. Chen, William M. Cong-don, and Janine M. Thornton. Mars Pathfinder Entry Temperature Data, Aerothermal Heat-ing, and Heatshield Material Response. Journal of Spacecraft and Rockets, 36(3):380–391, May 1999.
[5] Carl B. Moyer and Mitchell R. Wool. Aerotherm Charring Material Thermal Response and Ab-lation Program, Version 3. Volume 1. Program Description and Sample Problems. Techni-cal report, AEROTHERM CORP MOUNTAIN VIEW CA, 1970.
[6] Bernard Laub, Yih-Kanq Chen, and John Dec. Development of a High-Fidelity Ther-mal/Ablation Response Model for SLA-561v. American Institute of Aeronautics and Astro-nautics, June 2009.
[7] Y.-K. Chen and F. S. Milos. Two-Dimensional Implicit Thermal Response and Ablation Pro-gram for Charring Materials. Journal of Space-craft and Rockets, 38(4):473–481, July 2001.
[8] W. L. Hankey. Re-entry aerodynamics. Amer-ican Instituteof Aeronautics and Astronautics,, Washington, DC, 1988.
[9] H. H. et al Hamilton. Approximate Method of Calculating Heating Rates at General Three-Dimensional Stagnation Points During Atmo-spheric Entry. 1982.
[10] V. Renato, T. Scanlon, and R. Brown. Multi-dimensional ablation and thermal response pro-gram for re-entry analysis. 31st International Symposium on Space Technology and Science, 2017.
![Fig. 2: Comparison of the heat flux as a function oftime in the stagnatiuon point between the estima-tion presented by Milos et al [3] and the valuescalculated by the code heriein presented.](https://thumb-us.123doks.com/thumbv2/123dok_us/1484836.101140/4.612.85.289.120.313/comparison-function-oftime-stagnatiuon-presented-valuescalculated-heriein-presented.webp)