Short communication
The influence of long-term inputs of catch crops and cereal straw
on yield, protein composition and technological quality of a spring
and a winter wheat
Ingrid K. Thomsen,1* Marie-Franc¸oise Samson,2Marina Carcea3& Valentina Narducci3
1 Department of Agroecology and Environment, Faculty of Agricultural Sciences, Aarhus University, PO Box 50, DK-8830 Tjele, Denmark 2 INRA, UMR1208 Inge´nierie des Agropolyme`res et Technologies Emergentes, F-34060 Montpellier, France
3 National Research Institute on Food and Nutrition-INRAN, Via Ardeatina 546, 00178 Roma, Italy
(Received 21 June 2010; Accepted in revised form 22 September 2010)
Keywords Animal slurry, clover, gluten proteins, nitrogen, ryegrass.
Introduction
Under conditions of restricted nitrogen (N) input such as in organic farming systems, crop N uptake must rely on N mineralised from applied animal manure, crop residues and native soil organic matter. Scarcity of N may impede the production of quality grain for bread production, and input and retention of N in soil are therefore important parameters for soil fertility. To retain N in the crop-soil system, catch crops may be grown in breaks between main crops where they provide a significant sink for N mineralised in late summer and autumn (Thomsen, 2005). Incorporation of straw may likewise retain mineralised N by microbial immobilisa-tion (Christensen, 1986) and will also directly add to the N mineralisation potential when the N supplied in the straw accumulates (Thomsen & Christensen, 2004).
Under northern European conditions, winter wheat may generally be of lower quality than spring wheat, but winter wheat has a higher yield potential. When the N uptake is mainly based on N mineralised from either applied or indigenous soil organic matter, however, this may even out the quality difference between winter and spring wheat as the longer growing season of winter wheat may boost its N utilisation. Growing conditions are highly important for protein quantity whereas mainly genetic factors influence protein composition (Ames et al., 1999; Luo et al., 2000). Wheat grain proteins have been classified as albumins, globulins, gliadins and glutenins on the basis of their solubility (Osborne, 1907). Reverse-phase (RP) high performance liquid chromotography (HPLC) allows the quantitative determination of these different flour protein groups
together with single proteins (x5-, x1,2-, a-, c-type gliadins, x- and y-type high (HMW) and low (LMW) molecular weights subunits of glutenin) (Wieser & Seilmeier, 1998). The proteins can also be divided into polymers (glutenins) or monomers (gliadins, albumins, globulins) based on their aggregating properties. The polymeric proteins are critical for governing wheat flour processing properties, and their quantity and size distribution reliably measured by size-exclusion (SE) HPLC techniques have been shown to be important indicators of baking quality (Dachkevitch & Autran, 1989; Bateyet al., 1991). The aim of this study was to examine whether wheat yield and baking quality deter-mined by chromatographic techniques together with rheological and chemical quality measurements could be improved by combining agronomic strategies consisting of wheat cultivars and long-term organic matter inputs. The variables tested were (A) a winter wheat and a spring wheat cultivar, (B) three catch crop strategies and (C) four straw incorporation rates.
Materials and methods
The wheat experiment took place on a light sandy loam (11% clay) at Askov Experimental Station (5582¢N, 0906¢E). The basic experimental treatments, initiated in 1981, included four rates of annual straw incorporation (0, 4, 8 and 12 t ha)1year)1) combined with three catch crop strategies. From 2003, the three catch crop strategies were no catch crop, an annual ryegrass (Lolium perenne L.) catch crop and an annual rye-grass + clover (Trifolium repens L.) catch crop. See Thomsen (1995) and Thomsen & Christensen (2004) for further details on the experiment.
The plots assigned to winter wheat were ploughed on 17 September 2007 and winter wheat (cv. Tommi) sown
*Correspondent: Fax: +4589991200; e-mail: [email protected]
Archived
at
on 18 September. The plots for spring wheat were ploughed on 5 March 2008 and spring wheat (cv. Vinjett) sown on 24 April. The wheat crops received about 70% of the standard N application for conven-tional bread wheat production in pig slurry in spring. This amounted to 143 kg NH4-N ha)1 (177 kg to-tal N ha)1) to winter wheat and 90 kg NH4-N ha)1 (130 kg total N ha)1) to spring wheat. The winter wheat was harvested on 31 July and the spring wheat on 16 August 2008.
Grain dry matter was determined by drying subsam-ples for 24 h (80C). All grains were rinsed for impurities and analysed for total N using a LECO CNS-1000 analyser. Total protein in grains was deter-mined using a conversion factor of 5.7. Quality param-eters and gluten protein composition were determined on the three replicates from the treatment with 4 t straw ha)1year)1combined with all catch crop treatments (18 samples). These were analysed for dry gluten and gluten index according to ICC Standard no. 155 (ICC, 2003) and ash content according to the ICC Standard no. 104⁄1 (ICC, 2003). Falling number was determined according to ICC Standard no. 107⁄1 (ICC, 2003) and Zeleny index by the ICC Standard 116⁄1 (ICC, 2003). All analyses were done in duplicate.
For the SE-HPLC analysis, SDS-soluble proteins were extracted with a phosphate-SDS buffer according to Morel et al. (2000) with slight modifications. The SDS-soluble proteins were divided into five fractions (F1–F5) according to Dachkevitch & Autran (1989), where F1 and F2 include the largest and smallest glutenin macropolymers, F3 includes x-gliadin and b -amylase (Samson & Morel, 1995), F4 includes c+b+a gliadins, and F5 includes water- and salt-soluble protein together with traces of a-gliadin. Fi corresponds to the area under the chromatogram for proteins extracted from the pellet by sonication. The gliadin to glutenin ratio was estimated from the ratio of F4 to (Fi+ F1 + F2). The percentage of unextractable polymeric protein (UPP) in the total polymeric protein (Fi+ F1 + F2) was calculated.
For the RP-HPLC analysis, gliadin and glutenin extracts were prepared according to Wieser & Seilmeier (1998). With the gliadin chromatogram, the proportion of the different gliadin fractions, omega, alpha⁄beta and gamma, could be assessed, while the glutenin chromato-gram allowed the ratio of HMW glutenins (HMW-GS) to LMW glutenins (LMW-GS) to be estimated. The HMW-GS allelic composition of the two wheat cultivars was monitored by SDS-PAGE analysis after protein extraction according to Singhet al.(1991).
Results and discussion
The yield of the winter wheat, Tommi, exceeded the Vinjett spring wheat yield under all combinations of
straw and catch crop (Fig. 1a). Overall yield was not affected by the last 27 years of straw incorporation. There was a significant interaction (P< 0.001) between catch crop and wheat variety with a higher yield response in the winter wheat than in the spring wheat after catch crops. It appeared that the longer growing season for winter wheat enabled this crop to utilise an improved soil fertility created by especially the rye-grass + clover catch crop. The spring wheat was unable to benefit from the previous higher N retention and N input. An interaction (P< 0.005) between catch crops and straw incorporation prevented the tendency for lower grain yields with straw removal with the rye-grass + clover catch crop (Fig. 1a).
Grain protein concentrations were higher (P< 0.001) in the spring wheat than in the winter wheat under all combinations of straw incorporation and catch crops (Fig. 1b). Previous catch crops had a slight but signif-icant (P< 0.05) influence on protein concentrations, but there was no differential effect of the two types of catch crops on grain protein quantity. Thus, the inclusion of clover in the ryegrass catch crop, which had a positive effect on the winter wheat yield, did not cause higher protein concentrations in the grain com-pared to ryegrass alone. Generally, it may be difficult to estimate the baking potential of wheat samples contain-ing <12% protein (Fowler & Kovacs, 2004) as found here for the winter wheat. Gluten typically constitutes
Grain yield (t DM ha
–1)
0 2 4 6
Annual long-term straw incorporation (t ha–1 year–1)
0 4 8 12
Protein in grain (% of DM) 0
4 8 12 16 20
No catch crop Ryegrass Ryegrass+clover
(a)
[image:2.595.319.544.74.317.2](b)
Figure 1 Grain dry matter (DM) yield (a) and protein concentration
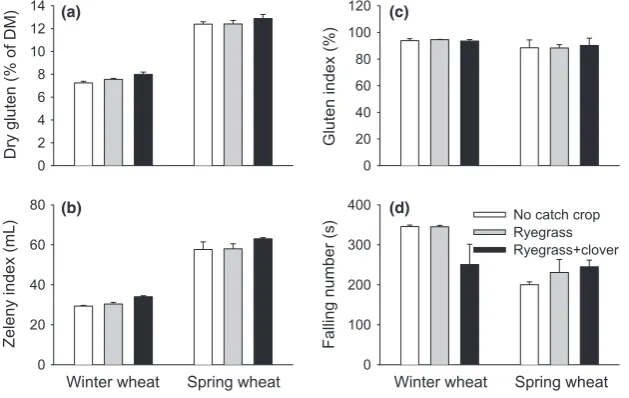
about 80% of the total protein content, causing differ-ences in gluten concentrations (Fig. 2a) to follow those of total protein concentrations (Fig. 1b).
The Gluten (rheological) and Zeleny (chemical) indexes are standard methods for predicting the tech-nological quality of wheat grains. As both tests give an indication regarding flour performance, they often point in the same direction. In the present study, the Zeleny Index test discriminated not only between the spring wheat samples and the winter wheat samples but also between different treatments within the two groups (Fig. 2b). The Zeleny index was generally higher for spring wheat than for winter wheat, indicating low-to-medium baking quality for winter wheat and good to excellent for spring wheat. Both wheat varieties had a higher Zeleny index in the treatment with a rye-grass + clover catch crop than in the two other treatments. Contrary to this, the Gluten index gave similar results for both wheat types and for all treatments, all samples being in the very good range (Fig. 2c). A similar disagreement between the Gluten and the Zeleny indexes was also found for organic wheat samples analysed in the AGTEC-Org project (unpub-lished data), which may reflect that these indexes were developed as indicators for baking quality of conven-tional wheat receiving mainly mineral fertiliser.
The a-amylase activity as indicated by the falling number (Fig. 2d) differed between the two wheat cultivars with generally higher values for winter wheat treatments than for spring wheat. Falling number values for winter wheat that has not undergone pregermination are expected to be above 300–350 s. The winter wheat grown without catch crop or with a ryegrass catch crop had falling numbers of this size (Fig. 2d) The falling numbers obtained for the spring wheat were in the range of 200–250 s that are generally considered perfect values
for baking. Both winter and spring wheat grown after ryegrass + clover catch crops had falling numbers close to 250 s that was significantly different from all the other treatments. The ash content was similar for winter and spring wheat and showed no relationship with previous catch crop cultivation (data not shown).
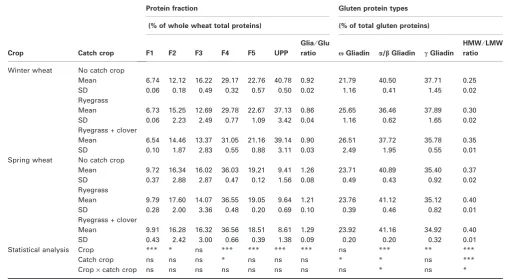
Gliadins and glutenins – the main constituents of gluten – appear to have an important effect on the quality of wheat, in particular the relationship between the compo-sition of HMW-GS and certain technological parameters (Payneet al., 1987). The SDS-PAGE analysis confirmed the HMW-GS allelic composition of the two wheat cultivars, with the spring wheat (Vinjett) containing HMW-GS 2*, 7 + 9, 5 + 10 and the winter wheat (Tommi) HMW-GS 1, 6 + 8, 2 + 12 (data not shown). Usually, the presence of HMW-GS 5 + 10, as found for the spring wheat, is accompanied by a good bread-making quality, whereas the presence of HMW-GS 2 + 12 indicates a poorer quality (Johanssonet al., 2000).
F1, F4, F5, UPP,a⁄b-gliadin,c-gliadin, and Glia⁄Glu and HMW-GS⁄LMW-GS ratios varied significantly (P< 0.001) between the two wheat varieties, whereas F3 (corresponding roughly to x-gliadin and high molecular weight albumins) was not influenced (Table 1). The spring wheat had higher contents of soluble polymers (F1 + F2) and gliadin (F4) than the winter wheat (Table 1). Gliadin content is mainly governed by agronomic conditions and increases with total protein concentration and N fertilisation (Bar-L’Helgouac’h et al., 2004). When relating to protein concentration (Fig. 2), the SE-HPLC showed increases in the proportion of gliadins (F4) with increasing protein and a corresponding decrease in the propor-tion of nongluten proteins (F5) (Table 1). The catch crop strategies induced only minor variations in protein composition, but for winter wheat, previous
Dry gluten (% of DM)
0 2 4 6 8 10 12 14
Falling number (s)
0 100 200 300 400
Zeleny index (mL)
0 20 40 60 80
Gluten index (%)
0 20 40 60 80 100 120
Winter wheat Spring wheat Winter wheat Spring wheat
No catch crop Ryegrass Ryegrass+clover
(a) (c)
[image:3.595.45.360.78.277.2](b) (d)
Figure 2 Dry gluten (a), gluten index (b),
ryegrass + clover catch crops increased the x-gliadin content, the HMW⁄LMW ratio and the F4 fraction compared with wheat grown without a catch crop (Table 1).
In conclusion, long-term incorporation of straw did not influence grain yield. Previous use of a ryegrass catch crop with clover increased yield only in the winter wheat, whereas its baking potential was little affected. Based on the present two varieties, the study implies that the potential for improving grain quality by adjusting the cropping system is rather limited when compared with indigenous differences between varieties.
Acknowledgments
This work was partly financed by the CORE Organic ERA-net in the research project AGTEC-Org. The skilled technical assistance by the staff at Askov Experimental Station and at INRAN laboratory for cereal analyses is gratefully acknowledged.
References
Ames, N.P., Clarke, J.M., Marchylo, B.A., Dexter, J.E. & Woods, S.M. (1999). Effect of environment and genotype on durum wheat gluten strength and pasta viscoelasticity.Cereal Chemistry,76, 582– 586.
Bar-L’Helgouac’h, C., Giraud, M. & Cosson, C. (2004). La chroma-tographie: un outil pour comprendre la qualite´ des varie´te´s. Perspectives Agricoles,303, 20–24.
Batey, I.L., Gupta, R.B. & MacRitchie, F. (1991). Use of size-exclusion high-performance liquid chromatography in the study of wheat flour proteins – an improved chromatographic procedure. Cereal Chemistry,68, 207–209.
Christensen, B.T. (1986). Barley straw decomposition under field conditions: effect of placement and initial nitrogen content on weight loss and nitrogen dynamics.Soil Biology and Biochemistry,
18, 523–529.
Dachkevitch, T. & Autran, J.C. (1989). Prediction of baking quality of bread wheats in breeding programs by size-exclusion high-perfor-mance liquid chromatography.Cereal Chemistry,66, 448–456. Fowler, D.B. & Kovacs, M.I.P. (2004). Influence of protein
concen-tration on farinograph absorption, mixing requirements and mixing tolerance.Canadian Journal of Plant Science,84, 765–772. International Association for Cereal Science and Technology (2003).
Standard Methods of the ICC. Methods No. 104⁄1, 107⁄1, 110⁄1, 116⁄1, 155. Vienna, Austria: The Association.
Johansson, E., Svensson, G. & Tsegaye, S. (2000). Genotype and environment effects on bread-making quality of Swedish-grown wheat cultivars containing high-molecular-weight glutenin subunits 2 + 12 or 5 + 10. Acta Agriculturae Scandinavica, Section B – Plant Soil Science,49, 225–233.
Luo, C., Branlard, G., Griffin, W.B. & McNeil, D.L. (2000). The effect of nitrogen and sulphur fertilisation and their interaction with genotype on wheat glutenins and quality parameters. Journal of Cereal Science,31, 185–194.
Morel, M.-H., Dehlon, P., Autran, J.C., Leygue, J.P. & Bar-L’Helg-ouac’h, C. (2000). Effects of temperature, sonication time, and power settings on size distribution and extractability of total wheat
Table 1Mean protein composition (SE-HPLC analysis) and gluten protein types (RP-HPLC analysis) of winter wheat (Tommi) and spring wheat
(Vinjett) as influenced by previous catch crop growing. Means are followed by standard deviation (SD)
Crop Catch crop
Protein fraction Gluten protein types
(% of whole wheat total proteins) (% of total gluten proteins)
F1 F2 F3 F4 F5 UPP
Glia⁄Glu
ratio xGliadin a/bGliadin cGliadin
HMW⁄LMW
ratio
Winter wheat No catch crop
Mean 6.74 12.12 16.22 29.17 22.76 40.78 0.92 21.79 40.50 37.71 0.25 SD 0.06 0.18 0.49 0.32 0.57 0.50 0.02 1.16 0.41 1.45 0.02 Ryegrass
Mean 6.73 15.25 12.69 29.78 22.67 37.13 0.86 25.65 36.46 37.89 0.30 SD 0.06 2.23 2.49 0.77 1.09 3.42 0.04 1.16 0.62 1.65 0.02 Ryegrass + clover
Mean 6.54 14.46 13.37 31.05 21.16 39.14 0.90 26.51 37.72 35.78 0.35 SD 0.10 1.87 2.83 0.55 0.88 3.11 0.03 2.49 1.95 0.55 0.01 Spring wheat No catch crop
Mean 9.72 16.34 16.02 36.03 19.21 9.41 1.26 23.71 40.89 35.40 0.37 SD 0.37 2.88 2.87 0.47 0.12 1.56 0.08 0.49 0.43 0.92 0.02 Ryegrass
Mean 9.79 17.60 14.07 36.55 19.05 9.64 1.21 23.76 41.12 35.12 0.40 SD 0.28 2.00 3.36 0.48 0.20 0.69 0.10 0.39 0.46 0.82 0.01 Ryegrass + clover
Mean 9.91 16.28 16.32 36.56 18.51 8.61 1.29 23.92 41.16 34.92 0.40 SD 0.43 2.42 3.00 0.66 0.39 1.38 0.09 0.20 0.20 0.32 0.01 Statistical analysis Crop *** * ns *** *** *** *** ns *** ** ***
Catch crop ns ns ns * ns ns ns * * ns *** Crop·catch crop ns ns ns ns ns ns ns ns * ns *
flour proteins as determined by size-exclusion high-performance liquid chromatography.Cereal Chemistry,77, 685–691.
Osborne, T.B. (1907).The Proteins of the Wheat Kernel. Washington, D.C.: Carnegie Institute Washington Publication, Judd and Detwe-iler, 84 pp.
Payne, P.I., Nightingale, M.A., Krattiger, A.F. & Holt, L.M. (1987). The relationship between HMW glutenin subunit composition and the bread-making quality of British-grown wheat varieties.Journal of the Science of Food and Agriculture,40, 51–65.
Samson, M.F. & Morel, M.H. (1995). Heat denaturation of durum wheat semolina beta-amylase effects of chemical factors and pasta processing conditions.Journal of Food Science,60, 1313–1320. Singh, N.K., Shepherd, K.W. & Cornish, G.B. (1991). A simplified
SDS-PAGE procedure for separating LMW subunits of glutenin. Journal of Cereal Science,14, 203–208.
Thomsen, I.K. (1995). Catch crop and animal slurry in spring barley grown with straw incorporation. Acta Agriculturae Scandinavica, Section B – Plant Soil Science,45, 166–170.
Thomsen, I.K. (2005). Nitrate leaching under spring barley is influenced by the presence of a ryegrass catch crop: results from a lysimeter experiment.Agriculture, Ecosystems & Environment,111, 21–29.
Thomsen, I.K. & Christensen, B.T. (2004). Yields of wheat and soil carbon and nitrogen contents following long-term incorporation of barley straw and ryegrass catch crops.Soil Use and Management,20, 432–438.