This is a repository copy of Harmonization of Food-Frequency Questionnaires and Dietary Pattern Analysis in 4 Ethnically Diverse Birth Cohorts.
White Rose Research Online URL for this paper: http://eprints.whiterose.ac.uk/112988/
Version: Accepted Version Article:
de Souza, RJ, Zulyniak, MA orcid.org/0000-0003-4944-5521, Desai, D et al. (14 more authors) (2016) Harmonization of Food-Frequency Questionnaires and Dietary Pattern Analysis in 4 Ethnically Diverse Birth Cohorts. Journal of Nutrition, 146 (11). pp.
2343-2350. ISSN 0022-3166
https://doi.org/10.3945/jn.116.236729
© 2016, American Society for Nutrition. This is an author produced version of a paper published in Journal of Nutrition. Uploaded in accordance with the publisher's
self-archiving policy.
Reuse
Unless indicated otherwise, fulltext items are protected by copyright with all rights reserved. The copyright exception in section 29 of the Copyright, Designs and Patents Act 1988 allows the making of a single copy solely for the purpose of non-commercial research or private study within the limits of fair dealing. The publisher or other rights-holder may allow further reproduction and re-use of this version - refer to the White Rose Research Online record for this item. Where records identify the publisher as the copyright holder, users can verify any specific terms of use on the publisher’s website.
Takedown
If you consider content in White Rose Research Online to be in breach of UK law, please notify us by
Title: Harmonization of food frequency questionnaires and dietary pattern analysis in four
ethnically diverse birth cohorts1234
Authors: *Russell J. de Souza1,2,3, Michael A. Zulyniak4, Dipika Desai4,5, Mateen Shaikh1,
Natalie C. Campbell4, Diana L. Lefebvre4, Milan Gupta4, Julie Wilson6, Gita Wahi7, Stephanie
A. Atkinson7, Koon K. Teo4, Padmaja Subbarao8, Allan B. Becker9, Piushkumar J Mandhane10,
Stuart E. Turvey11, Malcolm R. Sears4, Sonia S. Anand1,4,5 for the NutriGen Alliance
investigators
Author Affiliations:
1
Department of Clinical Epidemiology and Biostatistics, McMaster University, Hamilton, ON,
Canada;
2
Department of Nutritional Sciences, University of Toronto, Toronto, Ontario, Canada;
3
Li Ka Shing Knowledge Institute, St. MichaelÕs Hospital, Toronto, Ontario, Canada;
1
Online Supporting Material: 8 supplemental tables and 1 supplemental figure are available from the ÒOnline Supporting MaterialÓ link in the online posting of the article and from the same link in the online table of contents at jn.nutrition.org.
2
Abbreviations: ABC, Aboriginal Birth Cohort; BMI, Body Mass Index; CHILD, Canadian Healthy
Infant Longitudinal Development; FAMILY, Family Atherosclerosis Monitoring In early; FFQ, Food Frequency Questionnaire; mAHEI, modified Alternative Healthy Eating Index; PC, Principal Component; PCA, Principal Component Analysis; SHARE, Study of Health and Risk in Ethnic Groups; START , SouTh Asian birth cohort.
3
Sources of Funding:This work was supported by funding by a Canadian Institute for Health Research (CIHR, RFA# 201301FH6; 2013-2018) Grant in Food & Health Population Health Research grant [S.A.A., A.B.B., J.B., R.J.dS., J.A.D., M.G., S.D.M., A.M., D.M., K.M.M., G.P., M.R.S., P.J., M.G.S., K.K.T., G.W.], a CIHR RCT Fellowship grant [MTP201410, M.A.Z.], and AllerGen NCE Inc. [S.S.A].
4
4
Department of Medicine, McMaster University, Hamilton, ON, Canada;
5
Population Health Research Institute, Hamilton Health Sciences and McMaster University,
Hamilton Ontario, Canada;
6
Six Nations Health Services, 1745 Chiefswood Rd, Ohsweken, ON N0A 1M0, Canada;
7
Department of Paediatrics, McMaster University, Hamilton, ON, Canada;
8
Hospital for Sick Children & Department of Paediatrics, University of Toronto, Toronto, ON,
Canada;
9
Department of Immunology, Faculty of Medicine, University of Manitoba, Winnipeg,
Manitoba, Canada;
10
Department of Pediatrics, Faculty of Medicine and Dentistry, University of Alberta, Edmonton,
Alberta, Canada;
11
BC ChildrenÕs Hospital and Child and Family Research Institute, Department of Paediatrics,
Faculty of Medicine, University of British Columbia, Vancouver, British Columbia, Canada
*Corresponding Author: Dr. Russell J de Souza, McMaster University, 1280 Main St. W.,
MDCL-3202, Hamilton, ON L8S 4K1, 905.525.9140 x 22109
Index for PubMed: de Souza RJ, Zulyniak MA, Desai D, Shaikh M, CampbellNC, Lefebvre
DL, Gupta M, WilsonJ, WahiG, AtkinsonSA, TeoKK, Subbarao P, Becker AB, Mandhane PJ,
Turvey SE, Sears MR, and Anand SS for the NutriGen Alliance investigators
Text word count: 7,080 (includes abstract, text, table1, figure legends, acknowledgments and
references)
Table and Figures: 1 Table and 1 Figure
Online Supporting Material: 8 Tables and 1 Figure
ABSTRACT 1
BACKGROUND 2
Canada is an ethnically diverse nation which introduces challenges for healthcare providers 3
tasked with providing evidence-based dietary advice. 4
OBJECTIVES 5
We aimed to harmonize food frequency questionnaires (FFQs) across four birth cohorts of 6
ethnically diverse pregnant women in order to derive robust dietary patterns to investigate 7
maternal and newborn outcomes. 8
METHODS 9
The NutriGen Alliance comprises 4 prospective birth cohorts and includes 4,880 Canadian 10
mother-infant pairs of predominantly white European (CHILD and FAMILY), South Asian 11
(START-Canada), or Aboriginal origin (ABC). CHILD used a multiethnic FFQ based on a 12
previously validated instrument designed by the Fred Hutchinson Cancer Research Center, while 13
FAMILY, START, and ABC used questionnaires specifically designed for use in white 14
European, South Asian, and Aboriginal people, respectively. The serving sizes and consumption 15
frequencies of individual food items within the four FFQs were harmonized and aggregated into 16
36 common food groups. Principal components analysis was used to identify dietary patterns that 17
were internally validated against self-reported vegetarian status and externally validated against a 18
modified Alternative Healthy Eating Index (mAHEI). 19
RESULTS 20
Three maternal dietary patterns were identified: Òplant-basedÓ, ÒWesternÓ, and Òhealth 21
consciousÓ that collectively explained 29% of the total variability in eating habits observed in the 22
(OR=3.85; 95% CI:3.47 to 4.29; r2 = 0.30 and P<0.001; for plant-based diet), and average 24
adherence to the plant-based diet was higher in participants in the 4th quartile of the mAHEI 25
compared with the 1st (mean difference = 46.1%; r2 = 0.81 and P<0.001). 26
CONCLUSION 27
Dietary data collected using FFQs from ethnically diverse pregnant women can be harmonized to 28
identify common dietary patterns in order to investigate associations between maternal dietary 29
intake and health outcomes. 30
31
KEYWORDS: FFQ, food frequency questionnaire, harmonization, multi-ethnic, PCA, 32
INTRODUCTION 34
Methodological advances in dietary measurement in large epidemiologic studies, such as the 35
development of valid and reproducible semi-quantitative food-frequency questionnaires(1, 2) has 36
facilitated the study of associations between dietary intake and health and disease outcomes, such 37
as cancer and cardiovascular disease. This is often approached with a ÒreductionistÓ lens, 38
examining associations between specific food items(3-6), single nutrients(5, 7), or sources of 39
nutrients(8, 9) and health outcomes. This approach is reflective of public health approaches to 40
food and nutrient recommendations, has advanced our understanding and treatment of specific 41
nutrient deficiency syndromes (e.g. folate fortification to prevent neural tube defects), and 42
facilitated the identification and removal of particularly harmful components of food from the 43
food supply (e.g., the removal of partially-hydrogenated vegetable oils). However, long-term diet 44
is likely a stronger determinant of diet-related chronic disease risk than consumption of any 45
single food item or nutrient (10), and thus single-food (e.g. dietary cholesterol or coffee) or 46
single-nutrient studies are often misleading(11, 12) because they fail to capture the complex 47
interplay between foods and nutrients consumed as meals over long periods of time. To 48
overcome the limitations of single-nutrient or single-food studies, the empirical derivation of 49
dietary patterns Ñ defined as Òthe quantities, proportions, variety or combinations of different 50
foods and beverages in diets, and the frequency with which they are habitually consumedÓ(13), 51
has been proposed as a method to characterize diet that more accurately reflects how we 52
consume foods or nutrients, and these patterns can be assessed for their associations with health 53
and disease.(14-18) 54
Canada is an ethnically diverse nation(19) which introduces challenges for healthcare 55
about diet and disease is rooted in studies of white European populations. Dietary choice is 57
closely tied to ethnicity (e.g., foods, cooking methods, and eating habits)(20) and the degree to 58
which an individual or community consumes ethnically-traditional foods can be influenced by 59
immigration and residency in a host country.(21) 60
In preparation for investigations into the role of maternal nutrition on maternal and 61
newborn outcomes in a multiethnic birth cohort consortium, we developed an approach to 62
harmonize dietary patterns in pregnant women. This paper describes the methods used to derive 63
and to validate dietary patterns identified at single time-point in the cross-sectional analysis of a 64
prospective birth cohort and outlines the unique challenges faced and the methodological 65
approaches used to address them. 66
67
METHODS 68
Study population 69
The NutriGen Alliance is a multi-ethnic birth cohort consortium comprised of 4 ethnically-70
diverse cohorts of pregnant women representing several geographic regions across Canada. 71
These cohorts were assembled in order to understand the early life determinants of 72
cardiometabolic risk, allergy, and asthma. Each cohort enrolled pregnant women in their second 73
or third trimester and will follow the mother and infant from pregnancy through delivery and into 74
childhood. The NutriGen Alliance provides a platform to investigate the joint influences of 75
dietary intake, genetics, and the gut microbiome on the development of maternal and infant 76
health outcomes in a Canadian context. As of February 2016, 5,000 women with dietary data 77
have been enrolled across the four cohort studies. There are 3,047 pregnant women from the 78
groups [white European (74%), East/South East Asian (12%), Aboriginal (4%), South Asian 80
(3%), and African or other (12%) origin] recruited from 6 urban and rural Canadian cities 81
Vancouver, BC; Edmonton, AB; Winnipeg, MB; Morden, MB; Winkler, MB; Toronto, ON); 839 82
pregnant women have been included from the Family Atherosclerosis Monitoring In earLY 83
life(23) (FAMILY) study representing 5 ethnic groups [white European (74%), East/South East 84
Asian (1%), Aboriginal (1%), South Asian (1%), and African or other (4%) origin] recruited 85
from the Greater Hamilton Area, Ontario; there are 1,006 South Asian mothers from the SouTh 86
Asian birth cohoRT(24) (START recruited from the Peel Region, ON); and 108 of an anticipated 87
300 Aboriginal mothers from the Aboriginal Birth Cohort(25) (ABC) recruited from the Six 88
Nations Reserve, ON). Comprehensive clinical and dietary data from all pregnant women have 89
been collected from all 4 cohorts. Ethical approval was obtained for each study independently, 90
and informed consent was obtained from all individual participants included in the study. 91
For this analysis, women who did not satisfactorily complete the FFQ (i.e., did not 92
answer ≥ 10 questions [(~6%]) or who reported an implausible energy intake (<500 or >6 500 93
kcal/d) were excluded. One individual reported an implausibly high intake of a single food item 94
(i.e., 64 servings of lettuce per day). Excluding this participantÕs FFQ, or replacing the 95
implausibly reported value with a value equal to the 99th percentile of the ÒplausibleÓ values (12 96
servings/day) produced identical dietary patterns; as such, the implausible value was included. 97
The final number of women included in our analysis was 4,880 (SUPPLEMENTALTABLE
98
1). 99
100
Food frequency questionnaires (FFQs). In the CHILD study, maternal diet was assessed using a 102
semi-quantitative FFQ, adapted from the Fred Hutchinson Cancer Center tool.(26) In the 103
FAMILY, START, and ABC cohorts, semi-quantitative FFQs developed for the Study of Health 104
and Risk in Ethnic Groups study(27) were used to assess maternal dietary intake during 105
pregnancy, modified to capture ethnic-specific foods (SHARE based FFQs). ABC, FAMILY, 106
and START FFQs were analyzed using a database linked to the Canadian Nutrient File, the 107
CHILD FFQ was analyzed using the USDA nutrient database, modified for a Canadian 108
setting(28) allowing a detailed estimation of and energy intake. The development and validation 109
of these tools has been described previously.(29-31) 110
111
FFQ harmonization 112
Frequency of consumption and serving size. The included FFQs used different serving size 113
reference portions and frequency of consumption options. The CHILD FFQ provided 114
respondents with categorical frequency options from which to choose (e.g., never through to 115
>2/day), while in the SHARE-based FFQs, response categories were open-ended . Thus, we 116
harmonized serving sizes of the SHARE-based FFQs to those in CHILD (SUPPLEMENTAL
117
TABLE 2).(32, 33) Detailed steps describing the calculations and methods used to harmonize 118
serving sizes across the cohorts are presented in SUPPLEMENTAL TABLE 3. 119
120
Food groupings. To create common food groups across the cohorts, individual FFQ items from 121
each study were aggregated into groups of foods of similar nutrient profile and type (e.g. poultry, 122
leafy greens, legumes, etc.). In some cases, foods groups contained only a single item that 123
consumption) (SUPPLEMENTALTABLE 4). We grouped foods in a way that has been used 125
in previous dietary pattern analysis studies that examined associations between dietary habits and 126
cardiometabolic conditions, allergies, or common clinical biomarkers (e.g., fasting plasma 127
glucose, cholesterol and triglycerides).(32-35) For example, bacon, breakfast sausages, low-fat 128
and regular hotdogs, lunchmeats, and canned meats were combined into a single category called 129
ÔProcessed MeatsÕ.
130
131
Dietary pattern analysis 132
To identify dietary patterns within the FFQ data, we used the ÔpsychÕ package (v.1.5.6) within R 133
(v.3.1.2) to perform a principal component analysis (PCA) with an orthogonal ÔvarimaxÕ 134
rotation.(16) The statistical details of PCA as a means to reduce the dimensionality of the FFQ 135
are beyond the scope of this paper, but we refer interested readers to several excellent 136
reviews.(10, 33, 36-39) The number of dietary patterns retained was determined by visual 137
inspection of scree plots in conjunction with eigenvalues (> 1.0) and principal component 138
interpretability.(15, 40, 41) Three sensitivity analyses of dietary patterns were conducted (using 139
the same PCA approach as described): (i) women diagnosed with type-2 diabetes prior to their 140
current pregnancy (n=107; with or without hypertension); (ii) women diagnosed with 141
hypertension prior to their current pregnancy (n=190; with or without type-2 diabetes); and (iii) 142
those without type-2 diabetes (n=4,720) or hypertension (n=4,632) prior to their current 143
pregnancy. 144
We labeled each dietary pattern (i.e., groups of foods with similarly high factor loadings) 145
with a descriptor that reflected the highly-loaded food groups (e.g., ÒWesternÓ vs. ÒPrudentÓ 146
their food choices reflected each of the empirically-derived dietary patterns Ð with a higher score 148
reflecting a greater degree of adherence to that dietary pattern. Dietary pattern scores were 149
adjusted to the mean total population caloric intake using the residual method.(42, 43) 150
151
152
Dietary Pattern Adherence score 153
We created a dietary pattern adherence score that would more intuitively represent an 154
individualÕs degree of adherence to each of the identified dietary patterns. To do this, Òcardinal 155
food groupsÓ that characterized each dietary pattern were defined as those food groups with an 156
absolute factor (dietary pattern) loading score ≥ 0.30 (SUPPLEMENTAL TABLE 5). (44, 45) 157
Daily servings of each of the cardinal food groups was converted into quintiles, using the 158
distribution of servings within the study population and assigned Òquintile scoresÓ from 1 (<20th 159
%ile) to 5 (≥80th %ile) (SUPPLEMENTAL TABLE 6). These quintile scores for each of the 160
food groups were summed to derive a numerical indicator of how closely an individualÕs diet 161
reflected a given pattern. For example, Processed Foods had an absolute loading score >=0.30 162
(0.55) for the ÒWesternÓ diet but not for Ôplant-basedÕ (-0.22) or Ôhealth consciousÕ (0.13). In this 163
case, the quintile score for Processed Foods is added to the total score for the ÒWesternÓ dietary 164
pattern, but not to the Òplant-basedÓ or Òhealth consciousÓ dietary patterns. An individualÕs score 165
for that specific diet was divided by the maximum score possible for the diet and multiplied by 166
100 to quantify the degree to which an individual adheres to each of the given dietary patterns 167
(on a scale of 1 to 100) (TABLE 1). 168
Internal and External Validation of Dietary Pattern Scores: PCA summary scores were validated 170
against self-reported vegetarian practice using a logistic regression model. It was hypothesized 171
that higher plant-based diet scores would be associated with higher odds of self-reported 172
vegetarian status. PCA summary scores were externally validated against the modified 173
Alternative Healthy Eating Index (mAHEI) (46) by comparing differences in mean scores 174
between extreme quartile groups for PCA diet patterns. An mAHEI diet score was calculated for 175
each participant: participants received 10 points for each of the following food items that they 176
consumed above (healthful foods) or below (less-healthful foods) a threshold: ≥ 5 servings of 177
vegetables, ≥ 4 servings of fruit, ≥ 1 serving of nuts or soy proteins, ≥ 3 servings of whole 178
grains, with a ratio of ≥ 4 servings fish to 1 of meat and eggs; and ≤ 0.5 servings of less-healthy 179
foods (i.e., fried foods and processed meats) Ñ intermediate intakes were scored proportionally 180
between 0 and 10. The maximum mAHEI score was 60. For this analysis, Ôprocessed meatsÕ was 181
included in the mAHEI Ôfried foodsÕ category to capture trans-fat consumption. The mAHEI 182
category for Ôalcohol consumptionÕ was not included in this analysis of pregnant women. A 183
design feature of the mAHEI (and other indexes, such as the Healthy Eating Index(47)) is that it 184
rewards the consumption of ÒhealthyÓ foods (5 items contribute to the score) rather than reward 185
the avoidance of ÒunhealthyÓ foods (1 item contributes to the score); however this feature does 186
not preclude its usefulness as a valuable external validation tool for our derived diet patterns. To 187
do this, we compared mean Òplant-basedÓ, Òhealth-consciousÓ, and ÒWesternÓ diet scores 188
between individuals in the lowest mAHEI points quartile (i.e., < 15 points, Òleast healthyÓ) and 189
those in the 4th mAHEI quartile (i.e., ≥ 45 points, Òmost healthyÓ). Differences in mean scores 190
in those in the 4th mAHEI vs. 1st quartile; and higher ÒWesternÓ scores were expected in those in 192
the 1st vs. 4th mAHEI quartile). 193
194
RESULTS 195
PCA-Derived Patterns 196
Overall, 4,880 valid FFQs were harmonized across 4 cohorts (SUPPLEMENTAL TABLE 1). 197
The dimensionality of the food group matrix was reduced from the 152 to 167 items queried 198
within each individual study FFQ to 36 harmonized food groups (SUPPLEMENTAL TABLE
199
4) and 93 food items were common to all 4 instruments. A total of 59 and 70 foods were unique 200
to CHILD and START FFQs, respectively, 64 were unique to the FAMILY FFQ, and 6 were 201
unique to the ABC FFQ (FIGURE 1). The PCA identified three primary dietary patterns within 202
the NutriGen Alliance with eigenvalues of 4.08, 3.14, and 3.05, which collectively explained 203
29% of the diet variability within the harmonized FFQ data set. The dietary patterns were 204
classified as Ôplant-basedÕ, ÔWesternÕ, and Ôhealth consciousÕ, to emphasize the prominent food 205
groups that defined each pattern. These categorizations reflect previously described dietary 206
patterns in large cohort studies (SUPPLEMENTAL TABLE 5).(32-35, 48) In the sensitivity 207
analyses, the PCA-derived dietary patterns within subgroups of mothers who reported pre-208
pregnancy diabetes (n=107) or hypertension (n=190), were similar Ñ e.g., plant-based, Western, 209
and health-conscious Ñ to those derived with the entire sample population, or those groups 210
without hypertension (n=4,632) or type 2 diabetes (n=4,720). 211
The number of food groups with a loading factor greater than ≥ |0.30| were 10 for the 212
plant-based; 13 for the Western, and 14 for the Õhealth consciousÕ patterns. The Òplant-basedÓ 213
meat dishes, and a lack of red meat; the ÒWesternÓ pattern had high loading of sweets and 215
refined grains, red meat and processed meats, French fries, starchy vegetables, condiments, and 216
sweet drinks; and the Óhealth consciousÓ pattern was characterized by seafood and poultry and 217
meats, eggs, cruciferous vegetables, leafy greens, fruits, refined grains, stir-fried dishes, and 218
condiments. 219
The dietary PCA scores for each individual were: -1.8 to 6.1 (plant-based); -3.7 to 6.6 220
(Western); and -2.8 to 9.1 (Ôhealth consciousÕ). When adjusted for total energy intake using the 221
residual method(49) to a mean total energy intake of 2000 kcal per day (equal to the mean 222
energy intake of mothers in the NutriGen Alliance), the range of loading scores for dietary 223
patterns were: -2.2 to 5.5 (plant-based); -5.4 to 4.7 (Western); and -4.0 to 7.8 (Ôhealth 224
consciousÕ). Negative values indicate that an individualÕs dietary pattern is not generally 225
reflective of the specific PCA-derived pattern (i.e. Òplant-basedÓ; ÒWesternÓ; or Òhealth-226
consciousÓ); and positive values indicate that an individualÕs dietary pattern is generally 227
reflective of the specific PCA-derived pattern. 228
In a second PCA, indicators for each ethnicity were included in the PCA to evaluate the 229
effect of ethnicity on the derived dietary patterns (SUPPLEMENTAL TABLE 7). Despite 230
ÔOther VegetablesÕ no longer loading ≥ 0.30 within the Òhealth-consciousÓ diet pattern, the 231
dietary patterns were equivalent to those observed in the original PCA reported in TABLE 4. 232
Univariate regression demonstrated that the summary scores from the PCA that did not include 233
ethnicity correlated strongly with the summary scores when ethnicity was included: plant-based 234
(r2 = 0.97, p<0.001), Western (r2 = 0.94, p<0.001), and health-conscious (r2 = 0.96, p<0.001). 235
236
The maximum adherence diet scores for the plant-based, Western, and Ôhealth consciousÕ diets 238
were 50, 65, and 70 total quintile points, respectively. Energy-adjusted PCA scores were well-239
correlated with the energy-adjusted quintile-based diet scores (r2-values: plant-based=0.75, 240
p<0.001; Western=0.47, p<0.001; Ôhealth consciousÕ=0.51, p<0.001). 241
Using this scoring method, the plant-based diet had a mean adherence of 57.1%, the 242
Western diet 58.6% and the Ôhealth-consciousÕ diet 59.2% (SUPPLEMENTAL TABLE 8). 243
There were clear differences across the four major ethnic groups (n≥200) with respect to average 244
dietary pattern scores. South Asians most closely adhered to the plant-based diet [mean score 245
=77.9% (SD=12.5)], while East and South East Asians [47.7% (10.3)] were least adherent. The 246
Western diet was most strongly adhered to by Aboriginal people [63.3% (9.2)] and least strongly 247
by South Asians [47.6% (9.5)]. The ÔHealth ConsciousÕ diet was strongly followed by East/South 248
East Asians [66.9% (9.2)], and least strongly adhered to by South Asians [51.5% (10.1)]. 249
250
Validation Assessments 251
Internal Validity. To assess the internal validity and robustness of the harmonized NutriGen 252
dietary patterns, we also derived the patterns within each of the individual cohorts separately 253
(ABC, CHILD, FAMILY, and START) and found that the cohort-specific dietary patterns 254
reflected those of the harmonized NutriGen cohort. CHILD presented two primary diets, ovo-255
pescetarian (plant-based with fish and eggs) and Western; FAMILY presented two primary diets, 256
health-conscious and Western; START presented three primary diets plant-based, Western, and 257
health-conscious; and ABC presented two primary diets, health-conscious and Western. 258
The unadjusted and energy-adjusted PCA summary scores were validated against the 259
vegetarians, ovo-vegetarians, vegetarians, and vegans). For the unadjusted PCA scores: a single 261
unit increase in the plant-based diet PCA score associated with a 3-fold greater likelihood of self-262
reporting as a ÔvegetarianÕ or being non-consumer of meat (OR=3.35; 95% CI:3.03 to 3.68; r2 = 263
0.26; p<0.001) while an single unit increase in either the Western (OR=0.36; 95% CI:0.31 to 264
0.42; r2 = 0.08; p<0.001) or health conscious (OR=0.60; 95% CI:0.53 to 0.68; r2 = 0.02; 265
p<0.001) diets were negatively associated with self-reported vegetarian status. For energy-266
adjusted PCA scores the plant-based diet was similarly positively associated with self-reported 267
vegetarian status (OR=3.85; 95% CI:3.47 to 4.29; r2 = 0.30; p<0.001) and both the Western 268
(OR=0.29; 95% CI:0.24 to 0.34; r2 = 0.08; p<0.001) and Ôhealth consciousÕ (OR=0.67; 95% 269
CI:0.59 to 0.75; r2 = 0.01; p<0.001) diets were negatively associated with self-reported 270
vegetarian status. 271
External Validity. Individuals in the lowest (least healthy) mAHEI quartile had lower adherence 272
to the plant-based diet score (mean score=35.8 ± 7.9% in Q1 vs. 81.8 ± 11.2 % in Q4; r2 = 0.81; 273
p<0.001) and Òhealth-consciousÓ diet score (41.8 ± 8.7 % in Q1 vs. 56.0 ± 13.6 % in Q4; r2 = 274
0.23; p<0.001) diet patterns than those in the highest (most healthy) mAHEI quartiles 275
(SUPPLEMENTAL FIGURE 1). Individuals in the lowest mAHEI quartile adhered more 276
strongly to the Western diet score (57.7 ± 12.9 % in Q1 vs. 52.9 ± 15.0 % in Q4; r2 = 0.02; 277
p<0.001) than those in the highest mAHEI quartile. 278
279
DISCUSSION 280
This study describes the novel application of a methodological approach to harmonize dietary 281
data collected with cohort-specific, independently validated FFQs across 4 ethnically diverse 282
Such harmonization efforts are increasingly common(50) for other types of data, and directed 284
criteria and guidelines have been developed (i.e., PhenX Toolkit) to facilitate the pooling of 285
maternal and infant data across birth cohorts.(51) 286
We identified 3 unique dietary patterns, which we named Òplant-basedÓ, ÒWesternÓ, and 287
Òhealth consciousÓ, which closely resemble previously documented patterns in a cohort of the 288
Toronto Nutrigenomics and Health (TNH) Study Ñ a multi-ethnic cohort of young Canadian 289
men and women residing in the Greater Toronto Area (n=1,153)(52). In this study, 3 patterns Ñ 290
Prudent, Western, and Eastern Ñ were identified using a single semi-quantitative FFQ and 291
explained 16% of the dietary variance, less than the 29% that our harmonized analysis explained. 292
While dietary pattern studies typically identify 2 major dietary patterns(14, 15, 53), the similarity 293
of the NutriGen and TNH dietary patterns likely reflects a similar ethnic composition of the 294
cohorts. 295
In the present study, we faced the challenge of post-hoc harmonization. An excellent 296
example of forward thinking about harmonization is provided by the merger of FFQ data 297
collected from two birth cohorts Ñ the Danish National Birth Cohort (DNBC, n=70,183) and the 298
Norwegian Mother and Child Cohort Study (MoBa, n=87,000).(54) Despite some unique 299
regional items within each FFQ, food items were comparable and aggregated into common 300
higher-order food groups (e.g., fruits, legumes, etc.). The harmonization was aided by a high 301
degree of ethnic homogeneity and cooperation between the DNBC and MoBa study teams during 302
MoBaÕs development, which facilitated the development of an FFQ that was very similar to the 303
DNBC FFQ. Nevertheless, we demonstrate that retrospective harmonization across diverse 304
(i.e. 3-4%) in dietary pattern adherence even within ethnic groups where one may expect 306
homogeneity of dietary intake. (SUPPLEMENTAL TABLE 8) 307
The NutriGen Alliance dietary patterns showed good internal and external validity. The 308
Òplant-basedÓ score was strongly associated with self-reported vegetarian status, although even 309
this association is likely diluted because ÒvegetarianÓ was inconsistently defined across the 310
cohorts: for example, in the CHILD cohort, pregnant women, Òreported abstinence from meatsÓ 311
whereas in the FAMILY, START, and ABC cohorts a Vegetarian status question was asked. A 312
single unit increase in the plant-based score increased the odds of being a vegetarian (i.e., non-313
meat eater) by more than 3-fold; conversely, a unit increase in the Western diet reduced these 314
odds by »70%. The Ôhealth consciousÕ diet score was less useful at predicting vegetarian status: 315
a single unit increase reduced the likelihood of vegetarian status by »40%. These results suggest 316
that three dietary patterns can accurately distinguish between individuals consuming a distinct 317
diet pattern Ð i.e., vegetarian. 318
Our external validation against the mAHEI(46), which has been used previously to assess 319
diet quality in pregnant women(55), found that mAHEI score was associated with greater 320
adherence to the plant-based and health-conscious diet patterns and lower adherence to the 321
Western diet, which confirms alignment of our dietary patterns with external methods for 322
assessing diet quality. 323
Total energy was adjusted for in the analysis to reduce confounding and random error 324
owing to differences in food intake resulting from differences in body size, metabolic efficiency, 325
and physical activity. In some studies, it may be desirable to not account for energy if excess 326
food energy is causally implicated in the relationship between certain foods or diets and specific 327
and obesity). However, it is often desirable to isolate the effect of a specific food item or 329
nutrient from its unspecific contribution to total energy intake when assessing diet-disease 330
associations (e.g., the unique contribution of trans fat from other energy-containing nutrients of 331
the foods in which it is contained). In a comparison of dietary patterns derived with and without 332
energy adjustment, Northstone et al. found that Ôwhite breadÕ was positively loaded on the 333
ÔProcessed dietÕ in an unadjusted model but, following energy-adjustment, was negatively loaded 334
for the ÔHealth ConsciousÕ.(43) Balder et al. proposed that, in an energy-adjusted model, the 335
avoidance of high-energy foods in favour of low-energy healthy alternatives (i.e., choosing lower 336
energy-dense brown bread rather than high energy-dense white bread) is a salient feature of 337
Ôhealth consciousÕ diets;(56) therefore, energy-unadjusted and adjusted models characterize 338
similar dietary patterns and are therefore comparable. In the present study, the likelihood of 339
vegetarian status according to participant plant-based, Western, and Ôhealth consciousÕ dietary 340
pattern scores were comparable in unadjusted and energy-adjusted models. It has been 341
recommended that energy adjustment be performed post-PCA(43, 56) in order to simplify the 342
interpretation of the results. 343
A salient feature of our cohorts was ethnic diversity. Downstream dietary pattern 344
analyses within diverse cohorts often requires adjustment for ethnicity(16, 57), which is most 345
often accomplished by including ethnicity as a covariate in multivariable models. An alternative 346
approach is to include ÒethnicityÓ in the PCA when deriving dietary patterns, which would help 347
account for the tight conceptual linking of diet and ÒcultureÓ. In the present study, including 348
ethnicity in the PCA only marginally affected the dietary patterns (Supplemental Table 4) and 349
these dietary pattern scores derived with ethnicity correlated strongly with those derived without 350
impossible to assess whether the association between dietary patterns and health outcomes are 352
modified by ethnicity. Thus, leaving ethnicity out of the PCA derivation of dietary patterns gives 353
maximum flexibility to the researcher in future analyses of dietary patterns and health outcomes. 354
A novel diet score approach was developed to simplify the interpretation of the dietary 355
patterns. Individual summary scores for each principal component reflect how closely each 356
person follows a given dietary pattern (e.g., prudent, Western, and Ôhealth consciousÕ), but factor 357
loading scores are difficult to interpret because the score and the range of scores varies across 358
dietary patterns. However, by only focusing on foods that contribute strongly to each dietary 359
pattern (i.e., Òcardinal featuresÓ with loading scores ≥ |0.30|) and calculating a diet score ranging 360
from 1% (null adherence) to 100% (full adherence) for each of the diets, the dietary patterns 361
scores have the straightforward interpretation of how closely dietary habits reflects one of the 362
empirically-derived plant-based, Western, and Ôhealth consciousÕ diets. Because this intuitive 363
approach loses little information, and there is strong correlation between diet scores and PCA 364
scores, the derived dietary scores can be used in place of the summary scores for regression 365
analyses for easier interpretability and presentation of results. 366
Our study has some limitations. Maternal diet was collected using self-reported FFQs. 367
Though these instruments have been validated, recall bias and measurement error are 368
acknowledged limitations of these tools. However, given the prospective nature of our planed 369
analyses Ñ i.e., the association between maternal food choices and future maternal and infant 370
health Ñ and the large number of individuals involved, we anticipate this to be random error, 371
which can be attenuated if multiple measures of diet are available(58). Also, scree plots 372
identified 3 patterns Ñ with eigenvalues >3.0 each that collectively explained 29% of the dietary 373
smaller degree of variation, were not retained. Future studies may need to increase the number of 375
dietary patterns to characterize less common dietary patterns in their study population of interest. 376
We addressed the issue of reverse confounding such that a pre-existing medical condition such as 377
pre-pregnancy diabetes or hypertension may influence dietary intake in pregnancy by conducting 378
a sensitivity analyses among those women with type 2 diabetes or hypertension. Our analyses 379
showed that within each subgroup the PCA-derived diet patterns did not differ substantially from 380
each other or from our patterns derived using the complete sample. In addition while nutrients 381
were not the focus of the present study, future analyses using these four harmonized birth cohorts 382
which focus on macro and micronutrient analyses will require harmonization of the nutrient data 383
where different nutrient databases were used. 384
In conclusion, this study addressed a novel challenge Ð the merging and harmonization of 385
multiple FFQ data sets collected from pregnant women of diverse ethnicities using an established 386
methodology for dietary pattern analysis. We have demonstrated a valid approach to merge both 387
similar and distinct FFQ datasets to investigate how maternal diet during pregnancy contributes 388
to maternal and infant health and disease. 389
390
391
392
Acknowledgments:
393
Additional NutriGen Alliance study investigators: Jospeh Beyene, Judah A. Denburg, Sarah 394
McDonald, Andrew Mente, David Meyre, Guillaume Pare, Michael Surette. 395
ABC Study Investigators: Sonia S. Anand, Gita Wahi, Julie Wilson; ABC Research Staff: A. 396
CHILD Study Investigators: Sonia S. Anand, Allan B. Becker, Dean Befus, Jeff Brook, Wen-Yi 398
Lou, Piush J. Mandhane, Gregory Miller, Andrew Sandford, Malcolm R. Sears, Padmaja 399
Subbarao, Stuart E. Turvey; Child Research Staff: Diana L. Lefebvre, Joanne M. Duncan. 400
START Canada Investigators: Sonia S. Anand, Rebecca Anglin, Joseph Beyene, Milan Gupta, 401
Guillaume Pare, Katherine Morrison. 402
403
404
Authors Contributions: 405
S.A.A., A.B.B., J.B., R.J.dS., J.A.D., M.G., S.D.M., A.M., D.M., K.M.M., G.P., M.R.S., P.J., 406
M.G.S., K.K.T., and G.W. developed overall research plan; R.J.dS, M.A.Z., and S.S.A., 407
conducted research and prepared the final manuscript; All authors have read and approved the 408
References:
1. Willett WC, Sampson L, Stampfer MJ, Rosner B, Bain C, Witschi J, Hennekens CH, Speizer
FE. Reproducibility and validity of a semiquantitative food frequency questionnaire. Am J
Epidemiol 1985;122(1):51-65.
2. Rimm EB, Giovannucci EL, Stampfer MJ, Colditz GA, Litin LB, Willett WC.
Reproducibility and validity of an expanded self-administered semiquantitative food
frequency questionnaire among male health professionals. Am J Epidemiol
1992;135(10):1114-26; discussion 27-36.
3. Schernhammer ES, Hu FB, Giovannucci E, Michaud DS, Colditz GA, Stampfer MJ, Fuchs
CS. Sugar-sweetened soft drink consumption and risk of pancreatic cancer in two prospective
cohorts. Cancer epidemiology, biomarkers & prevention : a publication of the American
Association for Cancer Research, cosponsored by the American Society of Preventive
Oncology 2005;14(9):2098-105.
4. Fung TT, Malik V, Rexrode KM, Manson JE, Willett WC, Hu FB. Sweetened beverage
consumption and risk of coronary heart disease in women. Am J Clin Nutr
2009;89(4):1037-42.
5. Yudin J, Morland J. Sugar intake and myocardial infarction. Am J Clin Nutr
1967;20(5):503-6.
6. Giovannucci E, Rimm EB, Stampfer MJ, Colditz GA, Ascherio A, Willett WC. Intake of fat,
meat, and fiber in relation to risk of colon cancer in men. Cancer research 1994;54(9):2390-7.
7. Willett WC, Hunter DJ, Stampfer MJ, Colditz G, Manson JE, Spiegelman D, Rosner B,
Hennekens CH, Speizer FE. Dietary fat and fiber in relation to risk of breast cancer. An
8. Howe GR, Jain M, Miller AB. Dietary factors and risk of pancreatic cancer: results of a
Canadian population-based case-control study. International journal of cancer Journal
international du cancer 1990;45(4):604-8.
9. Hu FB, Stampfer MJ, Manson JE, Rimm E, Colditz GA, Speizer FE, Hennekens CH, Willett
WC. Dietary protein and risk of ischemic heart disease in women. Am J Clin Nutr
1999;70(2):221-7.
10. Hu FB. Dietary pattern analysis: a new direction in nutritional epidemiology. Current opinion
in lipidology 2002;13(1):3-9.
11. Keys A. Diet and blood cholesterol in population surveys--lessons from analysis of the data
from a major survey in Israel. Am J Clin Nutr 1988;48(5):1161-5.
12. Sacks FM, Castelli WP, Donner A, Kass EH. Plasma lipids and lipoproteins in vegetarians
and controls. The New England journal of medicine 1975;292(22):1148-51.
13. U.S. Department of Health and Human Services and U.S. Department of Agriculture.
2015-2020 Dietary Guidelines for Americans. 8th edition ed, 2015.
14. Heidemann C, Schulze MB, Franco OH, van Dam RM, Mantzoros CS, Hu FB. Dietary
patterns and risk of mortality from cardiovascular disease, cancer, and all causes in a
prospective cohort of women. Circulation 2008;118(3):230-7.
15. Hu FB, Rimm EB, Stampfer MJ, Ascherio A, Spiegelman D, Willett WC. Prospective study
of major dietary patterns and risk of coronary heart disease in men. Am J Clin Nutr
2000;72(4):912-21.
16. Iqbal R, Anand S, Ounpuu S, Islam S, Zhang X, Rangarajan S, Chifamba J, Al-Hinai A,
Keltai M, Yusuf S, et al. Dietary patterns and the risk of acute myocardial infarction in 52
17. Kontogianni MD, Panagiotakos DB. Dietary patterns and stroke: A systematic review and
re-meta-analysis. Maturitas 2014;79(1):41-7.
18. Okubo H, Miyake Y, Sasaki S, Tanaka K, Murakami K, Hirota Y, Osaka M, Child Health
Study G, Kanzaki H, Kitada M, et al. Maternal dietary patterns in pregnancy and fetal growth
in Japan: the Osaka Maternal and Child Health Study. The British journal of nutrition
2012;107(10):1526-33.
19. Fearon JD. Ethnic and cultural diversity by country*. Journal of Economic Growth
2003;8(2):195-222.
20. Anand SS, Hawkes C, de Souza RJ, Mente A, Dehghan M, Nugent R, Zulyniak MA, Weis T,
Bernstein AM, Krauss RM, et al. Food Consumption and its Impact on Cardiovascular
Disease: Importance of Solutions Focused on the Globalized Food System: A Report From
the Workshop Convened by the World Heart Federation. J Am Coll Cardiol
2015;66(14):1590-614.
21. Lesser IA, Gasevic D, Lear SA. The association between acculturation and dietary patterns of
South Asian immigrants. PLoS One 2014;9(2):e88495.
22. Subbarao P, Anand SS, Becker AB, Befus AD, Brauer M, Brook JR, Denburg JA, HayGlass
KT, Kobor MS, Kollmann TR, et al. The Canadian Healthy Infant Longitudinal Development
(CHILD) Study: examining developmental origins of allergy and asthma. Thorax
2015;70:998-1000.
23. Morrison KM, Atkinson SA, Yusuf S, Bourgeois J, McDonald S, McQueen MJ, Persadie R,
Hunter B, Pogue J, Teo K. The Family Atherosclerosis Monitoring In earLY life (FAMILY)
study: rationale, design, and baseline data of a study examining the early determinants of
24. Anand SS, Vasudevan A, Gupta M, Morrison K, Kurpad A, Teo KK, Srinivasan K. Rationale
and design of south Asian birth cohort (START): a Canada-India collaborative study. BMC
public health 2013;13(1):79.
25. Wahi G, Wilson J, Miller R, Anglin R, McDonald S, Morrison KM, Teo KK, Anand SS.
Aboriginal birth cohort (ABC): a prospective cohort study of early life determinants of
adiposity and associated risk factors among Aboriginal people in Canada. BMC public health
2013;13(1):608.
26. Fred Hutchinson Cancer Research Center. Food Frequency Questionnaires (FFQ) [Internet].
[updated 03 November 2014].Available from
http://sharedresources.fhcrc.org/services/food-frequency-questionnaires-ffq.
27. Anand SS, Yusuf S, Vuksan V, Devanesen S, Teo KK, Montague PA, Kelemen L, Yi C,
Lonn E, Gerstein H, et al. Differences in risk factors, atherosclerosis and cardiovascular
disease between ethnic groups in Canada: the study of health assessment and risk in ethnic
groups (SHARE). Indian Heart J 2000;52(7 Suppl):S35-43.
28. Nutition esearch Division (Health Canada). Canadian Nutrient File (CNF). 2010.
29. Korpi-Hyovalti E, Schwab U, Laaksonen DE, Linjama H, Heinonen S, Niskanen L. Effect of
intensive counselling on the quality of dietary fats in pregnant women at high risk of
gestational diabetes mellitus. The British journal of nutrition 2012;108(5):910-7.
30. Kelemen LE, Anand SS, Vuksan V, Yi Q, Teo KK, Devanesen S, Yusuf S. Development and
evaluation of cultural food frequency questionnaires for South Asians, Chinese, and
Europeans in North America. Journal of the American Dietetic Association
31. Patterson RE, Kristal AR, Tinker LF, Carter RA, Bolton MP, Agurs-Collins T. Measurement
characteristics of the Women's Health Initiative food frequency questionnaire. Ann
Epidemiol 1999;9(3):178-87.
32. Nettleton JA, Polak JF, Tracy R, Burke GL, Jacobs DR. Dietary patterns and incident
cardiovascular disease in the Multi-Ethnic Study of Atherosclerosis. Am J Clin Nutr
2009;90(3):647-54.
33. Fung TT, Rimm EB, Spiegelman D, Rifai N, Tofler GH, Willett WC, Hu FB. Association
between dietary patterns and plasma biomarkers of obesity and cardiovascular disease risk.
Am J Clin Nutr 2001;73(1):61-7.
34. Hu FB, Rimm E, Smith-Warner SA, Feskanich D, Stampfer MJ, Ascherio A, Sampson L,
Willett WC. Reproducibility and validity of dietary patterns assessed with a food-frequency
questionnaire. Am J Clin Nutr 1999;69(2):243-9.
35. Gadgil MD, Anderson CAM, Kandula NR, Kanaya AM. Dietary Patterns in Asian Indians in
the United States: An Analysis of the Metabolic Syndrome and Atherosclerosis in South
Asians Living in America Study. Journal of the Academy of Nutrition and Dietetics
2014;114(2):238-43.
36. Huijbregts P, Feskens E, RŠsŠnen L, Fidanza F, Nissinen A, Menotti A, Kromhout D. Dietary
pattern and 20 year mortality in elderly men in Finland, Italy, and The Netherlands:
longitudinal cohort study. Bmj 1997;315(7099):13-7.
37. Huijbregts PP, Feskens EJM, Kromhout D. Dietary patterns and cardiovascular risk factors in
elderly men: the Zutphen Elderly Study. International journal of epidemiology
1995;24(2):313-20.
38. Kant AK. Indexes of overall diet quality: a review. Journal of the American Dietetic
39. Millen BE, Quatromoni PA, Gagnon DR, Cupples LA, Franz MM, D'Agostino RB. Dietary
patterns of men and women suggest targets for health promotion: the Framingham Nutrition
Studies. American Journal of Health Promotion 1996;11(1):42-51.
40. Kim J-O, Mueller CW. Factor analysis: Statistical methods and practical issues: Sage, 1978.
41. Satija A, Hu FB, Bowen L, Bharathi AV, Vaz M, Prabhakaran D, Reddy KS, Ben-Shlomo Y,
Davey Smith G, Kinra S, et al. Dietary patterns in India and their association with obesity and
central obesity. Public Health Nutr 2015;18(16):3031-41.
42. Willett W, Stampfer M. Implications of total energy intake for epidemiologic analysis. Edtion
ed. Monographs in epidemiology and biostatistics: Oxford University Press, 1998:273-301.
43. Northstone K, Ness AR, Emmett PM, Rogers IS. Adjusting for energy intake in dietary
pattern investigations using principal components analysis. European journal of clinical
nutrition 2007;62(7):931-8.
44. Catsburg C, Kim RS, Kirsh VA, Soskolne CL, Kreiger N, Rohan TE. Dietary patterns and
breast cancer risk: a study in 2 cohorts. Am J Clin Nutr 2015;101(4):817-23.
45. Chocano-Bedoya PO, O'Reilly EJ, Lucas M, Mirzaei F, Okereke OI, Fung TT, Hu FB,
Ascherio A. Prospective study on long-term dietary patterns and incident depression in
middle-aged and older women. Am J Clin Nutr 2013;98(3):813-20.
46. Dehghan M, Mente A, Teo KK, Gao P, Sleight P, Dagenais G, Avezum A, Probstfield JL,
Dans T, Yusuf S, et al. Relationship between healthy diet and risk of cardiovascular disease
among patients on drug therapies for secondary prevention: a prospective cohort study of 31
546 high-risk individuals from 40 countries. Circulation 2012;126(23):2705-12.
47. Guenther PM, Casavale KO, Reedy J, Kirkpatrick SI, Hiza HA, Kuczynski KJ, Kahle LL,
Krebs-Smith SM. Update of the Healthy Eating Index: HEI-2010. J Acad Nutr Diet
48. Mozaffarian D, Hao T, Rimm EB, Willett WC, Hu FB. Changes in diet and lifestyle and
long-term weight gain in women and men. New England Journal of Medicine
2011;364(25):2392-404.
49. Willett WC, Howe GR, Kushi LH. Adjustment for total energy intake in epidemiologic
studies. Am J Clin Nutr 1997;65(4):1220S-8S.
50. Thompson A. Thinking big: large-scale collaborative research in observational epidemiology.
European journal of epidemiology 2009;24(12):727-31.
51. Whitehead NS, Hammond JA, Williams MA, Huggins W, Hoover S, Hamilton CM, Ramos
EM, Junkins HA, Harlan WR, Hogue CJ. The PhenX Toolkit pregnancy and birth collections.
Annals of epidemiology 2012;22(11):753-8.
52. Brenner DR, Boucher BA, Kreiger N, Jenkins D, El-Sohemy A. Dietary Patterns in an
Ethnoculturally Diverse Population: Of Young Canadian Adults. Canadian Journal of
Dietetic Practice and Research 2011;72(3):e161-e8.
53. Li F, Hou L-n, Chen W, Chen P-l, Lei C-y, Wei Q, Tan W-l, Zheng S-b. Associations of
dietary patterns with the risk of all-cause, CVD and stroke mortality: a meta-analysis of
prospective cohort studies. British Journal of Nutrition 2015;113(01):16-24.
54. Olsen SF, Eva Birgisdottir B, Halldorsson TI, Brantsaeter AL, Haugen M, Torjusen H,
Petersen SB, Str¿m M, Meltzer HM. Possibilities and considerations when merging dietary
data from the world's two largest pregnancy cohorts: the Danish National Birth Cohort and
the Norwegian Mother and Child Cohort Study. Acta obstetricia et gynecologica
Scandinavica 2014;93(11):1131-40.
55. Han CY, Colega M, Quah EPL, Chan YH, Godfrey KM, Kwek K, Saw S-M, Gluckman PD,
Chong Y-S, Chong MF-F. A healthy eating index to measure diet quality in pregnant women
56. Balder HF, Virtanen M, Brants HAM, Krogh V, Dixon LB, Tan F, Mannisto S, Bellocco R,
Pietinen P, Wolk A. Common and country-specific dietary patterns in four European cohort
studies. The Journal of nutrition 2003;133(12):4246-51.
57. Thompson JM, Wall C, Becroft DM, Robinson E, Wild CJ, Mitchell EA. Maternal dietary
patterns in pregnancy and the association with small-for-gestational-age infants. The British
journal of nutrition 2010;103(11):1665-73.
58. Paeratakul S, Popkin BM, Kohlmeier L, Hertz-Picciotto I, Guo X, Edwards LJ. Measurement
error in dietary data: implications for the epidemiologic study of the diet-disease relationship.
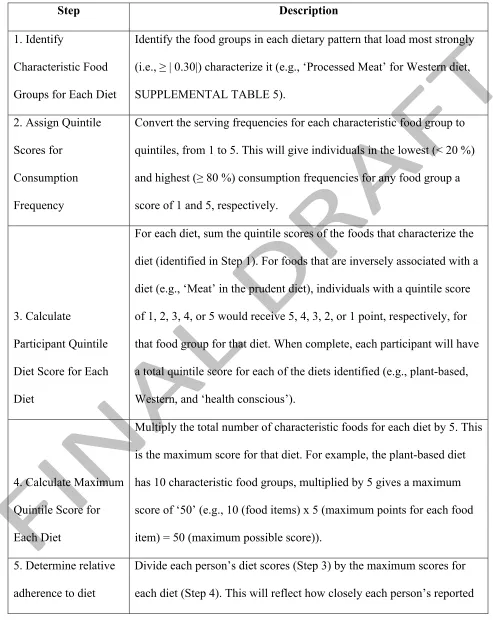
TABLE 1 - Quantification of quintile dietary scores for each individual within the NutriGen Alliance cohort.
Step Description
1. Identify
Characteristic Food
Groups for Each Diet
Identify the food groups in each dietary pattern that load most strongly
(i.e., ≥ | 0.30|) characterize it (e.g., ÔProcessed MeatÕ for Western diet,
SUPPLEMENTAL TABLE 5).
2. Assign Quintile
Scores for
Consumption
Frequency
Convert the serving frequencies for each characteristic food group to
quintiles, from 1 to 5. This will give individuals in the lowest (< 20 %)
and highest (≥ 80 %) consumption frequencies for any food group a
score of 1 and 5, respectively.
3. Calculate
Participant Quintile
Diet Score for Each
Diet
For each diet, sum the quintile scores of the foods that characterize the
diet (identified in Step 1). For foods that are inversely associated with a
diet (e.g., ÔMeatÕ in the prudent diet), individuals with a quintile score
of 1, 2, 3, 4, or 5 would receive 5, 4, 3, 2, or 1 point, respectively, for
that food group for that diet. When complete, each participant will have
a total quintile score for each of the diets identified (e.g., plant-based,
Western, and Ôhealth consciousÕ).
4. Calculate Maximum
Quintile Score for
Each Diet
Multiply the total number of characteristic foods for each diet by 5. This
is the maximum score for that diet. For example, the plant-based diet
has 10 characteristic food groups, multiplied by 5 gives a maximum
score of Ô50Õ (e.g., 10 (food items) x 5 (maximum points for each food
item) = 50 (maximum possible score)).
5. Determine relative
adherence to diet
Divide each personÕs diet scores (Step 3) by the maximum scores for
patterns dietary patterns match each of the identified dietary patterns on a scale
from 0% to 100%. For example, a person presenting scores of 34%
plant-based, 75% Western, and 47 % Ôhealth consciousÕ would suggest
that their diet is most similar to Western pattern, with foods common to
FIGURE LEGEND
FIGURE 1 Venn diagram of the similarity and differences between the food items queried within
individual study cohrts (i.e., ABC, CHILD, FAMILY, and START) that comprise the NutriGen
Alliance cohort (n=4,880). Unlisted similarities of foods questioned between studies are ≤ 10 %
similar.
ABC = Aboriginal Birth Cohort study; CHILD = Canadian Healthy Infant Longitudinal
Development study; FAMILY = Family Atherosclerosis Monitoring In earLY life study; START =
ONLINE SUPPORTING MATERIAL
SUPPLEMENTALTABLE 1 Ð Pre-Processing of Food Frequency Questionnaire (FFQ) data collected by individual study cohrots (i.e., ABC, CHILD, FAMILY, and START) that comprise the NutriGen Alliance cohort.
ABC CHILD FAMILY START TOTAL
Pre-Cleaning 126 3,047 839 1,006 5,018
Excluded
1. ≥ 10 Blank FFQ Questions 1 5 11 49 45 110
2. Implausible Caloric Range 2 9 9 10 0 28
Post-Cleaning 112 3,027 780 961 4,880
Data reflects number of individuals.
1
Participants who failed to provide information for ≥ 10 individual questions on their returned FFQ were excluded from the PCA (n=110)
2
Participants that reported implausible energy intakes on their returned FFQ of <500 or >6500 kcal per day were excluded from the PCA (n= 28)
ABC = Aboriginal Birth Cohort study; CHILD = Canadian Healthy Infant Longitudinal
ONLINE SUPPORTING MATERIAL
SUPPLEMENTALTABLE 2 - Food Frequency Questionnaire (FFQ) details across the ABC, CHILD, FAMILY, and START birth cohorts.
ABC, FAMILY and START CHILD
Origin McMaster/Hamilton Health Sciences
Fred Hutchinson Cancer Research Center
Items 157 - 169 questions 152 questions
Ethnic
Considerations
Each FFQ included ÒethnicÓ foods common to the respective cohort:
A single questionnaire was administered to all participants, regardless of ethnicity. Some ÒethnicÓ foods included as options, such as: game meat, ghee,
milkshakes, parathas, and samosas.
ABC Ð Aboriginal/First Nation foods: Indian corn soup, buffalo, and caribou.
FAMILY: Western/White European foods: milkshakes and fruit crisps.
START: South Asian foods: Ghee, raita, and sabji
Consumption
Frequency Open-ended
Categorical options (e.g. from <1/month to > 2 times/day)
Serving Size Equal between ABC, FAMILY, and START
Differences with McMaster-based FFQs
Analysis Using ESHA Food processor software Using NDS (Nutrition Data System)
Validation Kelemen et al.(59)
Fred Hutchinson Research Institute (26)
ABC = Aboriginal Birth Cohort study; CHILD = Canadian Healthy Infant Longitudinal
ONLINE SUPPORTING MATERIAL
SUPPLEMENTAL TABLE 3 - Food Frequency Questionnaire (FFQ) Servings per Week Harmonization across individual study cohorts that comprise the NutriGen Alliance cohort.
FFQ Servings Per Week
Harmonization Example
1. FAMILY, START, or ABC reported total consumption of food item per week
FAMILY, START, or ABC participant reports eating potatoes 3 times/week. Estimated intake 3 x ½ cup = 1 ½ cups of potatoes per week
2. Compare Serving Sizes
CHILD: Potatoes (Boiled, baked, or mashed), medium serving size = ¾ cup
FAMILY, START, or ABC: Potatoes (Boiled, mashed, or baked), medium serving size = ½ cup
3. Scale
To scale FAMILY, START or ABC participant servings to that of CHILD, their servings per week is multiplied by 0.66 (i.e.,
½ cup serving size divided by ¾ cup serving size).
4. Rescale
The adjusted serving per week is therefore 2 times/week (i.e., 3 servings/week x 0.666 = 2) using the CHILD serving size of ¾
cup of potatoes (i.e., 2 servings x ¾ cup = 1 ½ cup of potatoes/week)
Note: Where serving sizes differed between the FAMILY, START, or ABC FFQs and CHILD, the servings per week in FAMILY, START, or ABC were adjusted in order to match the serving sizes used in the CHILD FFQ. The nutrient database did not require adjustment as macronutrients and micronutrients were not calculated for this analysis but will require reporgramming in future analyses.
ABC = Aboriginal Birth Cohort study; CHILD = Canadian Healthy Infant Longitudinal
ONLINE SUPPORTING MATERIAL
SUPPLEMENTALTABLE 4 Ð Aggregated and Harmonized Food Groups across the four cohorts (ABC, CHILD, FAMILY, and START) that comprise the NutriGen Alliance Cohort.
Food Groups Food Items in Defined Food Groups
Fats Butter, margarine, oils, or ghee
Full Fat Dairy
Full-fat/homogenized milk, sour cream, cream soups, cottage and ricotta cheese, other cheeses
Low Fat Dairy Reduced-fat milk (all types) and low/reduced fat cheeses Fermented Dairy Yogurt, lassi, and raita
Meat Beef, pork, ham, lamb, veal, goat, game, and ground meat Eggs Boiled or fried whole eggs, egg whites, and egg substitutes Organ Meats Organ meats
Fish and Seafood Fish, canned tuna, tuna salad, tuna casserole, fish curry, and shellfish Processed Meats Hot dogs, bacon, breakfast sausages, lunch and canned meats.
Meat Dishes
Meat/chicken stews, pot pies, meat curries, chilies, burritos, tacos, ramen soup, other meat soups
Poultry Non-fried chicken Fried Foods Fried fish and chicken
Leafy Greens Green salad (lettuce), dark leafy greens, cooked greens, and raw greens Cruciferous
Vegetables
Broccoli, cabbage, naapa and Chinese cabbage, sauerkraut, cauliflower and Brussels sprouts
Legumes Bean soups, refried and dried beans, sambhar, and other beans. Fresh Seasonings Fresh garlic and chilies
Starchy
Vegetables Yams, sweet potatoes, and potatoes (baked, boiled, and mashed) Vegetable
Medley Corn and hominy, carrots, green peas, and French, green, and string beans
Other Vegetables
Tomatoes, peppers, squash, zucchini, kai lan, onion, okra, leeks, avocados, other vegetables
Tofu Tofu, tempe, and tofu products (hotdogs, soy, burgers, cheese)
Fruits
Apples, apple sauce, pears, bananas, peaches, nectarines, plums, apricots, berries, melons, lychees, rambuttan, papaya, mango, other fruits, and dried fruits
Whole Grains
Cooked Cereals, granola, cereal bars, roti, chapatis, pitas, naan, and brown and wild rice.
Refined Grains
Cold cereals, pancakes, French toast, waffles, muffins, scones, croissants, puri, idli and dosa, parathas, breads, corn bread, soft pretzels, white rice and noodles. Pasta Spaghetti and other pastas with tomato and meat and/or cheese.
Pizza Vegetable and meat pizzas French Fries French fries and hash browns
Non-Meat Dishes
Vegetable, tomato, minestrone, and miso soups, sambar, vegetable and potato curry, kofta, coleslaw, potato, macaroni and pasta salad, sports/meal
replacement bars.
Stir-Fried Dishes Stir-fried noodles and rice, steamed buns, wontons, and dumplings
Snacks
ONLINE SUPPORTING MATERIAL
ABC = Aboriginal Birth Cohort study; CHILD = Canadian Healthy Infant Longitudinal
Development study; FAMILY = Family Atherosclerosis Monitoring In earLY life study; START = SouTh Asian birth cohort study.
Sweets
Ice cream/milkshakes, desserts, jam, jelly, honey, pudding, custards, donuts, fruit crisps, pies, cookies, cakes, rasgolla, barfi, rasmali, gulab joman, jalebi, ladoo, candies, pop tarts.
Condiments
Salad dressing, stuffing, sauces, gravies, ketchup, salsa, chutney, and mayonnaise.
Tea Tea (all types)
Coffee Coffee and espresso drinks (regular or decaffeinated)
Sweet Drinks
ONLINE SUPPORTING MATERIAL
SUPPLEMENTAL TABLE 5 Ð Principal component analysis (PCA) food group loading scores. Food items with a loading score ≥ |0.30| are presented and characterize each of the three dietary patterns within the NutriGen Alliance cohort (n = 4,880).
1
Proportion of the total dietary variation in the dataset that is explained by considering 1, 2, or 3
Food Group
Plant-based Western
Health Conscious
Fats 0.55
Full Fat Dairy
Low Fat Dairy 0.39 0.41
Fermented Dairy 0.61
Meat (-0.35) 0.43 0.33
Eggs 0.36
Organ Meats
Fish and Seafood 0.50
Processed Meats 0.55
Meat Dishes 0.49
Poultry and Waterfowl 0.36
Fried Foods
Leafy Greens 0.38
Cruciferous Vegetables 0.55
Legumes 0.62
Fresh Seasonings 0.72
Starchy Vegetables 0.43
Vegetable Medley 0.43 0.47
Other Vegetables 0.70 0.32
Tofu
Fruits 0.52
Whole Grains 0.71
Refined Grains 0.35
Pasta 0.53
Pizza 0.32
French Fries 0.47
Non-Meat Dishes 0.63
Stir-Fried Dishes 0.47
Snacks 0.42
Nuts and Seeds 0.35
Sweets 0.46
Condiments 0.48 0.41
Tea 0.53
Coffee 0.34
Sweet Drinks 0.56
Artificial Sweets
Eigenvalue 4.02 3.30 3.05
Cumulative Variation 1 0.11 0.20 0.29
ONLINE SUPPORTING MATERIAL
SUPPLEMENTAL TABLE 6 Ð Range of quintile serving sizes for each food group within the Nutrigen Alliance cohort (n = 4,880).
Food Group
1st
Quintile 2nd Quintile 3rd Quintile 4th Quintile
5th Quintile
Fats < 0.07 ≥ 0.07 to < 0.3 ≥ 0.3 to < 0.5 ≥ 0.5 to < 1 ≥ 1 Full Fat Dairy < 0.18 ≥ 0.18 to < 0.5 ≥ 0.52 to < 1.0 ≥ 1.0 to < 1.5 ≥ 1.54 Low Fat Dairy < 0.29 ≥ 0.29 to < 0.8 ≥ 0.8 to < 1.3 ≥ 1.3 to < 2 ≥ 2.04 Fermented Dairy < 0.08 ≥ 0.08 to < 0.3 ≥ 0.3 to < 0.5 ≥ 0.5 to < 1 ≥ 1 Meat < 0.03 ≥ 0.03 to < 0.2 ≥ 0.2 to < 0.3 ≥ 0.33 to < 0.6 ≥ 0.6 Eggs < 0.09 ≥ 0.09 to < 0.2 ≥ 0.24 to < 0.4 ≥ 0.4 to < 0.6 ≥ 0.6
Organ Meats1 0 0 0 0 > 0
Fish and Seafood 0 > 0 to < 0.07 ≥ 0.07 to < 0.1 ≥ 0.14 to < 0.3 ≥ 0.3 Processed Meats 0 > 0 to < 0.1 ≥ 0.1 to < 0.2 ≥ 0.21 to < 0.5 ≥ 0.5 Meat Dishes < 0.03 ≥ 0.03 to < 0.1 ≥ 0.12 to < 0.2 ≥ 0.24 to < 0.4 ≥ 0.42 Poultry and
Waterfowl < 0.03 ≥ 0.03 to < 0.1 ≥ 0.1 to < 0.1 ≥ 0.14 to < 0.3 ≥ 0.3 Fried Foods < 0.01 ≥ 0.01 to < 0.06 ≥ 0.06 to < 0.1 ≥ 0.12 to < 0.2 ≥ 0.2 Leafy Greens < 0.13 ≥ 0.13 to < 0.3 ≥ 0.3 to < 0.5 ≥ 0.54 to < 1 ≥ 1 Cruciferous
Vegetables < 0.07 ≥ 0.07 to < 0.1 ≥ 0.14 to < 0.3 ≥ 0.3 to < 0.5 ≥ 0.5 Legumes 0 > 0 to < 0.1 ≥ 0.1 to < 0.2 ≥ 0.2 to < 0.4 ≥ 0.4 Fresh Seasonings < 0.07 ≥ 0.07 to < 0.3 ≥ 0.3 to < 0.5 ≥ 0.5 to < 1.2 ≥ 1.2 Starchy Vegetables < 0.07 ≥ 0.07 to < 0.1 ≥ 0.14 to < 0.2 ≥ 0.21 to < 0.4 ≥ 0.4 Vegetable Medley < 0.18 ≥ 0.18 to < 0.4 ≥ 0.4 to < 0.6 ≥ 0.6 to < 0.9 ≥ 0.91 Other Vegetables < 0.56 ≥ 0.56 to < 1 ≥ 1 to < 1.5 ≥ 1.5 to < 2.4 ≥ 2.4
Tofu1 0 0 0 > 0
Fruits < 1.12 ≥ 1.12 to < 1.8 ≥ 1.8 to < 2.5 ≥ 2.53 to < 3.6 ≥ 3.6 Whole Grains < 0.14 ≥ 0.14 to < 0.4 ≥ 0.42 to < 0.8 ≥ 0.83 to < 1.9 ≥ 1.9 Refined Grains < 0.66 ≥ 0.66 to < 1.2 ≥ 1.2 to < 1.7 ≥ 1.7 to < 2.3 ≥ 2.32 Pasta < 0.07 ≥ 0.07 to < 0.2 ≥ 0.2 to < 0.3 ≥ 0.3 to < 0.4 ≥ 0.41 Pizza < 0.07 ≥ 0.07 to < 0.1 ≥ 0.1 to < 0.1 ≥ 0.14 to < 0.2 ≥ 0.21 French Fries < 0.02 ≥ 0.02 to < 0.05 ≥ 0.05 to < 0.08 ≥ 0.08 to < 0.1 ≥ 0.14 Non-Meat Dishes < 0.08 ≥ 0.08 to < 0.2 ≥ 0.2 to < 0.3 ≥ 0.3 to < 0.6 ≥ 0.6 Stir-Fried Dishes 0 > 0 to < 0.04 ≥ 0.04 to < 0.1 ≥ 0.12 to < 0.2 ≥ 0.21 Snacks < 0.08 ≥ 0.08 to < 0.2 ≥ 0.2 to < 0.3 ≥ 0.32 to < 0.6 ≥ 0.6 Nuts and Seeds < 0.09 ≥ 0.09 to < 0.3 ≥ 0.3 to < 0.6 ≥ 0.6 to < 1.1 ≥ 1.1 Sweets < 0.83 ≥ 0.83 to < 1.4 ≥ 1.4 to < 2 ≥ 2.0 to < 2.9 ≥ 2.92 Condiments < 0.3 ≥ 0.3 to < 0.7 ≥ 0.7 to < 1.1 ≥ 1.1 to < 1.7 ≥ 1.7 Tea 0 > 0 to < 0.1 ≥ 0.1 to < 0.2 ≥ 0.21 to < 0.8 ≥ 0.8 Coffee 0 > 0 to < 0.03 ≥ 0.03 to < 0.1 ≥ 0.14 to < 0.5 ≥ 0.5 Sweet Drinks < 0.14 ≥ 0.14 to < 0.3 ≥ 0.3 to < 0.6 ≥ 0.6 to < 1.2 ≥ 1.2
Artificial Sweets1 0 0 0 0 > 0
1
ONLINE SUPPORTING MATERIAL
SUPPLEMENTAL TABLE 7 - Principal component analysis (PCA) food group loading scores with each of the 7 ethnicities included as independent variables alongside FFQ data. Food items with a loading score ≥ |0.30| are presented and characterize each of the three dietary patterns within the NutriGen Alliance cohort (n = 4,880).
Food Group
Plant-based Western
Health Conscious
Fats 0.53
Full Fat Dairy
Low Fat Dairy 0.34 0.42
Fermented Dairy 0.59
Meat (-0.33) 0.39 0.36
Eggs 0.37
Organ Meats
Fish and Seafood 0.51
Processed Meats 0.52
Meat Dishes 0.49
Poultry and Waterfowl 0.36
Fried Foods
Leafy Greens 0.35
Cruciferous Vegetables 0.54
Legumes 0.63
Fresh Seasonings 0.76
Starchy Vegetables 0.45
Vegetable Medley 0.42 0.42
Other Vegetables 0.69 Tofu
Fruits 0.48
Whole Grains 0.70
Refined Grains 0.36
Pasta 0.53
Pizza 0.31
French Fries 0.42
Non-Meat Dishes 0.65
Stir-Fried Dishes 0.54
Snacks 0.40
Nuts and Seeds 0.30
Sweets 0.44
Condiments 0.47 0.38
Tea 0.53
Coffee 0.35
Sweet Drinks 0.54
Artificial Sweets Aboriginal
ONLINE SUPPORTING MATERIAL
African
White European (-0.53) 0.35 Other
DonÕt Know
Eigenvalue 4.85 3.42 3.15
Cumulative Variation 1 0.11 0.19 0.27 Correlation with PCA
without Ethnicity (r2) 0.97 0.94 0.96
1