This is a repository copy of The beam and detector of the NA62 experiment at CERN.
White Rose Research Online URL for this paper:
http://eprints.whiterose.ac.uk/150262/
Version: Published Version
Article:
Gil, EC, Albarran, EM, Minucci, E et al. (293 more authors) (2017) The beam and detector
of the NA62 experiment at CERN. Journal of Instrumentation, 12. ISSN 1748-0221
https://doi.org/10.1088/1748-0221/12/05/P05025
Reuse
This article is distributed under the terms of the Creative Commons Attribution (CC BY) licence. This licence allows you to distribute, remix, tweak, and build upon the work, even commercially, as long as you credit the authors for the original work. More information and the full terms of the licence here:
https://creativecommons.org/licenses/
Takedown
If you consider content in White Rose Research Online to be in breach of UK law, please notify us by
Journal of Instrumentation
OPEN ACCESS
The beam and detector of the NA62 experiment at
CERN
To cite this article: E. Cortina Gil et al 2017 JINST 12 P05025
View the article online for updates and enhancements.
Related content
Level Zero Trigger Processor for the NA62 experiment
D. Soldi and S. Chiozzi
-Status of the NA62 liquid krypton electromagnetic calorimeter Level 0 trigger processor
V Bonaiuto, L Federici, A Fucci et al.
-Performance and advantages of a soft-core based parallel architecture for energy peak detection in the calorimeter Level 0 trigger for the NA62 experiment at CERN R. Ammendola, M. Barbanera, M. Bizzarri et al.
-Recent citations
Searching for dark sector with missing mass technique in fixed target experiments Venelin Kozhuharov et al
-Flavor constraints on electroweak ALP couplings
M. B. Gavela et al
-Status of the NA62 ring imaging Cherenkov detector
-2017 JINST 12 P05025
Published by IOP Publishing for Sissa Medialab
Received:March 27, 2017 Accepted:May 2, 2017 Published:May 31, 2017
The beam and detector of the NA62 experiment at CERN
The NA62 collaboration
E-mail: [email protected]
Abstract: NA62is a fixed-target experiment at the CERN SPS dedicated to measurements of rare kaon decays. Such measurements, like the branching fraction of theK+ → π+νν¯ decay, have the potential to bring significant insights into new physics processes when comparison is made with precise theoretical predictions. For this purpose, innovative techniques have been developed, in particular, in the domain of low-mass tracking devices. Detector construction spanned several years from 2009 to 2014. The collaboration started detector commissioning in 2014 and will collect data until the end of 2018. The beam line and detector components are described together with their early performance obtained from 2014 and 2015 data.
Keywords: Large detector systems for particle and astroparticle physics; Calorimeters; Cherenkov detectors; Particle tracking detectors
2017 JINST 12 P05025
Contents
1 Introduction 1
1.1 Physics motivation 1
1.2 Performance requirements 1
2 Design and analysis principles 3
2.1 Choice of detector layout 3
2.2 Data samples for performance studies 5
3 High intensity kaon beam line 6
3.1 K12 beam line layout 7
3.2 Beam parameters and particle rates 11
4 Kaon Tagger (KTAG) 12
4.1 Design and construction 12
4.2 Performance withN2radiator gas in 2015 14
5 Beam spectrometer (GTK) 16
5.1 Design and construction 18
5.2 Performance in 2015 20
6 Charged anti-coincidence detector (CHANTI) 22
6.1 Design and construction 22
6.2 Front-end electronics 24
6.3 Performance in 2015 24
7 Straw spectrometer (STRAW) 26
7.1 Design and construction 26
7.2 Calibration and operation 28
7.3 Performance in 2015 31
8 Photon-veto system (PV) 33
8.1 Large-angle veto system (LAV) 34
8.1.1 Design and layout 34
8.1.2 Construction details 36
8.1.3 Front-end electronics 38
8.2 Liquid Krypton calorimeter (LKr) 39
8.3 Small-angle veto system (SAV) 40
8.3.1 Small-angle calorimeter (SAC) 40
8.3.2 Intermediate-ring calorimeter (IRC) 41
8.3.3 SAV readout 42
2017 JINST 12 P05025
8.4.1 LAVperformance 43
8.4.2 LKr performance 44
8.4.3 SAV performance 46
9 Ring imaging Cherenkov counter (RICH) 47
9.1 Radiator vessel description 48
9.2 Mirror layout 49
9.3 Photon detection system 50
9.4 Performance in 2014 and 2015 52
10 Charged particle hodoscopes 53
10.1 NA48 hodoscope (NA48-CHOD) 54
10.2 Hodoscope (CHOD) 57
11 Muon veto system (MUV) 58
11.1 Hadron calorimeter (MUV1, MUV2) 59
11.1.1 Design and construction 59
11.1.2 Readout and calibration 60
11.1.3 Performance in 2015 62
11.2 Fast muon veto (MUV3) 63
12 Additional veto detectors 64
12.1 Peripheral muon veto (MUV0) 64
12.2 Hadronic sampling calorimeter (HASC) 66
13 Trigger and data acquisition system (TDAQ) 66
13.1 Common signal distribution 68
13.2 Common TDC-based trigger and readout system (TEL62 and TDCB) 70
13.3 GTK readout system 71
13.4 STRAW tracker readout system 73
13.5 Calorimeter readout system 74
13.6 Level 0 hardware trigger 78
13.6.1 TDC-based level 0 trigger primitives 79
13.6.2 Calorimeter level 0 trigger (Cal-L0) 81
13.6.3 Level 0 trigger processor (L0TP) 85
13.6.4 GPU-based level 0 trigger 87
13.7 High level triggers (HLT) 88
14 Online system, data handling and control 90
14.1 PC farm and data handling 90
14.2 Run control 92
2017 JINST 12 P05025
15 Performance validation 97
15.1 Advanced single track selection 97
15.2 Kinematic resolution 97
15.3 Particle identification 99
15.4 Photon rejection 101
15.5 Further opportunities for NA62 102
16 Conclusion 102
The NA62 collaboration 109
1 Introduction
1.1 Physics motivation
Investigation of quark mixing and CP violation in K and B meson decays has been one of the
most active areas of high-energy physics in past decades. The present knowledge of the
Cabibbo-Kobayashi-Maskawa quark-mixing matrix [1,2] is based on both precise experimental
measure-ments and theoretical calculations.
In the Standard Model (SM), charged weak currents are responsible for the transitions between quarks. The properties of these transitions have significant implications. For instance, the con-servation of probability leads to the cancellation of flavour-changing neutral currents (FCNC) at
tree level, known as the GIM mechanism [3]. This suppression makes the observation of FCNC a
sensitive test of the SM: any deviation from predictions would give a clear sign of physics beyond the SM.
Within the SM, one can determine fundamental parameters such as quark masses, mixing parameters and phenomenological quantities (e.g. decay constants and form factors) allowing the interpretation of the observed properties of hadrons in terms of the fundamental quark constituents. In another approach, one can fix the SM parameters using theoretical and phenomenological determinations to make firm predictions and look for deviations in the data. The latter approach works particularly well for kaons because lattice QCD and Chiral Perturbation Theory are excellent tools in this domain. While the energy frontier is limited by the reach of the Large Hadron Collider (LHC) in terms of centre-of-mass energy, no such limitation exists in principle for rare decays, making them a highly valued complementary approach in the search for new phenomena.
The theoretical [4] and experimental [5,6] status of the most interesting rare kaon decays is displayed in table1. The gap between theory and experiment is striking: the main goal of the NA62 experiment [7] is to match the 10% theory precision for theK+→π+νν¯decay rate.
1.2 Performance requirements
Collecting ∼100 K+→π+νν¯ events (based on the assumption of the SM branching ratio) and
assuming a 10% detector acceptance means an exposure to 1013 kaon decays and achieving a
2017 JINST 12 P05025
Table 1.Expected and measured branching fractions ofK →πνν¯decays.
Decay mode Branching ratio (×1010)
Theory [4] Experiment [5,6]
K+→π+νν¯ 0.84±0.10 1.73+1.15
−1.05
KL →π0νν¯ 0.34±0.06 <260(90% CL)
very simple: one incoming kaon decays to a single-detected charged-pion track, and is weakly constrained compared to all other kaon decays. Kinematic rejection of the most abundant kaon decay modes is obtained by selecting two restricted regions (Region I and Region II, as shown in figure1-left) of them2missdistribution defined as:
m2miss=(PK−Pπ)2, (1.1)
wherePKis the 4-momentum of the parent particle, assumed to be a kaon andPπis the 4-momentum of the decay particle, assumed to be a pion.
-0.04 -0.02 0 0.02 0.04 0.06 0.08 0.1 0.12
0 0.02 0.04 0.06 0.08 0.1 0.12 0.14 0.16 0.18 0.2 ) γ ( µ ν + µ → + K ) γ ( 0 π + π → + K ) 10 10 × ( ν ν + π → + K -π + π + π → + K
Region I Region II
m2miss[GeV2/c4]
1 / Γtot d Γ / d m 2 miss
-0.04 -0.02 0 0.02 0.04 0.06 0.08 0.1 0.12
-7 10 -6 10 -5 10 -4 10 -3 10 -2 10 -1 10 1 ) γ ( µ ν + µ → + K e ν 0 π + e → + K µ ν 0 π + µ → + K ) γ ( 0 π + π → + K ) 10 10 × ( ν ν + π → + K -π + π + π → + K 0 π 0 π + π → + K e ν + e -π + π → + K
m2miss[GeV2/c4]
1 / Γtot d Γ / d m 2 miss
Figure 1. Distribution of them2
missvariable for kaon decay modes with the largest contribution (left, linear
scale); all decay modes (right, log scale).
The control of the resolution of the K+→π+π0 peak at the level of 0.001
(GeV/c2)2 is mandatory to obtain a kinematic rejection factor ofO(104–105)as seen in figure1. To achieve this
resolution, the momentum and angle of the kaon must be measured with a precision of∼0.2% and
0.016 mrad, respectively, while the momentum and angular resolutions for the downstream track must be better than 1% and 0.060 mrad, respectively.
Charged-particle identification (to reject muons with respect to pions) and photon rejection (to rejectπ0 decays to photons and radiative decays), ofO(107)andO(108), respectively, should complement the background rejection in Region I and Region II.
2017 JINST 12 P05025
2 Design and analysis principles
2.1 Choice of detector layout
The choice of the decay-in-flight technique is motivated by the possibility of obtaining an integrated flux ofO(1013)kaon decays over a few years of data-taking with a signal acceptance of about 10%, leading to the collection of about 100 SM events in theK+→π+νν¯ channel.
The 400 GeV/c proton beam from the CERN SPS accelerator enables the production of a
75 GeV/csecondary kaon beam. The advantage of using a high-energy proton beam is the reduction of non-kaon-related accidental background due to the higher kaon production cross section. The disadvantage of high-energy protons and, consequently, of a high-energy secondary beam, is that pions and protons cannot be separated efficiently from kaons. During the SPS spill of 3 s effective duration, the particle rate in the NA62 positive secondary hadron beam is 750 MHz, of which
about 6% is fromK+, leading to 5 MHz ofK+ decays in the 65 m long decay region. Therefore
the upstream detectors that measure the momentum and the direction of the incoming kaons are exposed to a particle flux about 16 times larger than the kaon flux. Note that 75% of the kaons do not decay before hitting the beam dump at the end of the beam line. Thekaon beam lineproperties are described in section3.
The scale and reference system for the experimental layout are displayed in figure2. The beam line defines the Z axis with its origin at the kaon production target and beam particles travelling in the positive direction, the Y axis points vertically up, and the X axis is horizontal and directed to form a right-handed coordinate system.
x
100 150 200 250
0 Z [m] x 0 -1 -2 1 2 Y [ m ]
x x x x x x x x x x x x Decay Region CHANTI GTK LAV KTAG Target MUV1,2 STRAW IRC LKr Vacuum MUV3 Iron SAC RICH RICH Dump CHOD
Figure 2. Schematic vertical section through the NA62 experimental setup. The main elements for the
detection of the K+decay products are located along a 150 m long region starting 121 m downstream of
the kaon production target. UsefulK+ decays are detected in a 65 m long decay region. Most detectors
have an approximately cylindrical shape around the beam axis. An evacuated passage surrounding the beam trajectory allows the intense (750 MHz) flux of un-decayed beam particles to pass through without interacting with detector material before reaching the dump.
2017 JINST 12 P05025
between the incoming kaon and the outgoing charged particle is essential to keep the correct association probability greater than 99% and must be kept under control at the level of 100–150 ps. Kaon identification is provided by a CEDAR differential Cherenkov counter equipped with a photon
detection systemKTAG. Section 4 gives detailed information on the design and performance of
the KTAG.
The beam spectrometerGTKconsists of three silicon pixel stations providing momentum and
direction measurements of the incoming kaons. A low-mass tracking system is essential to minimize inelastic scattering of beam particles in the detector material that could mimic an isolated outgoing charged particle from a decay. Information on the design and performance of the beam tracker
is found in section5. The guard ring detectorCHANTI(for CHarged Anti-coincidence detector),
installed downstream of the GTK to detect inelastic scattering interactions in the last station, is described in section6.
Downstream of the decay region, theSTRAW tracker measures the trajectories and momenta
of the charged products ofK+decays. To minimize multiple scattering, the straw chambers, which are constructed of ultra-light material, are installed inside the vacuum. The tracker consists of four chambers and a large-aperture dipole magnet (MNP33) providing a momentum kick to charged
particles of 270 MeV/c in the horizontal plane. A description of the spectrometer design and
performance is given in section7.
A system of photon-veto detectors provides hermetic coverage for photons produced in the decay region and propagating at angles up to about 50 mrad with respect to the detector axis. These detectors (section8) include, from larger to smaller angular coverage:
• a series of 12 annular Large-Angle photon Veto detectors (LAV);
• the Liquid Krypton electromagnetic calorimeter (LKr);
• the Intermediate-Ring (IRC) and Small-Angle (SAC) calorimeters.
The Ring Imaging CHerenkov detectorRICH situated downstream of the last straw chamber
includes a 17 m long radiator volume filled with neon gas at one atmosphere and ensures the separation of electrons, muons, pions, and kaons. Details of its design and performance are given in section9.
The RICH detector is followed by a system of hodoscope counters CHODconstructed from
scintillator slabs and tiles (section10). The counters provide a time resolution of∼150 ps, which is precise enough to define the reference trigger time for other detectors.
Two hadronic calorimeters (MUV1, MUV2) and a plane of scintillating tiles (MUV3) behind 80 cm of iron form a pion/muon identification system, as explained in section11.
Additional counters installed at optimized locations provide hermetic coverage for charged particles produced in multi-track kaon decays; they are described in section12.
The detectors are operated and interconnected by a high-performance trigger and data
ac-quisition system (TDAQ, section13). TheOnlineData handling, Control and safety aspects are
documented in section14.
Lastly, section15 focuses on the validation of performances obtained using data recorded in
2017 JINST 12 P05025
2.2 Data samples for performance studies
Specifically selected data samples are used to evaluate the detector performance. Two types of beam configurations are employed for this purpose: 1) standard “kaon runs”, using the beam line as described in section3, and 2) special “muon runs”, where the slits in the collimators of the first beam line achromat (TAX1,2) are closed to dump the secondary beam and to generate a relatively pure flux of muons illuminating almost uniformly the downstream detectors.
The analysis of kaon run data requires further event selection to identify and exploit particular decay modes, likeK+→π+π−π+,K+→µ+νandK+→π+π0.
Three-track event samples: theK+→π+π−π+decay offers a tool to fine tune the calibration of the straw spectrometer by comparing the reconstructed three-pion mass with the Particle Data Group (PDG) [8] kaon mass, to measure the average kaon direction and momentum, to study the properties of the beam and to calibrate the GTK beam spectrometer. The selection ofK+→π+π−π+decays requires at least three tracks reconstructed in the straw spectrometer. A least-squares vertex fit including the effect of the residual magnetic field measured in the decay region defines the position of the origin of the three tracks (decay vertex). Cuts on the longitudinal position of the decay vertex, typically between 105 and 180 m from the target, and on the fit quality are used to select the final sample.
Single-track event samples: single track decays, as in K+→µ+νandK+→π+π0 modes, are used to study particle identification and photon rejection. These events are selected by requiring a single track reconstructed in the straw spectrometer and a CHOD signal geometrically compatible to within 50 mm of the track extrapolation. The CHOD signal is the time reference for the charged particle in the final state. The squared missing mass is the main kinematic variable in the analysis. It is defined as
m2miss=(PK−Pparticle)2, (2.1)
where PK denotes the 4-momentum of the parent particle assumed to be a kaon andPparticle the
4-momentum of the decay particle assumed to be a muon or a pion, depending on the selection. PK
is obtained from the average kaon momentum and direction, as measured fromK+→π+π−π+. The closest distance of approach (CD A) between the track reconstructed in the STRAW spectrometer and the nominal kaon direction defines the position of the kaon decay vertex. Cuts onCD Aand the longitudinal vertex coordinate (Zvertex) are employed to select kaon decays, thus
rejecting the beam-halo contribution. Studies that use data samples with very low background contamination can also use the event-by-event kaon momentum and direction measured by the GTK
tracker. In this case theCD Abetween the tracks measured in the STRAW spectrometer and in the
GTK tracker is used together with timing information to match the initial- and final-state tracks. Typical cuts areCD A < 25(10) mm and 125(105) < Zvertex < 165 m from the target for events
reconstructed without (with) the GTK.
To selectK+→µ+νdecays, the muon mass is assigned toP
particlein eq. (2.1) and a cut around
the square of the corresponding neutrino mass is used to select the sample kinematically. A typical cut compatible with the kinematic resolution is|m2miss| <0.01(GeV/c2)2. Depending on the type
2017 JINST 12 P05025
in LKr, LAV, IRC and SAC; presence of hits in MUV3 to study MUV1,2 performance; calorimetric conditions selecting minimum ionizing particles to study MUV3 response; combined information from MUV3 and calorimeters to study muon identification in RICH.
To selectK+→π+π0decay candidates, the charged-pion mass hypothesis is used in eq. (2.1)
together with the condition 0.012 < m2miss < 0.025 (GeV/c2)2. Additional requirements may
include a signal from the KTAG in time with π+; no MUV3 hits in time with theπ+; use of the
photon detectors to select different π0→γγ topologies; calorimetric conditions in LKr, MUV1,
and MUV2 for pion identification to study, for example, the RICH performance.
Calorimeter-selected event samples: another strategy to selectK+→π+π0samples makes use
of the LKr electromagnetic calorimeter to reconstruct theπ0without employing the straw spectrom-eter forπ+reconstruction. This selection is used to study the straw spectrometer performance. In this case, events with at least two clusters of energy deposition in the LKr calorimeter with energies above 3 GeV are selected. The longitudinal coordinate of the decay vertex (Zvertex) is computed
from the cluster energies and positions under the hypothesis that they are produced by photons from the decay of a π0 . Events are selected if exactly one pair of clusters satisfies the condition 115 < Zvertex < 170 m from the target. The position of the vertex allows the 4-momentum of
theπ0 (Pπ0) to be computed, and the expected momentum of theπ+is derived using the average
kaon momentum and direction measured fromK+→π+π−π+. A LKr cluster and a CHOD signal
associated with the expected position of the π+impact point are required to clean up the sample further. A cut on the squared missing mass defined by eq. (2.1) (where Pparticle = Pπ0) around the squared mass of the charged pion is the final condition and reduces the background below the percent level.
3 High intensity kaon beam line
The primary proton beam is extracted at 400 GeV/cfrom the CERN SPS accelerator and directed
via the P42 beam line to the T10 target (400 mm long, 2 mm diameter beryllium) located in a
tunnel connecting the SPS to the underground experimental hall [9]. A “straight-line” layout,
joining the target station T10 to the centre of the existing LKr calorimeter, has been adopted for the positively charged secondary beam. This secondary, high-intensity hadron beam (K12) is derived
from the T10 target at a central momentum of+75 GeV/c, chosen both in sign and magnitude to
maximize the fraction of kaons with respect to the flux of incident protons and to other hadrons in the beam. A front-end momentum selection and a downstream momentum measurement are then each performed by an “achromat” consisting of four dipole magnets. The first pair of magnets in each achromat produces a parallel displacement of the beam, while the second pair returns it to the undeviated axis. The advantages of such a design are that it saves longitudinal space, is favourable for sweeping away muon background and keeps open possible future options of providing either two simultaneous, oppositely chargedK±beams (as for the NA48/2 experiment [10]) or a neutral
KL beam (as for the NA48 experiment [11]). The K12 beam line has a length of 101.3 m up to
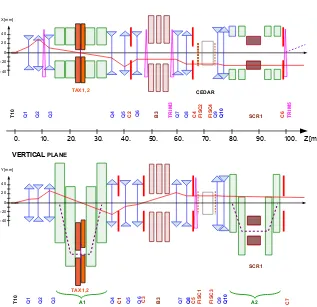
the final collimators (C6, C7). Figure3schematically shows the beam optics, calculated using the
2017 JINST 12 P05025
Q 4 Q 8 TAX1,2A1 Q9 A2
Q 1 Q 2 Q 3 Q 5 Q 7 Q 1 0 SCR1 T 1 0 Q 6
HORIZONTAL PLANE
VERTICAL PLANE
C 5 F IS C 1 F IS C 3 C 7 C 3 C 1 TAX1,2 Q 8 C 2 C 6 CEDAR T R IM 3 Q 9 Q 1 Q 2 Q 3 Q 4 Q 5 Q 7 Q 1 0 B 3 SCR1 T 1 0 Q 6 C 4 F IS C 2 F IS C 4 B 3
I I I I I I I I I I I 0. 10. 20. 30. 40. 50. 60. 70. 80. 90. 100. Z [m]
[image:12.595.134.451.99.406.2]Y[mm] 40 20 0 -20 -40 X[mm] 40 20 0 -20 -40 T R IM 5
Figure 3.Schematic layout and optics of the high-intensityK+beam from the T10 target to the entrance of
the decay region. In each view, the solid line corresponds to the trajectory of a particle leaving the target from the centre at nominal momentum and at the angle indicated. The dashed line indicates the trajectory of
an initially on-axis 75 GeV/cmomentum particle.
3.1 K12 beam line layout
The T10 target is immediately followed by a 950 mm long, water-cooled, copper collimator, offering a choice of bores of different apertures; a 15 mm diameter hole is generally selected to transmit the desired secondary particles. The first active elements of the high-intensity beam are a triplet of radiation-hard, small-aperture, quadrupole magnets (Q1, Q2, Q3), which collect a large solid angle
acceptance (± 2.7 mrad horizontally and ±1.5 mrad vertically) at 75 GeV/c central momentum
(figure3). Shortly downstream follows a front-end achromat (A1) to select the beam of 75 GeV/c
with a 1% rms momentum bite. The achromat consists of four vertically-deflecting dipole magnets. The first two magnets produce a parallel downward displacement of the beam by 110 mm, while the following two magnets return the beam onto the original axis. In between, the beam passes through a set of graduated holes in two motorized and water-cooled beam-dump units, TAX1 and TAX2, to make the momentum selection whilst absorbing the remaining primary proton beam and unwanted secondary particles (figure3).
2017 JINST 12 P05025
into the beam. It is optimized to cause positrons to lose sufficient energy by Bremsstrahlung for them to be subsequently rejected, whilst minimizing the loss of hadrons by scattering.
A following triplet of quadrupoles (Q4, Q5, Q6) serves to refocus the beam in the vertical plane and to render it parallel with limited width in the horizontal plane. The drift-space between these quadrupoles is occupied by two collimators (C1, C2), which redefine the vertical and horizontal acceptance of the transmitted beam. A subsequent collimator (C3) redefines the beam at the second focus in the vertical plane. At this point the positrons that have been degraded in momentum by the radiator between TAX1 and TAX2 are sufficiently separated from the hadron beam to be absorbed in the C3 collimator.
The beam then passes through a 40 mm diameter, almost field-free bore, in iron plates which are inserted between the poles of three 2 m long dipole magnets (B3). The vertical magnetic field in the iron surrounding the beam serves to sweep aside muons of both signs, whilst the deviation of the beam due to the small stray-field inside the bore is cancelled by two steering dipoles (TRIM 2 and TRIM 3 before and after B3).
A differential Cherenkov counter (CEDAR) [13] equipped with 8 new arrays of photodetectors
(KTAG) serves to identify theK+in the beam (section4). This requires the beam to be rendered parallel, for which purpose the CEDAR is preceded by two quadrupoles (Q7, Q8), as well as by horizontal and vertical cleaning collimators (C4, C5) to absorb particles in the tails of the beam.
Two pairs (vertical and horizontal) of filament scintillator counters (FISC 1, 3 and FISC 2, 4) are installed up- and downstream of the CEDAR. When connected in coincidence respectively, they permit the mean divergence of the beam to be measured and tuned to zero and the remaining, intrinsic divergence to be verified in each plane (figure4).
X [mm]
mean−14.8mm
rms 0.5 mm
counts
[arbirar
y
unit]
Y [mm] mean−8.9mm
rms 0.5 mm
Figure 4. Profiles of particles in the horizontal (FISC4) and vertical (FISC3) plane of the FISC filament
counter downstream of the CEDAR that have also traversed the corresponding upstream FISC counter. The mean and rms values shown correspond to the bins in the peak region (coincidence rate above the threshold
line), the rms widths of∆X=∆Y=0.5mm correspond to angular divergences of 0.07 mrad.
Following the CEDAR, a doublet of relatively weakly-focusing quadrupoles (Q9, Q10) match
the beam through the tracking and momentum-measurement stage, shown schematically in figure5,
2017 JINST 12 P05025
The beam tracking system GTK (section5) consists of three stations, each composed of silicon
pixel detectors installed in the beam vacuum. The stations are arranged so that the space between GTK1 and GTK3 is occupied by a second achromat (A2), composed of four, vertically-deflecting, C-shaped dipole magnets. The return yokes of the third and fourth magnets, as well as a toroidally-magnetized iron collimator SCR1, defocus muons which leave the beam in the momentum-dispersed
section between the second and third magnets of the achromat (figure5). GTK2 is located in the
same section, just after the magnetic collimator SCR1, where the+75GeV/cbeam has a parallel,
downward displacement of∆Y = −60 mm and hence a dispersion of 0.6 mm per percent∆p/p.
[image:14.595.122.473.255.583.2]GTK 3, located at 102.4 m from the target, marks the entrance plane at the beginning of the decay region. The cleaning collimators (C6 ,C7) preceding GTK3 are intended to intercept background outside the beam acceptance.
Figure 5. Schematic layout of the beam tracking and momentum measurement in the second achromat
(A2). The beam is deflected vertically by 60 mm and returned to its nominal direction after the momentum measurement. Muons are swept away by the scraper SCR1 and the return yokes of the last two C-shaped magnets of the achromat (dark shaded areas).
2017 JINST 12 P05025
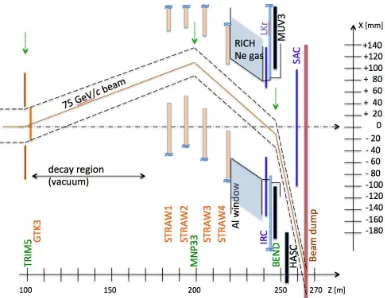
Figure 6.Close view of the beam line layout through the decay region and the detectors in the (X, Z) plane.
At the entrance of the decay region the beam has a horizontal angle of+1.2mrad, the beam is then deflected
in the spectrometer magnet MNP33 by−3.6mrad to match the central aperture of the LKr calorimeter. After
MUV3, the dipole magnet BEND deflects charged particles associated with the beam away from the SAC and sends them into the beam dump. The dashed lines correspond to the two sigma width of the beam profile. The vertical arrows indicate the bending centre of each magnet. Note the different scales along the two axes.
The decay region is contained in the first 60 m of a large 117 m long tank, starting 102.4 m downstream of the target. This tank is evacuated to a residual pressure of∼10−6mbar using up to seven cryo-pumps. The tank hosts 11 LAV detectors and the four spectrometer STRAW chambers, and consists of 19 cylindrical sections made of steel or stainless steel. The vessel diameter increases from 1.92 m in the first section after GTK3 to 2.4 m in the middle section and to 2.8 m in the spectrometer region. Every second component (LAV, STRAW or vacuum vessel element) has an extendible flange (telescopic extension of the tube) with a sliding vacuum seal. When retracted, these flanges provide enough longitudinal space to allow the removal of one of the detector elements. The vacuum tank is closed off at its downstream end by a thin aluminium window (2 mm thickness), separating the tank from the neon gas of the 17 m long RICH counter. The flange around a hole in the centre of the window is attached to a thin-walled aluminium beam tube of inner diameter 168 mm, displaced to X= +34mm and converging to the reference axis at an angle of−1.8mrad
to follow the trajectory of the beam, which is thus transported in vacuum throughout the length of the detectors (figure6).
2017 JINST 12 P05025
a 118 mm diameter material-free passage around the beam path. The dipole magnet provides a
horizontal momentum kick of 270 MeV/cdeflecting the 75 GeV/c beam by−3.6 mrad, so as to
converge to, and then cross the undeviated axis at a point 2.8 m downstream of the centre of the LKr calorimeter (figure6).
Close to this crossing point, a pair of larger filament scintillator counters (FISC 5, 6), installed
in vacuum, allows the beam to be observed and steered correctly (figure7). The beam is finally
deflected towards negative X through a further angle of−13.2 mrad by a dipole magnet (BEND), so as to clear the SAC (section8.3), located inside the beam vacuum vessel, 11.8 m further downstream. The beam is finally absorbed in a beam dump composed of iron surrounded by concrete at a sufficient distance behind the detector to diminish the effects of back-splash. To monitor the profile and intensity of the beam, a wire chamber with analogue readout and an ionization chamber are located in the space between the vacuum exit window and the beam dump. A more detailed description of the beam can be found in [14].
X [mm] mean 2.8 mm
rms 13.4 mm
counts
[arbirar
y
unit]
Y [mm] mean 3.0 mm
rms 18.5 mm
Figure 7. Beam profile in the filament scintillator counters located downstream of the LKr calorimeter in
the horizontal (FISC6) and vertical (FISC5) plane. The mean and rms values correspond to the bins above the threshold line.
3.2 Beam parameters and particle rates
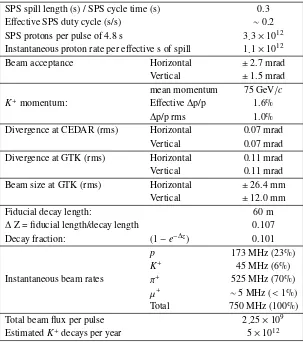
The principal characteristics of the high-intensityK+beam are listed in table2, where the effective solid angle and momentum acceptance, as well as the beam sizes and divergences, are calculated using the ray-tracing programTURTLE[15]. The design particle composition of the 75 GeV/cbeam
is obtained by interpolation of data at 60 and 120 GeV/caccording to the empirical formula in [16]. The muons accompanying a secondary beam contribute a major part of the single-particle flux
to which the detectors outside the beam are exposed. The transport and decay to µ±ν of a wide
spectrum ofπ±andK±originating in the target have been simulated using the programHALO[17].
This program tracks the parent particles and their decay muons inside the beam apertures and the “halo” muons leaving the apertures through the vacuum tubes, magnet yokes and shielding
surrounding the beam. Results of such calculations are given in table 3 which provide a fair
2017 JINST 12 P05025
The intrinsic divergence of the parallel beam, as tuned for the CEDAR, is obtained for the horizontal (vertical) plane by the width of the distribution of counts in the 0.2 mm-wide scintillator filament of FISC 4 (FISC 3) downstream of the CEDAR, connected in coincidence with the similar scintillator of FISC 2 (FISC 1), located 7.14 m upstream. The count distributions are plotted in figure4where the derived angular divergences are consistent with the nominal values. The profiles recorded on the pair of larger filament scintillator counters (FISC 6, 5), located near the crossing point of the beam with the reference axis at the exit of the LKr calorimeter, are shown in figure7. It should be noted that these profiles are obtained with N2(at 1.75 bar) in the CEDAR. The width
[image:17.595.146.449.257.599.2]of the beam is expected to decrease by9%in each plane, if the CEDAR is operated withH2.
Table 2. Principal parameters of the high intensity K12 beam according to design and at nominal intensity.
SPS spill length (s) / SPS cycle time (s) 0.3
Effective SPS duty cycle (s/s) ∼0.2
SPS protons per pulse of 4.8 s 3.3×10¹²
Instantaneous proton rate per effective s of spill 1.1×10¹²
Beam acceptance Horizontal ±2.7 mrad
Vertical ±1.5 mrad
mean momentum 75 GeV/c
K+momentum: Effective∆p/p 1.6%
∆p/p rms 1.0%
Divergence at CEDAR (rms) Horizontal 0.07 mrad
Vertical 0.07 mrad
Divergence at GTK (rms) Horizontal 0.11 mrad
Vertical 0.11 mrad
Beam size at GTK (rms) Horizontal ±26.4 mm
Vertical ±12.0 mm
Fiducial decay length: 60 m
∆Z = fiducial length/decay length 0.107
Decay fraction: (1−e−∆z) 0.101
p 173 MHz (23%)
K+ 45 MHz (6%)
Instantaneous beam rates π+ 525 MHz (70%)
µ+ ∼5 MHz(<1%)
Total 750 MHz (100%)
Total beam flux per pulse 2.25×10⁹
EstimatedK+decays per year 5×10¹²
4 Kaon Tagger (KTAG)
4.1 Design and construction
2017 JINST 12 P05025
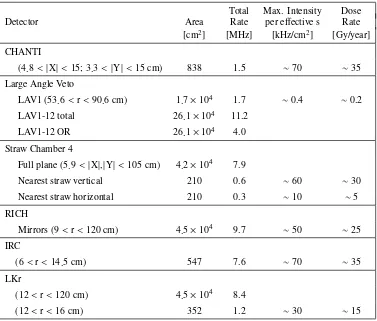
Table 3.Estimated instantaneous muon rates from pion and kaon decays that traverse the detectors at nominalbeam intensity.
Total Max. Intensity Dose
Detector Area Rate per effective s Rate
[cm2] [MHz] [kHz/cm2] [Gy/year]
CHANTI
(4.8< |X|<15;3.3<|Y|<15cm) 838 1.5 ∼70 ∼35
Large Angle Veto
LAV1 (53.6<r<90.6cm) 1.7×10⁴ 1.7
∼0.4 ∼0.2
LAV1-12 total 26.1×10⁴ 11.2
LAV1-12 OR 26.1×10⁴ 4.0
Straw Chamber 4
Full plane (5.9<|X|,|Y|<105cm) 4.2×10⁴ 7.9
Nearest straw vertical 210 0.6 ∼60 ∼30
Nearest straw horizontal 210 0.3 ∼10 ∼5
RICH
Mirrors (9<r<120cm) 4.5×10⁴ 9.7 ∼50 ∼25
IRC
(6<r<14.5cm) 547 7.6 ∼70 ∼35
LKr
(12<r<120cm) 4.5×10⁴ 8.4
(12<r<16cm) 352 1.2 ∼30 ∼15
kaons, pions and protons in unseparated charged-particle beams extracted from the CERN SPS [13].
In the NA62 configuration, the CEDAR with its gas volume of 0.94m3has been filled with
nitro-gen (N2) at 1.75 bar at room temperature. This represents, with the CEDAR windows, a total of
3.5×10−2 X0 of material in the path of the beam. Alternatively, the NA62 CEDAR can be filled
with hydrogen (H2) at 3.9 bar which reduces the material thickness to7×10−3 X0 and decreases
the beam emittance by about 9% in each plane.
The CEDAR gas volume and optics are suitable for use in NA62, but the original photodetectors and readout electronics are not capable of sustaining the nominal 45 MHz kaon rate in the NA62 beam line, nor of providing timing resolution at the required level of 100 ps. The KTAG detector, which includes new photon detection and readout systems, has been developed to meet these
requirements. Details of the CEDAR internal optics can be found in [13], while the KTAG optics
and mechanics developed for the NA62 experiment are shown in figure8.
The radiator gas is kept at room temperature, and its pressure can be varied between vacuum
and 5 bar. The CEDAR detector design requires the angular beam divergence to be below 100µrad
2017 JINST 12 P05025
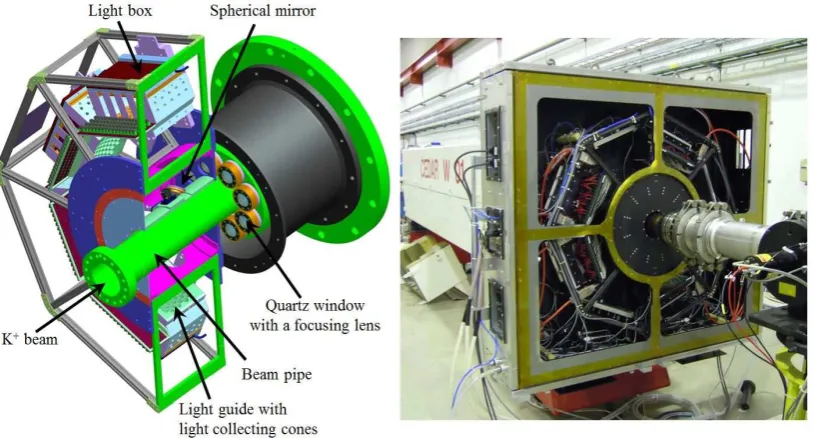
Figure 8. Left: drawing of the upstream part of the CEDAR and the KTAG. Right: KTAG and CEDAR in
the NA62 beam line during a test run in 2012, with four of the eight sectors equipped.
exit the vessel through eight quartz windows and then focused onto eight spherical mirrors. The mirrors reflect the light radially outwards into eight light boxes (referred to as sectors) located in an insulated, cooled Faraday enclosure flushed withN2gas and equipped with environmental monitors.
The entrance to each box is a light guide consisting of a matrix of 64 closely spaced conical sections of 15 mm (4 mm) outer (inner) radius cut into a 17 mm thick aluminium plate of spherical section with centre of curvature at the virtual focus of the Cherenkov light. The interior of each cone is
lined with aluminized Mylar, and 48 HamamatsuTM photomultipliers (PM, 32 of R9880 type and
16 of R7400 type) are set into the outer curved surface of each light guide, matching the cones precisely; 16 peripheral cones in each sector are not instrumented.
Differential signals from the anode and the last dynode of each photomultiplier are read into front-end boards consisting of a mother board with 64 analogue differential inputs and outputs, an embedded local monitor board (ELMB) for remote control and services, and 8 mezzanine cards
each with an 8-channel NINO ASIC [14]. The low-voltage differential signal (LVDS) outputs feed
into 128-channel TDC boards, enabling the times of leading and trailing edges of the signal to be measured, and thereby permitting slewing corrections to be implemented offline. The TDC boards are used as daughter boards for TEL62 boards, for a maximum of 512 channels readout in
each TEL62 board (section13.2). Additional splitter boards are installed between front-end and
TDC boards to equalize the data rate in each TEL62. Further details of the detector optimization, construction, mechanics, readout and electronics can be found in [18].
4.2 Performance withN2radiator gas in 2015
2017 JINST 12 P05025
Pressure [bar]
1.6 1.65 1.7 1.75 1.8 1.85 1.9 1.95 2
Normalised coincidences
-7
10
-6
10
-5
10
-4
10
-3
10
-2
10
= 5
C
N
= 6
C
N
= 7
C
N
= 8
C
N
p
K
+ [image:20.595.123.474.86.322.2]π
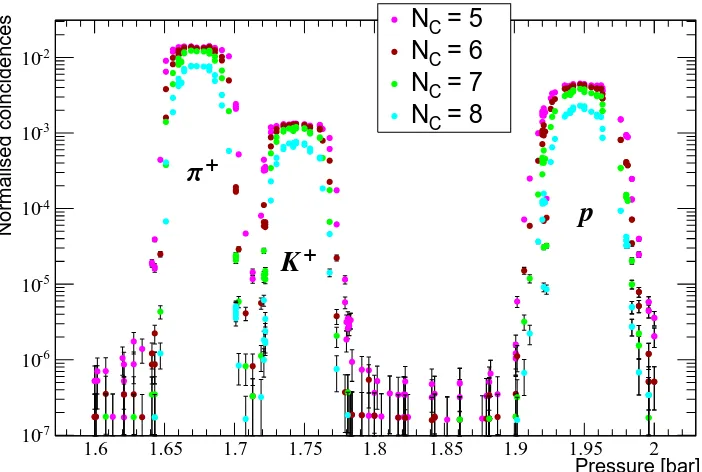
+Figure 9. Results of a CEDAR pressure scan withN2radiator gas at the nominal diaphragm aperture of
1.5 mm. For each minimum number of KTAG sectors required in coincidenceNC(ranging from 5 to 8), the
normalised number of events satisfying the requirement is plotted versus theN2 pressure. Well separated
pion, kaon and proton peaks are visible.
is reached. Following the alignment procedure, theN2 pressure is optimized to obtain maximum
light yield. The discriminatory power of the KTAG for identifying π+, K+and protons is shown
in figure9in terms of the number of coincidences of signals in the sectors plotted as a function of the N2 gas pressure. Clear separation of the π+, K+ and proton peaks is obtained by requiring a
coincidence of signals in at least 5 sectors. At the pressure of 1.75 bar optimal forK+identification, the mean number of PM signals per kaon is 20.
The KTAG time resolution for the individual PM signals is measured from the difference of hit time in a PM and the average time of all signals produced by a beam particle. With the time offset and slewing corrections implemented, the rms time resolution in a single channel is 300 ps (figure10-left). With 20 PM signals detected on average per beam kaon (with the average rate of 2.3 MHz/channel at the nominal 45 MHz kaon rate), kaon time resolution of 70 ps is achieved.
The KTAG kaon identification efficiency measured with reconstructed K+→π+π0 decays is
found to exceed 98% when requiring Cherenkov light in coincidence in at least 5 sectors (figure10 -right). For the same coincidence requirement, the probability of misidentifying a pion as a kaon while operating at the kaon pressure is estimated from the pressure scan data to beO(10−4). This estimate does not account for misidentification due to pile up, which dominates at the beam intensity of2.25×109particles per 3 s effective pulse.
Regarding the choice of the operating gas for the CEDAR, it is important to note that the W-type CEDAR was originally designed for aN2radiator, where the optics are fully corrected for
2017 JINST 12 P05025
average hit time [ns]
−
Reconstructed hit time
2
− −1.5 −1 −0.5 0 0.5 1 1.5 2 0 5000 10000 15000 20000 25000 30000
Minimum number of sectors required in coincidence
1 2 3 4 5 6 7 8
Kaon identification efficiency
0.5 0.6 0.7 0.8 0.9 1
Figure 10. KTAGperformance measured with the 2015 data at the nominal 1.5 mm diaphragm aperture
withN2 radiator in the CEDAR. Left: time resolution of a typical PM signal; a Gaussian fit to the central
peak gives a resolution of 160 ps, while the rms of the distribution, including late signals due to the elastic scattering of the photoelectron in the first dynode, is 300 ps; this leads to kaon time resolution of 70 ps. Right: kaon identification efficiency as a function of the minimum number of sectors required in coincidence.
97 98 99 100 101 102 103 104 105
200 300 400 500 600 700 0 200 400 600 800 1000 1200 1400 1600 1800 K+ π+ Radius [mm] W av elength [nm]
97 98 99 100 101 102 103 104 105
200 300 400 500 600 700 0 200 400 600 800 1000 1200 1400 1600 1800 K+ π+ Radius [mm] W av elength [nm]
Figure 11. Simulated distributions of wavelength vs radius at the CEDAR diaphragm plane for Cherenkov
photons produced by theK+andπ+beam forN2 (left) andH2(right) radiator, weighted with the quantum
efficiency [18].
the CEDAR withH2gas, where the optics do not correct the chromatic dispersion as forN2. This
causes a broadening of the Cherenkov peaks making the separation between kaons and pions more difficult (figure11). WhenH2is used the light yield is expected to be about 30% lower, depending
on the fine-tuning of the pressure and diaphragm opening. This will, in turn, decrease the detection efficiency and worsen the time resolution.
5 Beam spectrometer (GTK)
2017 JINST 12 P05025
of theK+decay region and is composed of three similar stations installed around four dipole magnets
arranged as an achromat (figure 12 ). The particle momentum can be derived from the vertical
displacement of the trajectory in the second station.
GTK1 GTK2 GTK3
13.2m 9.6m
Z X
GTK1
GTK2
GTK3
60
mm 75GeV/c
Z Y
0.4m
1.2mrad 3.6m
Figure 12. Schematic layout of the GTK stations within the achromat in the vertical and horizontal views.
As discussed in section 1.2, the GTK has been designed to measure the momentum of the
75 GeV/cbeam particles to 0.2% precision and their direction, dX/dZ and dY/dZ, at the exit of the
achromat to 16µrad precision. The high beam rate (750 MHz and up to 1.5 MHz/mm2around the
detector centre) requires a hit time resolution better than 200 ps [19]. The material budget for each of the three stations was chosen to be less than 0.5%X0, corresponding to about 500µm of silicon.
Finally, the detector has to sustain a high level of radiation. The last three requirements involved significant design efforts.
Each station (figure13) is a hybrid silicon detector consisting of 18 000 pixels of 300×300µm2 area each, arranged in a matrix of 200×90 elements corresponding to a total area of 62.8×27 mm2 (table4). The matrix is read out by application-specific integrated circuits (ASIC) arranged in two rows of five chips (figure14), with each chip serving 40×45 pixels.
Figure 13. Picture of an assembled station looking at the sensor side (left) and at the cooling side (right).
Reducing the multiple coulomb scattering has two main advantages: it improves the angular resolution and reduces the background produced by interactions in the last station, where the products are not swept away by the magnetic field.
2017 JINST 12 P05025
0 100 200 300 400
30
− −20 −10 0 10 20 30
10
−
5
−
0 5 10
X [mm]
Y
[mm]
Hit
rate
[kHz/
mm
2 ]
Figure 14. Illumination of the GTK1 station operated in the beam at about 30% of the nominal intensity.
[image:23.595.169.432.336.563.2]The grid lines correspond to the chip boundaries.
Table 4. Gigatracker detector dimensions.
Full Detector:
Full size 60.8×28.2 mm2
Active area 60.8×27 mm2
Number of pixels 18 000
Number of read-out chips 10
Read Out Chip (ROC):
Full size 12×19.5 mm2
Pixel matrix 12×13.5 mm2
Number of pixels read 1 800
Pixel size 300×300µm2
Thickness:
Sensor 200µm
Read-out chips 100µm
Cooling plate 210µm
Total thickness in active area 510µm
Finally, the expected radiation level damages the silicon structure in the sensor introducing defects that trap charges reducing the signal yield and consequently degrading the time resolution. The effect of the radiation damage can be mitigated by a combination of cooling the detectors, increasing the bias voltage, and replacing the damaged assemblies.
5.1 Design and construction
The sensors have been made from 200 µm thick wafers of≥3 kΩcm resistivity silicon. The most
2017 JINST 12 P05025
noise, which is 0.04 fC. Read-out chips (ROC) were thinned to 100µm before bonding them to the
sensors with 10–15µm high SnAg bumps. A planar matrix of p-in-n pixel diodes has been chosen
as the base configuration, although the front-end amplifier is bi-polar and n-in-p structures can also be handled.
The detectors are located in a harsh radiation environment. At nominal beam intensity the detectors are exposed to a fluence corresponding to4×1014one-MeV neutron equivalent cm−2in one year (200 days) of data taking. In order to minimize ageing effects due to radiation damage, the detectors are operated at approximately−15◦C. It is expected that they can be operated continuously for more than 100 days without any significant performance degradation [20] under these conditions. The detector mechanics has been designed such that detectors can be replaced rapidly, for example, during one of the regular short accelerator stops.
The detector achieves a single hit time resolution better than 200 ps if the sensor is operated in an over-depleted regime with a bias voltage of 300 V or higher [21]. To operate the sensor at this high bias voltage, a multi-guard ring structure was implemented to establish a gradual voltage drop between backside potential and the sensitive region.
The ASIC, called TDCPix, has been designed in 130 nm CMOS technology. The time-over-threshold (ToT) is measured, allowing for an efficient correction for the time-walk. To satisfy the stringent requests concerning time resolution, the amplifier, with peaking time of 5 ns, and the ToT discriminator were both located within the300×300µm2pixel area. Furthermore, the pixel area includes a 5-bit DAC to trim the discriminator threshold and a configuration register [22]. The signals are then transmitted to the end-of-column (EoC) region for the time measurement.
For each signal associated to a beam-particle crossing the sensor, the times of the rising and trailing edges are measured with a delay-locked-loop based (DLL) TDC. The clock frequency of 320.632 MHz, derived from the NA62 main clock frequency, is divided into a 5-bit fine-time corresponding to a TDC time bin of 97 ps. To limit the number of DLLs and TDCs, a pair of columns shares the same DLL and five pixels share the same TDC, resulting in 20 DLLs per chip and 9 two-channel TDCs per column. In the EoC region, a hit-arbiter maximizes the throughput whenever two or more pixels sharing the same TDC are hit. The hits are stored in a FIFO ready to be transmitted to the offline read-out.
The expected maximum hit rate in a chip exceeds 108 particles/s. Considering the hit word
size of 48 bits, the total bit-load to be transmitted is estimated to be close to 6 Gbit/s. The chip is split in quarters (10 columns), each served by a 3.2 Gbit/s serial transmitter.
The radiation environment can affect the chip function by inducing single event upsets (SEU). To mitigate the problems due to bit-flip the logic was triplicated and a majority decision is taken.
The dissipated power is not uniform over the detector, being approximately 0.4 W/cm2 in the
sensitive area and 3.2 W/cm2in the whole EoC region (7.2 cm2), where most of the digital functions are located; hence both areas require active cooling [23]. In this context, the aim of the cooling is twofold: a) removing swiftly the heat produced by the ASIC electronics and transferring it outside the vacuum pipe and b) keeping the sensor at a stable low temperature. The low temperature helps to mitigate the loss in gain caused by radiation damage.
The design chosen is quite challenging: a cooled liquid (single phase C6F14) flows through
2017 JINST 12 P05025
bonding a flat silicon wafer, 70µm thick, to the channel wafer. The channels have a cross section of
200×70µm2and they are separated by 200µm walls. To limit the pressure drop necessary to flow the liquid, the micro-channels are split into two groups with independent inlet and outlet tubes. The plate is then glued with double-face adhesive tape to the back-side of the read-out chip [24]. The sketch in figure15represents the cooling concept: the heat developed by the TDCPix is efficiently removed by the cooling plate, which is kept at low temperature by the liquid. Consequently, the temperature of the silicon sensor is linked to that of the read-out chip.
Sensor
TDCPix TDCPix
Wire Bonds
PCB PCB
Cooling Plate
Figure 15. Sketch of the detector after assembly. The different components from top to bottom are: sensor,
TDCPix and cooling plate.
The cooling fluid is supplied by a cooling plant common to the three GTK stations. The liquid is cooled by an externally controlled chiller and the circulation is forced through the micro-channels at a pressure close to 3 bar with a flow of 2 g/s/station. The temperature at the chiller output can be controlled over the range−25to 0◦C. In case of vacuum failure or overheating, adequate interlocks protect the system from damage.
5.2 Performance in 2015
During the 2015 beam period, the three stations were installed and equipped with detectors, and all the infrastructure including vacuum, mechanics, cooling, and data acquisition, were in place
and operational. GTK data, synchronized to the NA62 L0 trigger (section13.3), were collected
and the detector was partially commissioned. The detectors were operated at 0◦C temperature
by circulating C6F14 at 2 g/s, which allowed a pressure drop of around 3.2 bar across the cooling
plates. Pixel-signal thresholds were adjusted and pixel-to-pixel thresholds equalized with a test-bench procedure performed before installation. The thresholds were set to 0.7 fC, corresponding to 30% of the most probable charge of a minimum ionizing particle. During the data taking, the bias voltages were set and scanned in the range between 200 and 300 V. All the GTK read-out cards were installed, the optical-fibre communication to the TDCPix was established and the data read-out was proven to be fully functional and reliable.
The first operation of the GTK system confirmed that the mechanics, the cooling and electronics were properly working, although further calibration and data analysis are needed to exploit the full potential of the detector.
2017 JINST 12 P05025
0 2 4 6 8 10 12 14 16 18 20
10 − 8 − 6 − 4 − 2 − 0 2 4 6 8 10 1 10 2 10 3 10
ToT [ns]
tGTK
−
tKT
A
G
[ns]
Figure 16. Time-walk as a function of time-over-threshold (ToT). The line corresponds to the result of a
quadratic fit of the most probable value of the time-walk.
3
− −2 −1 0 1 2 3
0 100 200 300 400 500 600 Single pixel
σpixel= 149 ps
thit−tKTAG[ns]
count
/
50
ps
3
− −2 −1 0 1 2 3
0 0.02 0.04 0.06 0.08 0.1 0.12 0.14 0.16 0.18 0.2 6 10 × GTK1
σGTK= 225 ps
thit−tKTAG[ns]
count
/
50
ps
Figure 17. Time resolution of a single pixel (left) and GTK1 station (right) operated at a bias voltage of
300 V. The quoted resolution is obtained subtracting the KTAG 70 ps contribution.
of the signal. Figure16 shows the time-walk as a function of the ToT. The corrected hit-time is
obtained from the raw time and the fitted time-walk correction as a function of the ToT value. The time resolution is obtained by comparing the corrected hit time to the KTAG time, which has a resolution of 70 ps. When selecting a sample of hits from a single pixel the time resolution, after unfolding the KTAG contribution, is found to be 150 ps (figure17-left). This value confirms
the results obtained with the prototype detector when operated at a similar bias voltage [21].
Resolutions 75 ps larger are obtained when all the pixels of a station are included in the sample (figure17-right). This increase may be due to remaining systematic uncertainties in the GTK time offsets.
2017 JINST 12 P05025
The impact of the GTK performance on the kinematic reconstruction is quantified by the improved width (rms) of them2missdistribution (eq. (1.1)) as a function of the pion momentum for a
selected sample ofK+→π+π0decays, wherePK is measured with the GTK spectrometer andP
π is measured with the STRAW spectrometer. Including precise GTK information instead of nominal beam values decreases the width of the distribution, as can be seen in figure75 (section15), in agreement with the value expected from the GTK specifications (section1.2).
6 Charged anti-coincidence detector (CHANTI)
The CHANTI detector provides rejection for background from inelastic interactions of the beam with the most downstream GTK station, GTK3. Particles resulting from these interactions can enter the acceptance of the detector, creating background for K+→π+νν¯ events. The inelastic interactions on GTK3 are not, however, the only source of activity in the CHANTI, which detects also the muon halo close to the beam and a fraction of the charged particles generated upstream
of GTK3. The CHANTI is composed of six square hodoscope stations 300×300 mm2 in cross
section with a 95×65 mm2hole in the centre to leave room for the beam (figure18-left). The first station is placed 28 mm downstream of GTK3, and the distance between each station and the next one approximately doubles for successive stations, so that the angular region between 49 mrad and 1.34 rad is covered hermetically for particles generated on GTK3. GTK3 and all CHANTI stations
are located inside the same vacuum vessel. Figure 18-right shows a picture of the open vacuum
vessel during installation. The stations are made of scintillator bars of triangular cross section read out with fast wavelength-shifting (WLS) fibres coupled to silicon photomultipliers (SiPMs).
Each station has two readout planes, with the bars oriented vertically and horizontally to form X and Y views. For each view, the triangular bars are arranged into a plane as shown in figure19-left; particles incident from the front of the detector generally traverse two bars. Each of the six stations consists of 48 bars, adding to a total of 288 bars. A more detailed description of the CHANTI detector may be found in [25].
6.1 Design and construction
The CHANTI polystyrene-based scintillator bars were extruded complete with the hole for the
WLS fibre and a thin, co-extruded layer of TiO2, which provides diffuse reflectivity along the
lateral surfaces.
To construct the CHANTI stations, the scintillator bars were first cut to three different lengths: 30 cm, 11.75 cm, and 10.25 cm. One side of each bar was then machined to create the seat for the connector that couples the fibres to the SiPM. Bicron BCF-92, multi-cladded, 1 mm diameter WLS fibres were used for light readout; the fibres were mirrored at the end opposite to the SiPM by Al sputtering under vacuum, cut to the desired length, and glued to the connectors. The free space between the fibre and the scintillator was filled with an optically transparent silicone-elastomer glue. A low outgassing structural glue was used to fix the connector to the scintillator.
2017 JINST 12 P05025
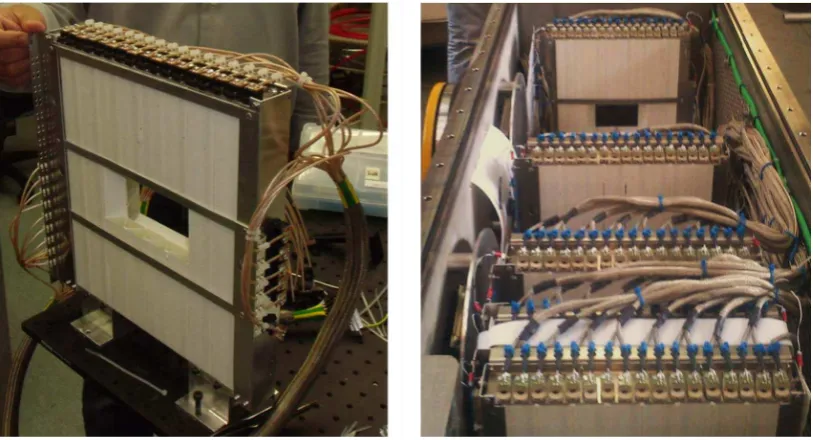
Figure 18. Left: a CHANTI station. Right: upstream part of the CHANTI vacuum vessel, equipped with
[image:28.595.95.502.83.303.2]the first five stations. The photograph was taken during the assembly.
Figure 19. Left: arrangement of the bars to form a plane. Right: a triangular bar, constituting the building block of the CHANTI detector. The WLS fibre is visible in the centre.
bars forming a plane releases about 70 photoelectrons (pe) shared among the two bars (figure19 -left); the detector can thus be operated with thresholds of 5–6 pe per channel with negligible efficiency losses.
The SiPMs (Hamamatsu MPPC-S10362-13-050-C) have an active area of 1.3 × 1.3 mm2
and a pixel size of 50× 50 µm2, with a total of 667 pixels. The current-voltage curve for each SiPM was measured at fixed temperature in a climate-controlled chamber to obtain the breakdown voltageVbdat a working temperature of 25◦C (Vbdis typically 70 V). To determine the temperature
dependence ofVbd, the test was repeated at different temperatures over the range 5–35◦C for 25%
of the SiPMs. Good agreement was obtained with the value for the temperature coefficient quoted by Hamamatsu (50 mV/K). The typical dark count rate at 25◦C for a threshold of 0.5 pe was found to be approximately 800 kHz, again in agreement with manufacturer specifications.
The materials used to construct the CHANTI stations were chosen to be compatible with
operation in vacuum. The outgassing rate was measured to be less than 3×10⁻⁵ mbar litre per
2017 JINST 12 P05025
of two rectangular stainless-steel chambers connected by a tube to form a single, 2165 mm long vacuum volume. Each chamber is equipped with flanges and 16-channel, D-sub 37-pin feedthrough connectors for signal and high-voltage.
6.2 Front-end electronics
The SiPMs require a reverse bias voltage of about 70 V and produce fast signals with rise times below 1 ns, amplitudes of fewµV/pe on 50Ωload and gains of about7×105. The bias-voltage stability, however, must be kept under control at the per mille level for satisfactory gain stability. Moreover, since the typical signal is relatively small, it must be amplified before it can be discriminated and/or digitized. Therefore, a custom, all-in-one front-end board (CHANTI-FE) was designed and is used for CHANTI.
The signals from each of the six stations are grouped on three vacuum feedthrough connectors and input to nine custom-designed, VME 9U CHANTI-FE boards. Each CHANTI-FE board can accept up to 32 channels. For each channel, the board sets the SiPM bias voltage, monitors the bias-voltage current, and amplifies the signal. Each board can also monitor up to four PT100 temperature probes placed on the detector; this allows the bias voltage to be adjusted to maintain constant SiPM gain in response to temperature variations. Other important characteristics of the CHANTI-FE board include
• bias-voltage setting with 10 mV precision, stable with temperature and time;
• current readout with nA precision in the range0–2500nA;
• fast amplification by a factor of 25 of the analogue signal on a 50Ωload;
• adjustable settings and thresholds via CANOpen standard communication.
The analogue outputs from the CHANTI-FE boards are converted to LVDS signals by a
LAV-FE board (section 8.1.3) modified to handle the dynamic range of the CHANTI signals. The
boards generate an output signal equal in duration to the time during which the input signal is above threshold (time-over-threshold, ToT). Each input channel is compared to two programmable thresholds (high and low), so that the 32 physical input channels are mapped to 64 logical output channels. The LVDS signals are digitized into leading and trailing edge times by the standard
TDCB+TEL62 readout system (section13).
The thresholds are calibrated for each electronic channel as described in [25]. This procedure enables the threshold to be set at the desired number of photoelectrons for each channel.
6.3 Performance in 2015
The CHANTI was installed and commissioned in 2014 and fully exploited during the 2014 and 2015 data taking periods. The efficiency and spatial resolution were measured using muon runs (section2.2), which provide a clean sample of straight and penetrating minimum ionizing particles (MIPs). At a threshold of about 50 mV, the efficiencies for all views of all stations were measured
to be uniform and above 99% (figure 20-left), in good agreement with prior laboratory tests on
2017 JINST 12 P05025
Xor Y [mm]
Efficiency σCHANTI= 830 ps
tCHANTI−tKTAG[ns]
Figure 20. Left: measured detection efficiency in a CHANTI station for a sample of muons. Black full
(red open) dots refer to X (Y) view, respectively. Right: difference between the CHANTI candidate time (after corrections for channel-by-channel time offsets and slewing) and the time measured in the KTAG. The quoted resolution is obtained after subtraction of the KTAG 70 ps contribution.
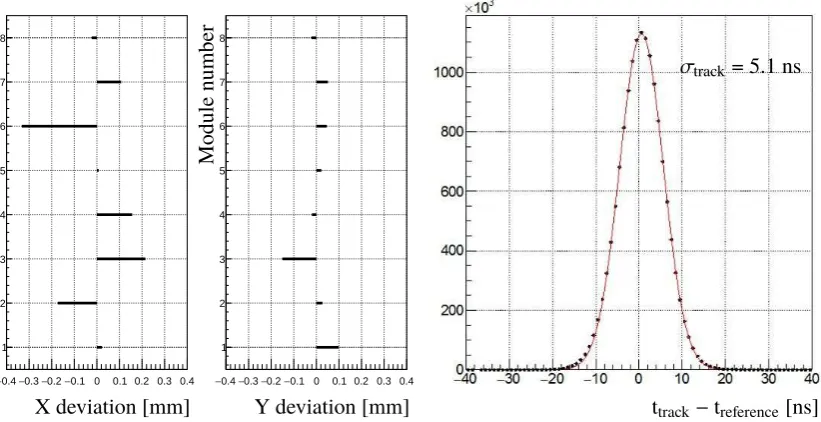
Given the geometry of the detector, a straight MIP normally incident on a station shares its energy release between two adjacent bars in a way inversely proportional to the impact parameter of the track with respect to the bar centres. The position of a hit in a station is determined from the hit positions in each bar weighted by the energy release in each. The charge in each bar is not measured directly, but is evaluated as a function of the ToT. The resolution is found to be about 2.5 mm, which is better by nearly a factor of two than the intrinsic resolution from the pitch of the
fibres (16.5 mm/√12). The relative alignment of the six CHANTI stations was checked with muon
halo tracks; the deviations from the nominal positions were measured to be below 0.5 mm, which matches the design specifications.
The LAV-FE boards provide two digital outputs for each channel, which correspond to two different programmable threshold levels. This feature allows corrections for slewing to be calculated by linear extrapolation when both thresholds are crossed. An average slewing correction calculated from the ToT is used when only the lower threshold is crossed; the slewing correction dependence on the low threshold ToT is shown in figure21.
After slewing corrections, the typical single hit time resolution in the CHANTI is found to be 1.14 ns. A CHANTI signal is usually made of more than one hit (typically two hits per view) that are close in space and time. The time resolution for CHANTI signals with respect to the reference time from the KTAG is found to be about 830 ps after subtraction of the 70 ps KTAG contribution. The distribution of the time difference between the CHANTI candidate and the KTAG candidate closest in time is shown in figure20-right. The overall rate on the CHANTI, when requiring at least one hit in both X and Y views, is expected to be about 7.2 MHz at nominal beam intensity with the kaon inelastic interactions contributing only 11% of the total rate. The measured time resolution is therefore adequate to keep the random veto probability to an acceptable level of a few percent. A detailed study of the CHANTI random veto probability has been performed on a sample of 2015 data recorded at 40% nominal beam intensity [26]. It has shown that, if a 6 ns wide time window is used to veto events, about 1.8% of genuineK+decays with one track in the final state are vetoed.
2017 JINST 12 P05025
ToT [ns]
Sle
wing
cor
rection
[ns]
Figure 21. Slewing correction, evaluated for signal with both thresholds crossed, as a function of low
threshold time-over-threshold (ToT). The line corresponds to the average correction parameterization.
back to the GTK3 region in the XY plane, which enables the selection of a sample of inelastic-interaction events that are useful for background studies.
7 Straw spectrometer (STRAW)
One of the major challenges of the NA62 experiment is to reduce the background from the most abundant kaon decays and accidental tracks (section1). The required kinematic rejection depends critically on precision low-mass systems that track the incoming kaon and the final state particles. The straw spectrometer measures the trajectories and the momenta of the charged particles produced in the kaon decay. It extends over a length of 35 m along the beam line, starting∼20 m after the decay region. It consists of four straw chambers and a large aperture dipole magnet (MNP33) providing an integrated field of 0.9 Tm (figure2). To minimize multiple scattering the chambers are built of light material and are installed inside the vacuum tank. The total amount of material in the spectrometer corresponds to 1.8%X0.
7.1 Design and construction
The module design is optimized to minimize multiple scattering and to give uniform space resolution over the full active area. Each straw chamber is composed of two modules. One module contains two views measuring X (0◦), Y (90◦) and the other module contains the U (−45◦) and V (+45◦)