Abstract: Study and analysis of forest cover is a crucial area of research due to the increasing effects of global warming. Scientists have devised various algorithms which not only analyze but help in predicting the forest cover for a particular area based on the parameters extracted from that area. In this paper, we propose a forest cover prediction algorithm which is based on Artificial Neural networks & Fuzzy Inference System (ANFIS), which uses the image analysis data for prediction. The work shows that the prediction accuracy of our proposed ANFIS system is superior to that of the standard neural networks. The datasets used are taken from standard GIS websites in order to evaluate the prediction and validate the same.
Index Terms: ANFIS, Forest cover, fuzzy, neural, prediction.
I. INTRODUCTION
The prediction of forest cover is a complicated process, in order to perform accurate and precise prediction of forest cover, the following steps must be followed:
A. Collection of data samples
Proper collection of the input data is of utmost importance for any prediction system. Usually for forest cover prediction, this data is in the form of time tagged images, which needs further processing in order to evaluate the information hidden inside the image. For example, the images might contain a satellite view of a particular area for a given span of time. This data is usually in a very raw format, and thus is not useful as it is, but the accuracy with which this data is collected, reflects the efficiency of the developed prediction system. Various web resources are available for obtaining the satellite imagery data for forest cover. For example,
Natural Earth - Vector: Includes coastline, land, oceans, islands, rivers, lakes, glaciated areas and bathymetry. Available at multiple levels of detail. A version of this data is also available in the Wagner VII projection, which has good equal area properties.
Natural Earth - Raster: Includes various raster images, intended for use as backgrounds for other data, for example hypsometric tints, satellite derived land cover, shaded relief etc.
Global Map: A set of consistent GIS layers covering the whole globe at 1km resolution including: transportation,
Revised Manuscript Received on May 24, 2019.
Sony Ahuja, Computer Science and Engineering Dept, Shri Ramdeobaba College of Engineering and Management, Nagpur, India
Prof.Aarti Karandikar, Computer Science and Engineering Dept, Shri Ramdeobaba College of Engineering and Management, Nagpur, India
elevation, drainage, vegetation, administrative boundaries, land cover, land use and population centres. Produced by the International Steering Committee on Global Mapping. DIVA-GIS Country Data: A collection of data collected from a number of the sources below - includes administrative areas, inland water, roads and railways, elevation, land cover, population and climate. Probably the easiest place to get a simple set of data for a specific country.
UNEP GEOdata: A wide range of data from the United Nations Environment Programme including Global Forest Cover, Global Potential Evapotranspiration, Global Average Monthly Temperatures, Dams, Watershed Boundaries and much more.
Koordinates: GIS data aggregation site including data in a number of categories such as elevation, environment, climate etc. Some global datasets, some based on continents, some for specific countries. Mostly vector, but some raster. MapCruzin: GIS aggregation site including wide range of data for various areas of the world. Some datasets appears to be of low quality, but others are good.
GeoNetwork: GIS aggregation site including a wide range of data under various categories (both human and physical). European Environment Agency: Maps and datasets from the European Environment Agency, covering a huge range of physical geography and environmental topics. Europe only.
B. Processing of data samples to gather information
Once the raw data has been collected it has to be converted into information which can be used for further processing. For doing this, the researcher needs to apply advanced signal processing methods on the data. For example, in the case of forest cover analysis, the researchers are needed to pre-process the obtained imagery, so that any noise is removed from the images. The denoised images are then given to a image segmentation unit, which segments the required forest regions from the image, and produces an estimate of how much percentage of forest cover is present in the input image. This percentage is the information which is required by the prediction algorithm for training and evaluation purposes. Segmentation algorithms like thresholding, saliency maps, fuzzy C means, etc. can be used for this purpose.
C. Representation of the obtained information
The obtained information (percentage of forest cover in this case) has to be properly represented so that
Improving the Efficiency of Forest Cover
Forecasting using ANFIS
the final prediction is sensical and accurate. Misrepresentation of this
data creates ambiguity in the training process, which finally results in improper predictions. For example, if we need to predict the forest cover of a particular area for every January month, then the information representation unit must arrange the obtained percentages of previous year's January months in sequential order, so that the prediction layer can analyze the trends of the January month every year and produce a rich set of predictions. Similar case can be described for monthly prediction. There are no standard algorithms which can perform this task, this has to be done by the researcher's application needs and requirements of system design.
D. Trend analysis of the represented data for prediction
Analysis of trends from the properly represented data is done with the help of standard algorithms like auto regression neural networks, fuzzy inference systems, machine learning techniques and others. Out of these techniques the neural networks are considered to be the defacto standard for trend analysis, and are generally used by researchers for applications like market prediction, oil prediction and other areas. Forest cover prediction can also be performed by neural networks, but in our study we found that ANFIS is a better choice as compared to neural networks due to the rule based approach applied by the former. We will describe this in details in the proposed work section of this paper. The next section describes various techniques used by researchers for forest cover prediction, followed by the proposed technique and later by the result analysis and conclusions. We conclude the paper with some observations about our research and suggest some future ways via which forest cover prediction can be improved.
II. LITERATUREREVIEW
Assurance of tree development is most normally acquired by methods for rehashed estimations toward the start and end of a predetermined period, when the distinction rises to the development (Husch et al., 1982; Uzoh and Oliver, 2006). Better tree estimations are required when the intrigue is in development after some time instead of size at a specific minute. Evaluations of stature augmentation are normally acceptable if the tallness is estimated utilizing stature sticks, however might be inadmissible whenever estimated utilizing a hypsometer (Husch et al., 1982). Evaluations of width addition are substantially more solid, especially if the purpose of estimation on stems is checked for all time. Past development in measurement can be gotten from addition borings or cross-area cuts (Poage and Tappeiner, 2002). Past tallness addition can be controlled by stem investigation (Uzoh and Oliver, 2006). In species for which the internodal lengths on the stem demonstrate a year's development, past stature development can be controlled by estimating the
internodal lengths (Husch et al., 1982). In key, just past development can be estimated in these ways, however it is future development that is ordinarily of intrigue and this must be anticipated utilizing a development display (Hynynen, 1995; Hökkä and Groot, 1999; Hall and Bailey, 2001; Matala, 2005). The precision of field estimations is typically high. Päivinen et al. (1992) announced that 5-year tallness addition of Scots pine and Norway spruce was estimated with a standard deviation of 27 cm and 20.5% in the gauge of volume increase for a 65-year-old Scots pine stand. Change identification utilizing remote detecting systems typically includes two techniques: change extraction (change discovery calculation) and change partition/marking (change characterization) (Coppin et al., 2004). An assortment of programmed strategies have been created (Hudak and Wessman, 1998; Hyppänen, 1999; Bruzzone and Prieto, 2002; Saksa et al., 2003; Lu et al., 2004; Im and Jensen, 2005; Miller et al., 2005). They can be gathered extensively into two classes: synchronous examination of multi-worldly information, and relative investigation of freely created groupings as indicated by Singh (1989). The two methodologies can be connected on a pixel-to-pixel premise or on an article situated premise. In the previous strategy, the multi-transient information is broke down at the same time utilizing techniques, for example, multi-date order, picture differencing, or chief segment investigation. In the last strategy, the groupings of pictures for various dates are thought about and changes in land spread are distinguished. A survey of progress identification strategies utilizing remote detecting information can be found in Singh (1989), Lu et al. (2004) and Coppin et al. (2004). As a rule, change recognition includes the investigation of at least two remote detecting pictures (multi-transient information) procured over the equivalent land territory at various occasions. To consider the examination between the arrangement of information at a similar area, a geometric rectification ought to be embraced to enroll the information to genuine directions or to one another. For optical multi-transient information, radiometric remedy is likewise required to expel the impact of for example seeing geometry and barometrical conditions on picture radiances (Holopainen and Jauhiainen, 1999). Optical remote detecting symbolism has been the predominant information hotspot for change discovery, so most techniques have been produced for optical pictures. On a basic level, the method intended for optical otherworldly information can be connected to the examination of radar symbolism and ALS information. Be that as it may, there are contrasts in the information qualities, prompting contrasts in the treatment of radar and ALS information.
Dull acquisitions of aeronautical photos have been utilized for woodland change recognition (Holopainen and Jauhiainen, 1999; Kadmon and Harari-Kremer, 1999; Fensham and Fairfax, 2002; Saksa et al., 2003; Hyvönen and Anttila, 2006; Jauhiainen et
al., 2007). Kadmon and
Harari-Kremer (1999)
photos of an uneven scene overwhelmed by Mediterranean maquis in northern Israel over a time of 32 years so as to think about scene scale, long haul vegetation spread changes. Their change location strategy contained pixel-level order, the outcomes being arrived at the midpoint of to bigger cells and the cell esteems differenced. Saksa et al. (2003) showed the relevance of high-elevation airborne photos for distinguishing the obvious zones in boreal backwoods. Their change identification depended on picture differencing performed at various dimensions and the outcomes demonstrated that the techniques and information were sufficiently exact for operational discovery of obvious regions. In Hyvönen and Anttila (2006), a self-loader technique dependent on bi-transient elevated photos taken in 2001 and 2004 was created to identify the progressions brought about by activities and woodland harm. Stepwise segregate examination was utilized for change arrangement dependent on 110 highlights separated at stand level. The general precision of arrangement fluctuated somewhere in the range of 75.3% and 84.7% and the best exactness was gotten by utilizing histogram and surface highlights. A survey of aeronautical photo utilized for evaluating vegetation change was distributed by Fensham and Fairfax (2002). Ethereal photography has certain favorable circumstances over other optical remote detecting strategies for long haul change recognition, for example it permits 3D estimations for the precise estimation of tree and covering, and information arrangement can traverse 60-70 years (Fujita et al., 2003; Korpela and Tokola, 2006; Korpela, 2006) despite the fact that the investigations were regularly completed in 2D utilizing monoscopic mode. With 3D estimations, a progression of advanced surface models (DSM) of timberland overhang can be made and can be utilized to decide inconspicuous changes, for example, tree development as a component of time (St-Onge et al., 2004), accepting that they have been appropriately adjusted. At the point when time-arrangement information are accessible, the adjustment in the woodland can be identified utilizing different change location strategies (for example Ahern, 1991; Coops and Waring, 2001; Donoghue et al., 2004). The upside of the day by day accessibility and ease of NOAA/AVHRR has made it a priceless hotspot for expansive region change location. For instance, NOAA/AVHRR have been utilized to screen vegetation transient changes (Batista et al., 1997) and to recognize timberland fires (Cuomo et al., 2001). Coppin and Bauer (1994) displayed computerized methodology for advancing the data substance of multitemporal Landsat TM informational collections for woodland spread change recognition. Their outcomes demonstrate that the connection between intelligent TM information and timberland shelter change is sufficiently unequivocal to be of operational use in a woods spread change stratification stage, preceding progressively itemized evaluation. Wilson and Sader (2002) built up a straightforward and moderately exact procedure for characterizing time-arrangement Landsat TM symbolism to identify dimensions of woods reap. Whiffen et al. (2000) utilized Landsat TM information from both leaf-on and
leafoff timespans to foresee the variety in basal zone over southeast United States of develop loblolly pine stands and found that the spatial goals of the Landsat TM's sensors was inadequate to precisely recognize varieties in basal region information at the 30 meter plot scale.
SAR has been less misused than optical sensors with regards to change location due to the natural intricacy of SAR information (Bazi et al., 2005; Bovolo and Bruzzone, 2005). In spite of this, the utilization of SAR in change discovery is conceivably alluring from the training perspective as they are free of environmental and daylight conditions. Balzter et al. (2003) utilized rehashed SAR perceptions (L-band) from SEASAT and JERS-1 to gauge the steady tree development of Corsican pine remains more than 19 years. Two techniques were created in their investigation to relate the adjustments in the backscatter coefficient to the development; one was to infer development by assessing top range from SAR pictures and taking the tallness distinction, and the other was to appraise tree development from fleeting backscatter change specifically by utilizing an experimental model. A RMSE of 8.2 m was acquired for tree development by the primary strategy and 3.4 m continuously, utilizing a straight model.
Change discovery utilizing ALS has not been concentrated widely before the present proposal. Today, the procedures utilized for recognizing change in backwoods and urban regions can be gathered as investigation dependent on shade tallness appropriation (Næsset and Gobakken, 2005), object distinguishing proof (Vögtle and Steinle, 2003; St-Onge and Vepakomma, 2004), and picture differencing (Murakami et al., 1999; Steinle and Bähr, 2002; Thuy et al., 2004). The progressions recognized are gathered trees, woods hole elements, urban/building change and tallness and volume development.
III. PROPOSEDANFISPREDICTIONENGINE
[image:4.595.50.269.161.289.2]The proposed ANFIS based prediction engine can be summarized with the help of the following figure, which showcases all the blocks which have been used for the process of forest cover prediction using the GIS datasets collected from various standard sources.
Figure 1. Proposed ANFIS based prediction system
[image:4.595.376.478.229.526.2]The input imagery dataset is collected from standard online GIS satellite imaging data stores, and given to the system. The coordinates of the area under consideration are:
Table I. Coordinates of 3 areas
The dataset is collected for the years starting from 2005 to 2018, and for the months of January, February, March, October, November and December. This selection is done based on the fact that the greenery of a given area is usually depicted in its true form in the months of pre-summers and winters, while in rainy seasons there are cloud covers, while in summers the trees shed their colors in order to sustain the heat. Thus, these 6 months were chosen for analysis and prediction of forest cover. Once the images are collected, then they are given to the RGB based thresholding unit, in this unit, the ratio of green to red GR and green to blue GB are evaluated. Then based on a decided threshold value, if the GB and GR ratios of any pixel are less than threshold, then it means that the pixel has low component of green in it, and thus is removed from the image, the remaining pixels are segmented out, and represent the forest cover in the given area. The numbers of pixels segmented are counted, and a ratio mentioned in equation 1 is evaluated,
(1)
where, FC is the forest cover
Nps is the number of pixels segmented Tnp is the total number of pixels
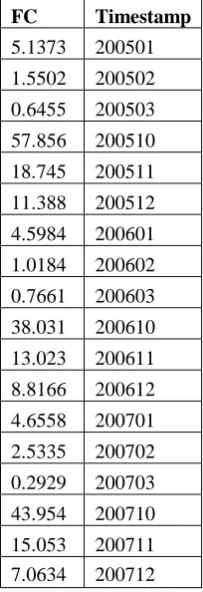
The value of FC is evaluated for all images, and stored in comma separated value format with the timestamp for that particular image, so that the data can be further processed for prediction.
The custom time stamp is developed for this work, where in the first 4 digits are the year, and the later 2 digits are the month number of the year. From the given dataset, we evaluate an ANFIS prediction engine in order to find the forest cover for the given area.
[image:4.595.45.270.392.463.2]An example of the numerical dataset can be shown as follows:
Table II. Forest cover with the time stamp
FC Timestamp
5.1373 200501
1.5502 200502
0.6455 200503
57.856 200510
18.745 200511
11.388 200512
4.5984 200601
1.0184 200602
0.7661 200603
38.031 200610
13.023 200611
8.8166 200612
4.6558 200701
2.5335 200702
0.2929 200703
43.954 200710
15.053 200711
7.0634 200712
A fuzzy framework dependent on the legitimate guidelines of premises and ends can't be broke down with customary likelihood hypotheses. Creating fuzzy "if then" rules is the beginning stage in building a fuzzy framework. A powerful device for this reason for existing is a technique that can change over information to the required fuzzy guidelines. Then again, counterfeit neural systems are equipped for creating fitting relations among information and yield factors through learning capacities dependent on various preparing designs. A consolidated arrangement of fake neural systems and fuzzy surmising achieved with utilizing numerical information to anticipate yield can produce a compelling device, versatile neuro-fuzzy deduction framework (ANFIS). It is an AI system as of now utilizing in hydrological forms (Bisht and Jangid, 2011). ANFIS is right off the bat presented by Jang (1993) and it depends on the principal request Sugeno fuzzy model.
square estimation for forecast of enrollment work parameter (Jang, Sun, and Mizutani, 1997). The most huge reason for coordinating neural systems with fuzzy frameworks is to practice learning capacity of neural system while the learning ability is an advantage regarding fuzzy framework; then again, there are more advantages for a consolidated framework from the part of a neural system. Takagi-Sugeno type fuzzy induction framework is utilized in ANFIS where each standard's yield can be a steady term or can be a direct blend of info factors expansion to a consistent term. The weighted normal of each
standard's yield is the last yield. The essential engineering of ANFIS which has two data sources (x, y) and one yield (z) is exhibited in Figure 2. The standard base of ANFIS contains two TakagiSugeno type on the off chance that rules as given beneath:
Standard 1: If x is A1 and y is B1; at that point yield is C1 Standard 2: If x is A2 and y is B2; at that point yield is C2 where A1, A2, B1 and B2 are nonlinear parameters while C1 and C2 are straight yields.
[image:5.595.55.270.419.539.2]Layer 1 is the fuzzification layer in which x is the contribution of A1 and B1 hubs and y is the contribution of A2 and B2 hubs. A1, A2, B1 and B2 are utilized in the fuzzy hypothesis for allotting the enrollment capacities as etymological marks. The enrollment connection between the info and yield elements of this layer can be appeared as pursues:
Figure 2. ANFIS structure
Layer 2 is the item layer which incorporates two fixed hubs named with N. The yields of this layer are w1 and w2. These yields are the weight elements of layer 3. Layer 3 is the standardized layer, which incorporates two fixed hubs marked with N. w1 and w2 are the yields of this layer. Normalizing the weight work is the errand of this layer in the following procedure. Layer 4 is the defuzzification layer which incorporates two versatile hubs. Layer 5 is the yield layer which incorporates a fixed hub marked with ∑. The yield of this layer is included all the information segments, which means the cleaning rates results. Matlab programming was utilized to lead the information calculation for ANFIS. ANFIS preparing incorporates the slope plunge technique and the least squares strategy. ANFIS preparing calculations inserted in the Matlab fuzzy deduction tool stash streamline information handling utilizing the preparation and estimating capacities. Principle calculation process comprises of four phases. Information input is the principal
arrange. Doling out fuzzy sets is the second stage. Some fuzzy sets ought to be allocated to each kind of info and yield information for the information input. The framework will naturally decide the participation capacities for them steady with scope of information and the fuzzy sets during the time spent information preparing. Utilizing the preparation work for learning of info information is the third step. ANFIS will gain proficiency with the information by playing out the preparation information capacity and gather preparing mistakes after the examination. The last stage is expectation of the yield. Dataset was arbitrarily isolated into two a balance of as preparing and test information. Sub-bunching dividing procedure with Gaussian participation capacities was utilized for creating FIS to fuzzify the info information. The preparation organize contained an iterative strategy which focused to compute ideal qualities by limiting the whole of squared contrasts between preparing information esteems and model forecasts. Half breed learning calculation was chosen to prepare fuzzy derivation framework. Preparing process proceeded until mistakes kept up the dependability.
IV. RESULTANALYSISANDCONCLUSION
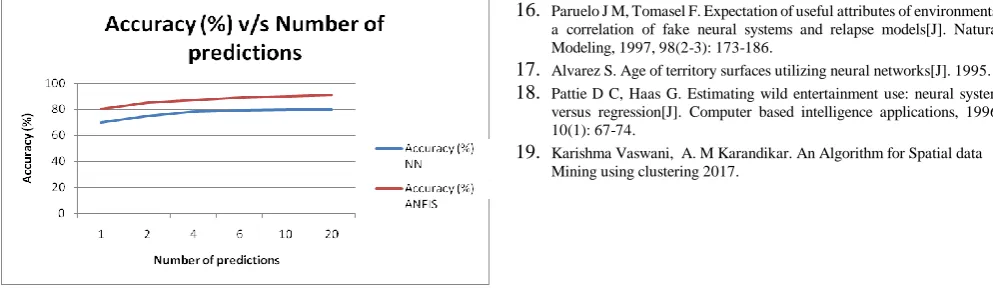
We compared the proposed ANFIS based prediction engine with the neural network based prediction system, and obtained the following outputs:
Table III. Accuracy v/s Number of prediction
Training Set Size
Number of Predictions
Accuracy (%) NN
Accuracy (%) ANFIS
5 1 70 80
10 2 75 85
20 4 78 87
30 6 79 89
50 10 79.5 90
100 20 79.6 91
[image:5.595.305.539.431.525.2]Figure 3. Prediction accuracy comparison
V. FUTUREWORK
Forest cover prediction is a very vast field of research, currently not a lot of work is done in the field of artificial intelligence for forest cover prediction, so researchers can look at this field in order to predict forest cover. Moreover, integration of block chain based techniques can be done, so that the process can be securely done for government organizations.
REFERENCES
1. Haykin S, Network N. A thorough foundation[J]. Neural Networks, 2004.
2. Blackard J A, Dean D J. Similar exactnesses of fake neural systems and discriminant examination in foreseeing timberland spread sorts from cartographic variables[J]. PCs and hardware in horticulture, 1999, 24(3): 131-151.
3. Paruelo J M, Tomasel F. Forecast of useful attributes of environments: a correlation of counterfeit neural systems and relapse models[J]. Natural Modeling, 1997, 98(2-3): 173-186.
4. Bosses T. Flag and picture handling with neural systems: a C++ sourcebook[M]//Signal and picture preparing with neural systems: J. Wiley, 1994:5724-5724.
5. Religious administrator, ChristopherM. Neural systems for example recognition[M]. Oxford University Press, 1995.
6. Hertz J, Krogh A, Palmer R G. Prologue to the hypothesis of neural calculation. [J]. American Journal of Physics, 1991, 62(1):27-29.
7. Yoon Y, Swales Jr G, Margavio T M. A correlation of discriminant examination versus counterfeit neural networks[J]. Diary of the Operational Research Society, 1993, 44(1): 51-60.
8. Bharath R, Drosen J. Neural system computing[C]//1994.
9. Reibnegger G, Weiss G, Werner-Felmayer G, et al. Neural systems as an apparatus for using lab data: correlation with straight discriminant examination and with arrangement and relapse trees[J]. Procedures of the National Academy of Sciences, 1991, 88(24): 11426-11430.
10. Marzban C, Paik H, Stumpf G J. Neural systems versus gaussian discriminant analysis[J]. Artificial intelligence applications, 1997, 11(1): 49-58.
11. Ripley B D. Example Recognition and Neural Networks[J]. Technometrics, 1999, 39(2):233-234.
12. Guan B T, Gertner G Z. Displaying singular tree survival likelihood with an arbitrary streamlining technique: a counterfeit neural system approach. [J]. Computer based intelligence Applications, 1995, 9(2):39-52.
13. Marzban C, Stumpf G J. A neural system for tornado forecast dependent on Doppler radar-inferred attributes[J]. Diary of connected meteorology, 1996, 35(5): 617-626.
14. Gimblett R H, Ball G L. Neural system models for observing and animating changes in backwoods asset management[J]. Computer based intelligence Applications, 1995, 9(2):103-123.
15. Jan J F. Order of remote detecting information utilizing versatile AI techniques[D]. Colorado State University, 1997.
16. Paruelo J M, Tomasel F. Expectation of useful attributes of environments: a correlation of fake neural systems and relapse models[J]. Natural Modeling, 1997, 98(2-3): 173-186.
17. Alvarez S. Age of territory surfaces utilizing neural networks[J]. 1995.
18. Pattie D C, Haas G. Estimating wild entertainment use: neural system versus regression[J]. Computer based intelligence applications, 1996, 10(1): 67-74.
19. Karishma Vaswani, A. M Karandikar. An Algorithm for Spatial data
Mining using clustering 2017. 1.
AUTHORSPROFILE
Sony .K. Ahuja completed her Bachelor of Engineering in Computer Science and from Ramdeobaba College of Engineering and Management , Nagpur , India in 2015 and Currently Pursuing P.G in Computer Science and Engineering from Ramdeobaba College of Engineering and Management , Nagpur , India and Research Paper work focuses on Image Processing and Machine Learning.
.
Prof. Aarti Karandikar has 16 years of teaching experience.She is currently working as Assistant Professor in the Department of Computer Science & Engineering, Shri Ramdeobaba College of Engineering and Management, Nagpur. She has published more than 25 research papers in reputed international journals and conferences. Her area of interest includes Data Warehousing and Data mining.