InTrans Project Reports
Institute for Transportation
9-2008
Iowa DOT Bridge Asset Management Using
PONTIS: Data Integration, Performance, and
Decision Support Tools
Omar G. Smadi
Iowa State University, [email protected]
Patrick Stein
Krishna Kallam
Follow this and additional works at:
http://lib.dr.iastate.edu/intrans_reports
Part of the
Civil Engineering Commons
This Report is brought to you for free and open access by the Institute for Transportation at Iowa State University Digital Repository. It has been accepted for inclusion in InTrans Project Reports by an authorized administrator of Iowa State University Digital Repository. For more information, please [email protected].
Recommended Citation
Smadi, Omar G.; Stein, Patrick; and Kallam, Krishna, "Iowa DOT Bridge Asset Management Using PONTIS: Data Integration, Performance, and Decision Support Tools" (2008).InTrans Project Reports. 157.
Iowa DOT Bridge Asset Management Using PONTIS: Data Integration,
Performance, and Decision Support Tools
Abstract
This project will address three research areas. The first covers the collection and integration of bridge structural performance data using strain gages and basic data acquisition devices. The second area deals with the development of a computerized system to capture bridge visual inspection data. The last deals with using PONTIS bridge management software to integrate the data for the purpose of developing an integrated bridge asset management program. This project will address three research areas. The first covers the collection and integration of bridge structural performance data using strain gages and basic data acquisition devices. The second area deals with the development of a computerized system to capture bridge visual inspection data. The last deals with using PONTIS bridge management software to integrate the data for the purpose of developing an integrated bridge asset management program. This project will address three research areas. The first covers the collection and integration of bridge structural performance data using strain gages and basic data acquisition devices. The second area deals with the development of a computerized system to capture bridge visual inspection data. The last deals with using PONTIS bridge management software to integrate the data for the purpose of developing an integrated bridge asset management program.
Keywords
Asset management; Bridge management systems; Bridge members; Bridges; Data collection; Decision support systems; Inspection
Disciplines
Civil Engineering
Comments
Iowa DOT Bridge Asset
Management Using Pontis: Data
Integration, Performance, and
Decision Support Tools
Final Report
September 2008
Sponsored by
University Transportation Centers Program,
U.S. Department of Transportation
About the MTC
The mission of the University Transportation Centers (UTC) program is to advance U.S.
technology and expertise in the many disciplines comprising transportation through the
mechanisms of education, research, and technology transfer at university-based centers of
excellence. The Midwest Transportation Consortium (MTC) is the UTC program regional
center for Iowa, Kansas, Missouri, and Nebraska. Iowa State University, through its Center for
Transportation Research and Education (CTRE), is the MTC’s lead institution.
Disclaimer Notice
The contents of this report refl ect the views of the authors, who are responsible for the facts
and the accuracy of the information presented herein. The opinions, fi ndings and conclusions
expressed in this publication are those of the authors and not necessarily those of the sponsors.
The sponsors assume no liability for the contents or use of the information contained in this
document. This report does not constitute a standard, specifi cation, or regulation.
The sponsors do not endorse products or manufacturers. Trademarks or manufacturers’ names
appear in this report only because they are considered essential to the objective of the document.
Non-discrimination Statement
Technical Report Documentation Page
1. Report No. 2. Government Accession No. 3. Recipient’s Catalog No.
MTC Project 2002-02
4. Title and Subtitle 5. Report Date
September 2008
6. Performing Organization Code
Iowa DOT Bridge Asset Management Using Pontis: Data Integration, Performance, and Decision Support Tools
7. Author(s) 8. Performing Organization Report No.
Omar Smadi, Patrick Stein, Krishna Kallam
9. Performing Organization Name and Address 10. Work Unit No. (TRAIS)
11. Contract or Grant No.
Midwest Transportation Consortium 2711 South Loop Drive, Suite 4700 Ames, IA 50010-8664
12. Sponsoring Organization Name and Address 13. Type of Report and Period Covered
Final Report
14. Sponsoring Agency Code
U.S. Department of Transportation
Research and Special Programs Administration 400 7th Street SW
Washington, DC 20590-0001
15. Supplementary Notes
Visit www.ctre.iastate.edu for color PDF files of this and other research reports.
16. Abstract
The Iowa DOT currently owns and maintains over 4,000 bridges and culverts on the state highway system. With heightened concern for the condition of these aging structures, methods for assessing and maintaining the structural performance of in-service bridges have become vital to the preservation of Iowa’s bridge network.
An economical data acquisition system that is portable and can be efficiently used on bridge structures could supplement visual inspections with field-measured values. By pursuing simplicity in the system interface and installation, tests could be completed by persons with limited engineering background. This concept can prevent bridges from being replaced that are thought to be structurally deficient and help estimate bridge condition in the database.
This report summarizes a research project for the Iowa Department of Transportation (Iowa DOT) to develop, implement, and operate an integrated bridge asset management system for the state of Iowa. The system is Pontis, first developed in 1989 and currently used by around 45 transportation agencies, both in the United States and internationally. This system will enable the Iowa DOT to make objective, cost-effective, and timely decisions regarding bridge maintenance, rehabilitation, and replacement.
17. Key Words 18. Distribution Statement
asset management—bridge inspection—data collection inventory—decision
support No restrictions.
19. Security Classification (of this
report) 20. Security Classification (of this page) 21. No. of Pages 22. Price
Unclassified. Unclassified. 71 NA
I
OWA
DOT
B
RIDGE
A
SSET
M
ANAGEMENT
U
SING
P
ONTIS
:
D
ATA
I
NTEGRATION
,
P
ERFORMANCE
,
AND
D
ECISION
S
UPPORT
T
OOLS
Final Report
September 2008
Principal Investigator
Omar Smadi
Research Scientist, Professor of Transportation Engineering
Center for Transportation Research and Education, Iowa State University
Co-Principal Investigators
Brent Phares
Associate Director, Bridge Engineering Center
Center for Transportation Research and Education, Iowa State University
Fouad Fanous
Professor
Department of Civil, Construction, and Environmental Engineering, Iowa State University
Research Assistants
Patrick Stein, Krishna Kallam
Authors
Omar Smadi, Patrick Stein, Krishna Kallam
Preparation of this report was financed in part
through funds provided by the U.S. Department of Transportation
through the Midwest Transportation Consortium,
Project 2002-02.
Project administered by
Midwest Transportation Consortium
2711 South Loop Drive, Suite 4700
Ames, IA 50010-8664
TABLE OF CONTENTS
ACKNOWLEDGMENTS ...VII
INTRODUCTION ...1
Project Scope ...1
Problem Statement ...1
PONTIS...2
RESEARCH AREAS FOR IMPLEMENTING PONTIS ...3
Collection and Integration of Bridge Structural Performance Data ...3
Development of a Computerized System to Capture Bridge Inspection Data ...3
Use of Pontis Bridge Management Software to Develop an IBAMS...4
APPENDIX A. UTILIZATION OF HANDHELD FIELD TESTING SYSTEM FOR
IMPROVEMENT OF BRIDGE LOAD RATING VALUES IN PONTIS ... A-1
APPENDIX B. PDA BASED BRIDGE INSPECTION FOR PONTIS BRIDGE
MANAGEMENT SYSTEM...B-1
APPENDIX C. IMPLEMENTATION AND CUSTOMIZATION OF PONTIS FOR
ACKNOWLEDGMENTS
INTRODUCTION
Project Scope
This report summarizes a research project for the Iowa Department of Transportation (Iowa
DOT) to develop, implement, and operate an integrated bridge asset management system
(IBAMS) for the state of Iowa. The system is Pontis, first developed in 1989 and currently used
by around 45 transportation agencies, both in the United States and internationally. This system
will enable the Iowa DOT to make objective, cost-effective, and timely decisions regarding
bridge maintenance, rehabilitation, and replacement.
Problem Statement
The Iowa DOT currently owns and maintains over 4,000 bridges and culverts on the state
highway system. With heightened concern for the condition of these aging structures, methods
for assessing and maintaining the structural performance of in-service bridges have become vital
to the preservation of Iowa’s bridge network.
The traditional approach has been for transportation agencies to allocate maximum funds to
bridges in critical condition, diverting resources from routine maintenance. This approach almost
always results in the gradual system-wide deterioration of bridge conditions. A bridge
management system (BMS) is therefore needed to provide a logical approach for allocating
bridge funds in ways that improve conditions on the network level, rather than simply at the
bridge level. A BMS emphasizes preventive bridge maintenance, i.e., maintaining bridges before
they become unsafe, over deferred maintenance.
A BMS relies heavily on visual inspection to assess the condition of bridge structures. However,
researchers have noted shortcomings of visual inspections. For example, visual inspections do
not permit accurate evaluation of bridge serviceability and safety. Ultimately, although continual
visual inspection of bridges is required for a BMS to succeed, these inspections provide limited
information about the performance and the capacity of bridge structures.
In contrast, field measurements can estimate various structural properties, such as load
distribution, support conditions, and unintended composite action. These tests are
non-destructive, relying on strain transducers for their data. Additionally, the structural benefits of
various maintenance techniques can be assessed by regularly testing in-service bridges.
PONTIS
Pontis is a BMS used by many transportation agencies for managing inspections, budgets, and
project development for bridge assets. The system was first developed by Cambridge
Systematics in 1989 and later expanded to meet the increasingly complex asset management
demands of transportation agencies through partnership with the American Association of State
Highway and Transportation Officials (AASHTO), the Federal Highway Administration
(FHWA), and state departments of transportation (DOTs). Pontis is currently licensed by
AASHTO to around 45 state DOTs and other agencies nationally and internationally.
Accurate bridge inspection data are essential to ensure that bridge management decisions, based
on the analysis of the database system, correctly reflect actual bridge conditions. Rigorous
quality control that does not compromise the speed of data collection is a crucial feature of any
data collection system.
In Pontis, a structure (bridge, culvert, tunnel, etc.,) is divided into individual component types
called elements. Each element has a predefined set of condition states, ranging from three to five.
For example, a “deck” element is defined as having five condition states, and an “unpainted steel
open girder” is defined as having four. A condition state of an element is defined by the extent of
damage or deterioration of that element. For example, the condition states for the “deck” element
are defined as follows:
•
Condition state 1. Element shows little or no deterioration
•
Condition state 2. Combined distress area of element < 2% of deck area
•
Condition state 3. Distress area between 2% and 10%
•
Condition state 4. Distress area between 10% and 25%
•
Condition state 5. Distress area > 25%
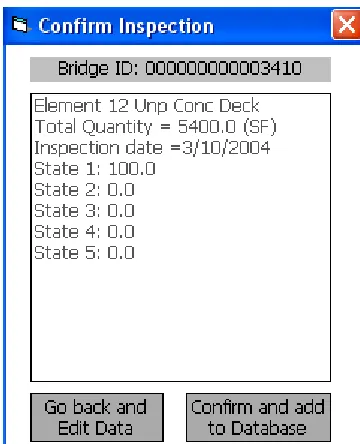
A bridge inspector conducting a Pontis-based element inspection must assign the total quantity
of elements into one or more of these condition states and record the data accordingly. An
inspector must be able to record data in percentages or quantities. For example, an inspector
must be able to record that, for bridge ID 3410 and element 12 (the “deck” element), x% of the
element lies in condition state 1, y% in condition state 2, and so on. The total percentage for each
element must be 100. Additional data to be collected include the total element quantities, if
changed from the previous inspection, any new elements added to the bridge, and notes for each
element. Any data collection tool should allow a bridge inspector to easily collect all necessary
bridge data.
RESEARCH AREAS FOR IMPLEMENTING PONTIS
The project of developing, implementing, and operating Pontis in the state of Iowa addresses
three research areas:
1.
Collection and integration of bridge structural performance data using strain gauges and
basic data acquisition devices
2.
Development of a computerized system to capture bridge inspection data
3.
Use of Pontis bridge management software to integrate the data for the purpose of
developing an IBAMS
Collection and Integration of Bridge Structural Performance Data
This research developed a field testing system that would help Pontis select suitable bridge
candidates for repair or replacement. This field testing system consisted of a handheld personal
digital assistant (PDA) for portable data recording, bridge strain gauges to measure bridges’ load
capacities, and a signal conditioning unit to process the information produced by the strain
gauges. Developing this system involved researching the available hardware and software,
programming the PDA to accurately record test data, testing and verifying the system’s accuracy
and usability, and outlining a methodology for assessing structural performance. A report for this
project is included in Appendix A.
The PDA selected was the Hewlett Packard iPAQ h5150, which was compatible with the
selected signal conditioning unit and had adequate memory and sufficient processing power for
field testing. This device also included an expansion pack that provided extended battery life,
which was deemed necessary for field testing. The signal conditioning unit was from National
Instruments and featured 16 channels of data acquisition from the strain gauges. Data transfer
between the signal conditioning unit and the PDA was through a PCMCIA card, typically used
in laptop computers. The strain gauges used in the field testing were Bridge Diagnostics
Incorporated (BDI) full-bridge strain transducers. Because these gauges were simple to install
and were reusable, state agencies could use them for economical field testing.
During testing, the PDA was primarily used as a storage device, with little data manipulation
capability due to the device’s limited driver functions. However, recently developed drivers for
handheld programming are evidence that further programming of the test equipment may provide
an agency with additional information after a field test. In addition to strains, the PDA could
collect additional information to assess bridge performance, such as accelerometer data, readings
from deflection gauges, and load cell data. This expandability ensures a testing system that can
be used to assess various bridge parameters.
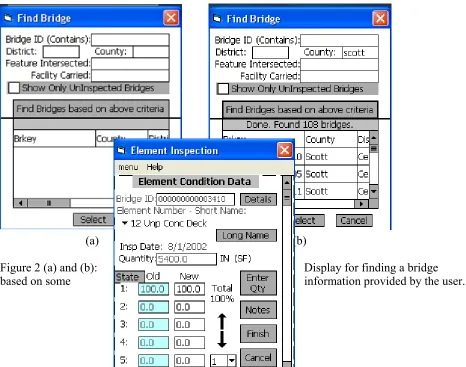
Development of a Computerized System to Capture Bridge Inspection Data
inspector must be provided information about the structure’s location, all of the structure’s
element IDs and definitions, each element’s condition state definitions, and any previous
inspection data for all bridge elements to be inspected. Additionally, bridge inspectors, who are
the end users of Pontis, should find the inspection system to be both user-friendly during data
entry and minimally strenuous during the import-export of data from Pontis. An important goal
was to provide a system that does not require special training. A report for this project is
included in Appendix B.
The system involves two applications: a bridge inspection application and a desktop
synchronization application. The bridge inspection application includes electronic data collection
forms loaded onto the PDA. Before loading, the application had been designed on a desktop
computer using MobileVB, a software tool for developing PDA applications. The PDAs tested in
this research included Hewlett Packard iPAQ h1945 and iPAQ h5455, though the bridge
inspection applications can function on any PDA running the Microsoft Pocket PC operating
system.
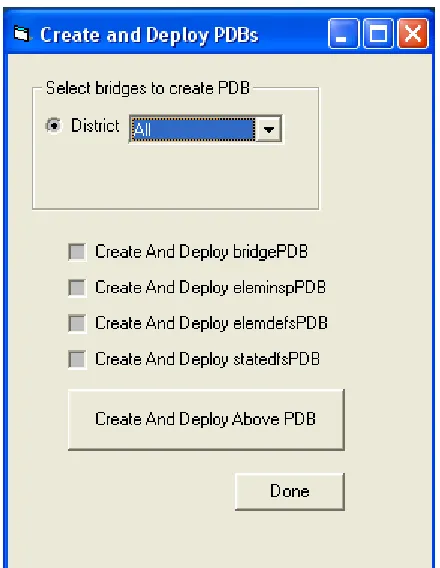
The desktop synchronization application, developed in Visual Basic, was designed to smoothly
transfer new field inspection data from the PDA to the Pontis database. The bridge inspector
connects the PDA to a desktop computer and clicks “Synchronize” on the desktop application
form, prompting the program to search the PDA for new inspection data to download to Pontis.
Manual data transfer is thus avoided. The application also helps load element and condition state
definitions, bridge information, and previous element inspection data, all of which are stored in
different files on the PDA, from the Pontis database to the PDA. The application was tested on a
Dell computer running the Windows XP Professional and Windows 2000 professional operating
systems. For testing, the application was run with a Sybase Adaptive Server Anywhere database,
though any ODBC compliant database, such as Oracle or SQL Server, should work too.
A PDA user’s manual for this computer program has been written for the Iowa Department of
Transportation to assist the bridge element inspection process, and the system was ready to use
from the beginning of 2005.
Use of Pontis Bridge Management Software to Develop an IBAMS
This research developed and implemented a working Pontis database for the Iowa DOT. Tasks
included customizing the default values for the state of Iowa and verifying the software for the
Iowa DOT. A report for this project is included in Appendix C.
Initial customization ensures that the BMS accurately models Iowa’s bridge system and
generates projects appropriately. The Pontis user’s manual was used to calibrate the following
five default values in Pontis:
•
Agency replacement costs for bridges
•
Agency MR&R costs for bridges
•
Deterioration rates
•
Policy matrix
After modifying the default values, simulations were run to compare the performance of Pontis
to the performance of the Iowa DOT’s current maintenance schedule.
It is clear from this research that Pontis will be unable to recommend projects and actions that
match the projects currently planned by the Iowa DOT, which are based on engineers’
Utilization of Handheld Field Testing System for Improvement of Bridge Load Rating Values in Pontis October 15, 2004
Word Count: 7,469
Patrick Stein
Iowa State University – CTRE 2901 S. Loop Dr., Suite 3100 Ames, IA 50010
515-296-6686 Fax 515-294-0467
ABSTRACT
Due to the growing number of structurally deficient bridges in the United States, methods for determining the structural performance of in-service bridges is vital to the preservation of the nation’s bridge network. By utilizing field testing, the response of the bridge due to a known traffic load can be assessed, and more accurate structural performance can be determined.
The objective of this research is to develop a field testing system that can be used assist the Pontis Bridge Management software in selecting suitable bridge candidates for repair or replacement. In conjunction with current development of a handheld device with Pontis inspection forms, development of a data collection system utilizing a handheld device that collects field test data to assist in the structural assessment of bridge structures will be
completed. This will include the programming of the device, testing and verification of the system’s accuracy and usability, along with the methodology used to assess structural performance. A summary of how this system can improve the structural assessment of an in-service bridge will be included, along with how this system can be utilized to assist the Pontis Bridge Management System software in selecting bridge candidates for repair and replacement.
INTRODUCTION
The Iowa Department of Transportation (IA DOT) currently owns and maintains over 4,000 bridges and culverts on the state highway system. The structural adequacy of these structures has been left to simplified rating equations and continual visual inspection. With heightened concern for the condition of these aging bridges, different solutions have been presented. Methods have been developed to test bridges using applied instrumentation and assess the bridges condition from the collected data. Bridge Management Systems (BMS), however, relies heavily on visual inspection to assess the condition of bridge structures. Field testing of in-service bridges has yet to be linked to the recently accepted Bridge Management System for determining allocation of funds by agencies. Although continual visual inspection of bridges is required for a BMS to succeed, these inspections are providing limited information about the performance and the capacity of bridge structures.
The development of an economical data acquisition system that is portable and can be efficiently used on bridge structures could provide a link between visual inspections and field measured values. By pursuing simplicity in the system interface and installation, tests could be completed by persons with limited engineering background. Not only could this concept prevent bridges from being replaced that are thought to be structurally deficient, but could also aid in estimating bridge condition in the database.
BACKGROUND
Pontis Bridge Management System
Managing the nation’s bridges includes tracking the inspection of structures, maintenance needs, along with
allocation of funds. Due to the complexity of this, many Bridge Management Systems (BMS) have been developed. A BMS is software designed to aid in the organization of a bridge network, and assist in allocating funds which ensure the most benefit to the users. Pontis, the most widely used BMS, has been selected by the Iowa DOT to manage their current bridge network. The program is dependant on mathematical formulations to determine benefit cost ratios, inflation, deterioration of individual elements, as well as additional functions to ensure the highest bridge network condition for a given budget. This program was developed by the FHWA, and is continually being updated by AASHTO to allow additional customization for an agency’s needs.
Utilizing Field Testing
Although many agencies have implemented the Pontis BMS and are currently utilizing its capabilities to determine the maintenance needs of their infrastructure, little structural performance of their bridges is truly known. Although continual visual inspections are being done on an element level, the bridge’s response to traffic loads is the primary concern for the safety of the users.
Several of researchers have presented the shortcoming of visual inspection in providing accurate data for a successful BMS [1, 2, 3]. For example, visual inspection does not permit accurate evaluation of bridge
serviceability and safety [1]. By incorporating a bridges’ existing state and actual response from field testing, parameters such as induced strain can be used to accurately determine the load rating of a bridge system. Current inspection guides offer limited opportunity for the structural adequacy to be estimated, even from a visual aspect [4]. The Manual for Condition Evaluation of Bridges [5], which outlines procedures for visual inspection, agrees that field testing is an effective means of attaining structural performance parameters of a bridge. This load testing is even more essential to those bridges whose response to live load is in question [5].
For the BMS to be optimized, accurate predictions of the remaining life of a bridge must be achieved [3]. Additional research by Chajes et. al. [2] has confirmed that reliable assessments of condition are essential to ensure proper use of limited funds. This project has lead to the prevention of unneeded repairs and proven that some low load rated bridges had considerable more capacity than traditional equations would imply [2]. This finding is also established by Wipf et. al. [6], and notes the savings of funds that can result from accurate structural evaluation of bridge parameters.
The current and emerging tools for condition assessment of in-service bridges will assist in the
development of optimal maintenance and management of bridges [1]. With the equipment required to field test a bridge becoming more economically viable, the benefits to an agency to accurately assess its infrastructure may outweigh the cost of the testing equipment.
Utilization of field measurements allows estimation of various structural properties. An assessment of load distribution, support conditions, along with unintended composite action can all be evaluated through
non-destructive testing using strain transducers [6]. This global evaluation can be utilized on bridges made of steel and concrete, along with bridges that contain innovative materials. In addition, structural benefits of various
created for these bridges that will not only prove as a model of changing bridge condition, but will also provide information on the effectiveness of current maintenance techniques [1, 2].
Structural Response of In-Service Bridges
Although the need for accurate structural capacity and condition assessment has proven beneficial to numerous agencies, the method of testing and evaluation is quite diverse. Due to a bridges behavior, interaction between various elements is difficult to assess. Although the load configuration during a field test is known, the contribution of various bridge elements to bridge performance is often qualitative. Due to this uncertainty in the evaluation, two main methods are being used to quantify structural parameters. The first is outlined in research completed by both [6] and [7], and involves utilizing field test data to “calibrate” or improve a finite-element (FE) model of the bridge. This method adjusts various properties of an initial model of the bridge until it most closely represents a structure that, computationally, best fits the tested data. Gauge location, along with sensor quantity, must be sufficient to accurately estimate the response of the superstructure. Parameters that can be adjusted within the model include the modulus of elasticity of various materials, the end conditions of the bridge, along with the stiffness of major elements. Once the finite element model is completed and calibrated, any load configuration can be applied to the model, representing the response of the in-service bridge to different truck loads.
Drawbacks of such a system include cost of the FE software, along with having personnel with FE background to operate the software. A significant amount of instrumentation may be required in more complex bridges for the program to calibrate itself accurately. Further measures must also be taken to ensure that the vehicle location on the structure is correlated with the measured strain value. These concerns often prove impractical to an agency that is unfamiliar with FE, and also have limited field testing experience.
The second method of utilizing field test data is summarized by research completed by Bakht et. al.[8]. This method involves instrumentation of the critical load carrying mechanisms of bridges. Although
instrumentation may not be sufficient to constrain the entire structure within a FE model, the members which will be most effected by live load will be assessed. Gauge location is critical to estimate parameters determined to be of most importance to the agency. These parameters can include neutral axis location of a cross-section, lateral distribution of loads, along with maximum live load strain and an estimate of support conditions. By eliminating a computer model of the bridge, significant assumptions may be required to estimate properties of the bridge elements. However, calculations are more practical for an agency to complete without consultation of specialists.
Pontis Load Rating
The Pontis software currently utilizes a transition probability model to estimate deterioration in different bridge elements. Combined with biannual visual inspections, Pontis uses mathematical methods to assess the performance of bridges, and allocates available funds accordingly. A goal of this research is to improve the performance assessment of bridges, therefore preventing rehabilitation and replacement of bridges that have sufficient strength.
The inclusion of field test data into the Pontis software is inherently difficult due to the division of bridge structures into several elements. Separation of these elements insures more complete visual assessment of the bridge. However, structural interaction of these elements is unavoidable during a field test, making individual element assessment unfeasible. Secondly, the level of this element interaction is vital in the performance of the bridge, therefore separation is undesirable for structural performance assessment. Interaction parameters can include composite action between the deck and girders, end restraint at the abutment, along with distribution of the load between girders. By incorporating the assessment of these parameters within Pontis, more accurate assessment of the structural adequacy will be possible.
Pontis currently separates projects into two categories; functional improvements and preservation actions. Preservation actions are associated with maintaining the physical condition of the bridge, therefore depend on inspection results and deterioration probabilities. Functional improvement projects seek to improve the
Numerous research projects have been completed to assess the utilization of NDE in rating of in-service bridges. Research by [9] outlines basic concepts behind field testing to rate in-service bridges. Many methods have been presented to use field test information to develop an improved rating. These methods often include further analysis, sometimes in search of improving a finite element model. This expanded method for bridge rating is outlined in research by [10]. This more rigorous analysis includes assessment of actual field dimensions, impact factor, both longitudinal and lateral load distribution factor, along with additional considerations. Although this level of input allows for possibly greater increases in the load capacity, few agencies are willing to generate such effort on a statewide plan. From this research, however, it was shown that the dominant factor in increasing load capacity was lateral distribution. Through study of the rating equation, this improvement can be directly applied to the bridge rating, as discussed later. This concept of direct improvement to the rating factor is verified through research completed by [11], however includes field measured strains instead of distribution factor.
OBJECTIVES
The objective of this research is to develop a field testing system that can be used assist the Pontis BMS in selecting suitable bridge candidates for repair or replacement. In conjunction with current development of a PDA capable of storing Pontis inspection forms, development of a data collection system utilizing the same handheld device will be completed. This will include research on available hardware and software, and the programming of the device to accurately record test data. Testing and verification of the system’s accuracy and usability, along with the methodology used to assess structural performance will also be completed. A summary of how this system can improve the structural assessment of an in-service bridge will be included, along with how this system can be utilized to assist the Pontis Bridge Management System software in selecting bridge candidates for repair and replacement.
SYSTEM CONFIGURATION AND PROGRAMMING
The first step in developing the handheld data acquisition system involved determining the capabilities of handheld devices and their compatiblity with available data acquisition hardware. Handhelds have many different names including Personal Digital Assistant (PDA), Palm Pilot, or Pocket PC. PDA is a general term that includes handhelds that operate on either the Palm OS operating system or the Pocket PC operating system. Palm Pilot and Pocket PC refer to the operating system that is used in the device, but can also be used as a general term to describe a handheld computer.
Due to the limited application of PDA’s as data collection devices, it was found to be easier to select companies that could provide signal conditioning of the data, and then determine the needed operating system to ensure compatibility. Signal conditioning refers to the manipulation of a signal or voltage, into a more accurate and recordable value. This is accomplished by providing consistent excitation to the gauge, along with gaining of the signal to a more distinct value. Strain gauge signals are typically gained by 100 to 1000 times the original signal to provide the storage device an opportunity to decipher changes in voltage.
Due to the infancy of the concept, few companies could supply hardware capable of recording numerous channels of data simultaneously. National Instruments, however, had experience with such a system and advertised 16 channels of acquisition. The system could also be utilized with either operating system, so the selection of available PDA’s increased. It was determined that the HP iPAQ h5150 was proven capable by National
Instruments, and had adequate memory and processing to accomplish field testing. The transfer of data between the signal conditioning unit and the PDA was through a PCMCIA card, typically used in Laptop computers. This card could be used in various PDA’s with expansion pack capabilities. The iPAQ had expansion pack capability which included an extended battery, which was deemed necessary for field testing. Although National Instruments advertised 16 channels of acquisition, the initial hardware purchase included only 8 channel capability, with the capability to expand to 16 channels. This was done to insure the hardware was capable for our particular bridge testing application.
The gauges used in the field testing are Bridge Diagnostics Incorporated (BDI) full-bridge strain
transducers. These gauges are simple to install and reusable, therefore applicable for economical field testing by a state agency. Figure 1b shows a typical transducer being installed in the field. Following grinding the surface clean, the gauge is glued to the member using a quick setting epoxy.
module. Advanced functions such as real time plotting were investigated, yet proved incapable by the limited computing power and development of the Labview PDA software.
SYSTEM TESTS
The data collection system was configured for a full-bridge gauge configuration, and was initially tested utilizing a load cell for the single channel data acquisition program. Following success of the single channel program, transducers were then used to test the data collection system. Although these initial tests provided no basis for accuracy, due to the loading being arbitrary, it did verify the collection of data, the recording rate, along with the sensitivity of the system. Initial tests of the system were completed relying completely on the battery power from the PDA expansion pack. This battery, although capable of providing adequate power for a single channel, was underpowered for multiple channel acquisition. Secondary tests were then completed with a series of 9 volt batteries powering the signal conditioning unit and providing excitation to the transducers. This was deemed adequate for a short-term solution to the battery problem.
The first test to verify the accuracy of the system was conducted in the laboratory using a small section of aluminum beam, simply supported and loaded with steel weights. The PDA system was tested against the venerable Bridge Diagnostic Inc. collection software. Four BDI transducers were applied, two on each flange. Each system was run separately, yet collected strain data at the same rate. The results are shown in Fig. 2a, with the BDI system shown in heavier line weight. Offset of the data in the abscissa axis is due to unequal loading rates of the beam. As shown in the figure, the BDI system has a much higher sensitivity to input signal than the PDA system. The BDI system fluctuates approximately 0.3 microstrain, when the PDA system fluctuated 3 microstrain in the verification tests. Due to this large variation, it was difficult to assess the accuracy of the data acquisition system, however proved reliable enough for expansion to 16 channel capabilities due to the relatively similar magnitudes and strain profiles. This test also did not verify the applicability of the nine volt batteries, due to the limited duration of the test, and only exciting four gauges. It was determined that these issues would be verified during various field tests of in-service bridges.
Following this lab test, the system was expanded to 16 channels, and the signal conditioning unit was modified to include connectors for gauge cables and a power switch. The system is shown in Figure 1b. Each connection on the signal conditioning unit transfers data for 4 gauges. The Labview program was also expanded to accept data from 16 channels, as advertised by National Instruments. However, initial tests recorded only 15 channels correctly. National Instruments was contacted, and it was verified that a bug existed in the software preventing 16 channels of acquisition from being recorded. Therefore the system was now limited to 15 channels of acquisition. The PDA system screen layout is shown in Fig. 2b, detailing the various controls of the system.
FIELD TESTS
An objective of this project is to configure a system that is applicable for various bridge types. Therefore tests were scheduled for both steel girder bridges as well as prestressed concrete girder bridges, and incorporated some innovative materials. These field tests were conducted in conjunction with a test where the BDI hardware was being utilized, therefore provided a direct comparison of test results. Gauge locations were the same, as well as truck paths over the bridge.
IA 92 Steel Girder Bridge
The first bridge that was tested was a 3-span steel girder bridge originally built in 1938, then retrofitted with additional exterior girders in 1967. This bridge is located in Pottawattamie County on Iowa Highway 92, near the town of Griswold. The original bridge was constructed with integral abutments; however the girders were
constructed noncomposite. Due to this strength deficiency, additional exterior girders were added, and constructed composite with a custom barrier detail. Further strengthening was completed by adding Fiber Reinforced Polymer (FRP) plates to the bottom flanges of all of the girders in 2003.
The current performance of this bridge configuration is difficult to assess without the assistance of a field test. By field testing, properties of the bridge can be estimated to assist in the evaluation of its current strength. Estimation can then be made on the effectiveness of the strengthening efforts. This bridge is especially unique, due to the exterior girder stiffness being much greater than interior girders due to composite action, along with the spacing of girders being irregular, and the properties of the interior girders being different. A typical section of the bridge is shown in Figure 3a.
channels reading midspan strains, and 6 reading abutment strains. The BDI strain profiles were then compared to the PDA data acquisition strain profiles to assess the accuracy of data collection. Figure 3b shows a direct
comparison of selected gauges with significant strain magnitudes. Like colors represent equivalent gauge numbers, therefore should have not only similar magnitudes, but also strain profile shapes. The BDI system is shown in heavier line weight. Although the profiles were of the same basic shape, the PDA system consistently recorded strain magnitudes lower on certain gauges, and somewhat higher on others. Some small differences in magnitude were expected, due to slight changes in truck position on the deck for each run. However two runs were completed for the BDI software and the magnitudes were nearly identical between similar truck paths. The BDI software is run on a laptop computer, and has a powered signal conditioning unit that receives electricity from a generator on the sight. The PDA system is self powered, and is relies on an excitation of 5 volts when the BDI system uses 10 volts. Increase in excitation voltage provides cleaner readings, due to a higher signal to noise ratio. However, excessive noise was not recorded on either systems strain profiles, so this was initially disregarded as the problem.
It was determined that the data collection system operated correctly, and stored readings at the specified rate, and the programmed sensitivity. However, an additional field test was to be conducted to retest the systems accuracy prior to deeming the system complete.
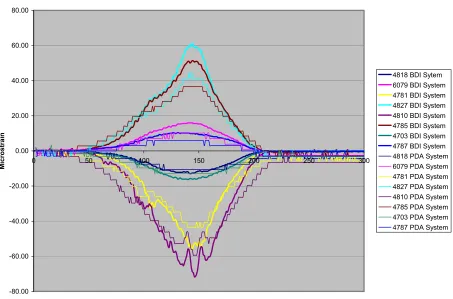
53rd Street Bridge, Prestressed Concrete Girder Bridge
The second test was conducted on a three span prestressed concrete girder bridge, with various deck configurations on each span. This bridge is located on 53rd Street in Bettendorf, Iowa, in Scott County. The PDA system was
utilized on the east span, which had a Fiber Reinforced Polymer (FRP) deck with a thin wearing surface.
Subsequent spans had conventional reinforced concrete decks, with the west span having epoxy coated bars and the middle span having uncoated bars. The girders were integral with the abutment for both end spans, and the bridge width was constant across the bridge. The BDI system was used on both end spans, to assess the effectiveness of the FRP decking when compared to a conventional reinforced concrete deck of similar span length. The PDA system was only used on the FRP deck span; however similar truck paths were run for both systems.
This was the first FRP deck in the United States to utilize composite bending action with pre-stressed concrete girders. The connection detail of this design is shown in Fig. 4a. Structural properties the bridge were determined using conventional specified equations, however true behavior of this design type was somewhat uncertain. Gauges were installed in the center of the bottom flange of the girders, and the side of the top flange. Identical truck paths were completed using both the BDI software and the PDA system to collect strain data. Fifteen channels of acquisition were completed, all reading at midspan of the girders. The BDI strain profiles were again compared to the PDA data acquisition strain profiles to assess the accuracy of data collection. Figure 4b shows a direct comparison of a selection of gauges which had significant strain magnitudes. Like colors represent equivalent gauge numbers, therefore should have not only similar magnitudes, but also strain profile shapes. The BDI system is shown in heavier line weight. This test proved that all gauges reading greater than 20 microstrain had significant loss in magnitude compared to the BDI values. However, strain profile shapes remained consistent with the BDI system, so it was determined that the system was underpowered. Although the nine volt batteries provided sufficient voltage to excite the gauges, the current provided by the small batteries was not capable of returning the signal without losses. This was not apparent in lab tests, due to the connection being significantly shorter between gauge and signal conditioning unit. Field tests were conducted with gauges being up to 75 feet away from the signal conditioning unit, compared to 20 feet during laboratory testing. Also, full 15 channel acquisition was never tested in the lab; therefore additional strain on the batteries was expected during field testing. Research of battery options was completed, and a rechargeable 12 volt battery was purchased, capable of extended acquisition with 2.2 Amp hours of power. Figure 1b details the completed system components, including the rechargeable battery.
East 12th Street Bridge, Steel Girder Bridge
The East 12th Street Bridge is a 2-span high performance steel girder bridge with integral abutments and a
conventional cast-in-place deck. This bridge was constructed in early 2004, and spans over Interstate 235 in Des Moines, IA. This test was conducted to insure the performance and reliability of the new battery. At any transverse section of the bridge, the girders have identical section properties and spacing. The PDA system was used to test strains near the north abutment of the bridge. During this test, the BDI software as well as wireless monitoring was utilized in conjunction with the PDA system.
concern for calculation accuracy. As shown in Fig. 2a, determination of strain magnitude can become difficult with the lower sensitivity PDA data acquisition system. National Instruments was contacted, and upon further
programming the sensitivity was effectively doubled for the system. This translates to a sensitivity of 1.5 microstrain, versus the previously tested 3 microstrain.
METHODOLOGY
Bridge rating is based on the simplified expression shown below in Equation (1). The Iowa DOT rates its bridges using this equation, and then enters each rating into the Pontis database. Therefore it is desirable to improve the accuracy of these rating factors with a simple approach, utilizing the additional information the field test data has provided to improve the already rated bridge network. Parameters such as end restraint and neutral axis of the girders can be qualitatively assessed, but offer no direct relationship to the rating equation. However, distribution of the live load to individual members is directly assessed in section 6.7.3 of AASHTO’s Manual for Condition Evaluation of Bridges [5]. The option exists to attain this distribution factor from field tests, therefore improving the rating of the tested bridge. Current ratings within the IA DOT database were found using empirical equations within bridge design specifications. As shown in Equation (1), the rating equation is inversely proportional to the live load effect. This allows the distribution factor to be directly changed in the equation without further
calculation. If the distribution factor originally used in the rating calculation is known, multiplying the current bridge rating by the ratio shown in Equation (5) satisfies the improvement of the load rating. The distribution factor used in the original rating is needed, as well as a field test distribution factor estimate. This ratio can then directly improve the rating value, preventing unneeded replacement and rehabilitation. Care must be taken, however, to insure that the bridge is capable of additional load. A highly deteriorated bridge may distribute loads effectively, yet have insufficient strength properties to justify an increase in the bridge load rating. Additional research is in progress to assess this issue.
An additional assumption made through field testing of bridges is that the bridge responds in a linear manner up until the point of specified rated load allowance. However, nonlinearities can be present as the load nears the bridges ultimate load capacity. Release of locked supports, cracking of concrete in tension, along with other mechanisms can occur during larger displacements due to extreme live load conditions. These parameters affect the Operating rating level, and are often not triggered by Inventory load levels. Therefore careful consideration must be made when using the below methodology to improve the Operating rating of in-service bridges.
⎟ ⎠ ⎜
⎝ +
+ ) (1 )
1
( 2
2L I L A I
A
(
DF)
CODELTOTL= . . (2)
( )
RFWRT= (3)
Combining Equations ⎟⎟ ⎠ ⎞ ⎜⎜ ⎝ ⎛ + − = ) 1 ( .) . ( 2 1 I A D A C L F D W RT TOT CODE (4)
Rating Equation Improvement Using Field Test Distribution Factor
⎬ ⎫ ⎨ ⎧ ⎟⎟ ⎞ ⎜⎜ ⎛ −
= W C AD DF CODE
RT 1 ( . .) (5)
⎟ ⎞ ⎜ ⎛ − = −
= C A1D 1 C A1D
RF (1)
⎭ ⎩
⎠
⎝ + FIELD
TOT
CODEL A I DF
F
D. .) (1 ) ( . .)
( 2
RF = rating factor for the live-load carrying capacity C = capacity of the member
D = dead load effect on the member L = live load effect on the member
I = impact factor to be used with the live load effect A1 = factor for dead loads
A2 = factor for live loads
(D.F.)CODE = Distribution Factor determined from empirical equations
(D.F.)FIELD = Distribution Factor determined from field test data
RT = bridge member rating in tons
W = weight of nominal truck in tons used in determining the live load effect
r under
s
in
s can therefore be ignored, and optionally instrumented due to there insignificant ffect on the load distribution.
The distribution factor (D.F.) is the fraction of live load transferred to the most heavily loaded girde maximum live load effects. Therefore, during field tests attempts are made to position the truck to produce maximum effects on the girders. This is typically done by lining a set of wheel-lines directly over a girder
centerline for one path, along with straddling a girder with the truck on another path. Estimation must also be made to estimate multiple presence of trucks; therefore a path can be aligned to represent a second truck on the bridge at the same time as one of the first paths. These three paths are the best estimate of maximum live load effects on the bridge. Strain readings from these paths must then be combined to estimate the distribution of loads. During the field test, the strains are assumed to be directly related to the bending moment in the section. Therefore the D.F. is the fraction of moment carried by the most heavily loaded girder, as shown in Equation (6). Determining the D.F. can be done by expanding basic beam theory equations for the girders, which was originally developed by [12]. A shown in Equation (7), inertias and neutral axis locations of each girder must be estimated for the tested bridge. Symmetry of the bridge can be used to estimate girder properties that are not instrumented. On wider bridges stra magnitudes were shown to decrease significantly as the transverse distance from the load path increases. Girder strains for these distanced girder
e
∑
= G G M M FD. . (
EI Mc =
ε
G G G G G c I EM =
ε
Combining Equations
∑
==
n i Gi Gi Gi G G j G jc
I
c
I
F
D
j j 1.
.
ε
ε
( 6) 7) that e on forcting beam stiffness, it would be ill-advised to apply any increase to the Operating rating
ve r e is preferred. This will insure the systems compatibility with personnel with mited engineering experience.
Methods are currently being developed to determine the inertias and neutral axis locations of girders directly from test strains. Currently, neutral axis location is being estimated from segments of the strain profiles are recording significant strain magnitudes. Figure 5a shows the neutral axis plot for the IA 92 Bridge. Clearly interpretation of neutral axis location is necessary, due to variations as the truck changes position. Therefore a statistical program ensuring accurate estimation of the neutral axis is desired. Once this location can be confidently estimated, the composite girder properties of the in-service bridge can be estimated. Figure 5b shows an example D.F. calculation for the IA 92 steel girder bridge. Neutral axis locations were estimated from strain profiles, and inertias of the composite girders were then determined using the steel girder design properties. Properties of th exterior girders were determined using the assumption of fully composite with the deck and barrier. This was verified by comparing test strain magnitudes and estimated neutral axis location with that of conventional design methods. It was found that the correlation was adequate to utilize the codified values for inertia and neutral axis. However, test strains in the farthest girder were neglected due to insignificant magnitude, and as an illustrati distanced girders that may not be instrumented. Due to this bridge being initially designed Noncomposite, Operating rating load levels may influence the effective bond between the deck and girders. Due this nonlinear mechanism largely effe
strictly from this test.
Further research is being completed to assess bridges that may demonstrate improved distribution, yet ha insufficient overall strength to justify an increase in capacity. A methodology that eliminates the need to furthe analyze and instrument the bridg
CONCLUSIONS
e utilized not only in the improvement of bridge load rating, but also serve as a record of bridge perform
ce of
e types can be instrumented and tested with any loading,
her
as is expandability insures a testing system that can be used for the assessment of various ridge parameters.
ECOMMENDATIONS
itudes
ings, as well as strains due to ambient traffic. However these effects prohibit accurate
is at ar t section of the girder to insure
tion
n in a ondition, and will provide information on the
s involve changes to the individual
s ing stribution factors would further benefit agencies assessment of
in-ontinual The completed research provides a basis for the improvement of bridge load rating using field test data. This improved load rating can be directly entered into the Pontis database, which can then assist in the assessment of repair and rehabilitation projects. Further development could allow for field test data to be stored in the Pontis database, and b
ance.
The components and software provide agencies with an economical method to better assess performan their bridge network. Through collection of these field measurements, this evaluation will allow an agency to prevent premature replacement or rehabilitation of structures, allowing funds to be utilized on truly deficient structures. Utilizing this handheld data acquisition system is not limited to bridge testing to improve load rating, however this was determined to be the most effective method to improve the Pontis BMS selection of bridges with deficient strength. With proper engineering judgment, various bridg
and assessments of bridge performance can be estimated.
The PDA was primarily used as a storage device, with little data manipulation capability due to the limited driver functions. However, recent development of additional drivers for handheld programming insures that furt programming of the test equipment could provide additional information to an agency following a field test. In addition to strains, the PDA could collect additional information beneficial to bridge performance. With the proper components added, the data acquisition system could collect accelerometer data, readings from deflection gauges, well as load cell data. Th
b
R
Recommendations for utilizing field test data to improve Pontis Bridge Load Ratings are as follows: • Field testing of in-service bridges should include only the test truck at crawl speed. Distribution
factor cannot be accurately determined with the above methodology when dynamic effects or additional ambient traffic is included. The truck should have adequate load to produce significant strain magn (+/- 20 με) to assess D.F. and neutral axis location. Trucks used in discussed field tests weighed a minimum of 55 kips, and produced adequate strain magnitudes. The system is fully capable of recording dynamic strain read
D.F. assessment.
• Instrument bridge girders near midspan. The most critical region for effective distribution of loads or near midspan. Gauges should therefore be placed at the same transverse location of the bridge ne midspan. Gauges should be instrumented on the bottom and topmos
significant strain magnitudes and accurate neutral axis estimation.
• Load Rating Improvement methodology is only valid for girder bridge types. The data acquisi system is capable of collecting strains on any bridge type or element surface; however distribution methodology is only valid for girder bridges. The system could still be utilized to assess live load strai bridge members to insure safety of older structure types. Periodic bridge testing could also provide histogram of strains, modeling the changing bridge c
effectiveness of changing maintenance techniques.
• Careful analysis should be conducted prior to improvement of Operating rating level. Although distribution of loads may not be affected by certain structural nonlinearities, assessment should still be made on possible nonlinear mechanisms. If any of these mechanism
beam properties, direct improvement of the rating value is invalid.
• Bridges with significant skew should be more thoroughly instrumented to assess distribution. No bridges that were field tested under this research included a skew on the bridge. Instrumentation location i vital on skewed bridges to assess load path issues related to distribution. Further research on field test methods to assess skewed bridge di
service bridge performance.
REFERENCES
1. Aktan, A. E., Farhey, D. N., Brown, D. L., Dalal, V., Helmicki, A. J., Hunt, V. J., Shelley, S. J. (1996). “Condition Assessment for Bridge Management” Journal of Infrastructure Systems, Vol. 2, No. 3, September, 1996, 108-117.
2. Chajes, M. J., Shenton III, H. W., O’Shea, D., Chaudhri, M. (2003). “Bridge Testing to Enhance Bridge Management in Delaware” Transportation Research Circular, 9th International Bridge Management
Conference, April, 2003, 201-203.
3. Organization for Economic Co-operation and Development (OECD). (1992). Road Transport Research, Bridge Management. Paris, France.
4. Federal Highway Administration (FHWA). (1988). Recording and Coding Guide for the Structural Inventory and Appraisal of the Nation’s Bridges. Washington, D.C.
5. American Association of State Highway and Transportation Officials (AASHTO). (1994). Manual for Condition evaluation of Bridges, Second Edition. Washington, D.C.
6. Wipf, T. J., Klaiber, F. W., Phares, B. M., Wood, D. L. (2002). “Evaluation of a Bridge Load Testing/Rating System”
7. Farhey, D. N., Naghavi, R., Levi, A., Thakur, A. M., Pickett, M. A., Nims, D. K., Aktan, A. E. (2000). “Deterioration Assessment and Rehabilitation Design of Existing Steel Bridge” Journal of Bridge Engineering,
Vol. 5, No. 1, February, 2000, 39-48.
8. Bakht, B., Jaeger, L. G. (1992). “Ultimate Load Test of Slab-on-Girder Bridge” Journal of Structural Engineering, Vol. 118, No. 6, June, 1992, 1608-1624.
9. Cai, C., Shahawy, M. (2003). “Understanding Capacity Rating of Bridges from Load Tests” Practice Periodical on Structural Design and Construction, Vol. 8, No. 4, November 1, 2003
10. Barker, M. (2001). “Quantifying Field-Test Behavior For Rating Steel Girder Bridges” Journal of Bridge Engineering, Vol. 6, No. 4, July/August, 2001.
11. Cai, C., Shahawy, M. (2004). “Predicted and Measured Performance of Prestressed Concrete Bridges” Journal of Bridge Engineering, Vol. 9, No. 1, January 1, 2004.
12. Stallings, J. M., and Yoo, C. H. (1993). “Tests and rating of short-span steel bridges.” Journal of Structural Engineering, 119(7), 2150-2168.
13. American Association of State Highway and Transportation Officials (AASHTO). (1996). Standard Specification for Highway Bridges. Washington, D.C.
List of Figures
Figure 1 Pontis load rating screen and system layout pictures.
Figure 2 Data acquisition system verification results and PDA screen layout. Figure 3 IA 92 Steel Girder Bridge details.
Figure 4 53rd Street Prestressed Concrete Girder Bridge details.
a. Pontis load rating screen layout.
[image:32.612.90.526.255.673.2]
b. Handheld data acquisition system details.
-20 -15 -10 -5 0 5 10 15 20 25 30
0 100 200 300 4
Chan. 1 PDA system Chan. 2 PDA system Chan. 3 PDA system Chan. 4 PDA system Chan. 1 BDI system Chan. 2 BDI system Chan. 3 BDI system 00 500 600 Chan. 4 BDI system
a. PDA system verification results.
[image:33.612.95.520.91.375.2]b. PDA data acquisition screen layout.
a. IA 92 typical bridge section.
-60 -40 -20 0 20 40 60 80 100 120 140 160
0 200 400
Reading
M
icro
s
trai
n
4810 BDI System 4691 BDI System 4781 BDI System 4803 BDI System 4696 BDI System 4785 BDI System 4829 BDI System 4810 PDA System 4691 PDA System 4781 PDA System 4803 PDA System 4696 PDA System 4785 PDA System 4829 PDA System
[image:34.612.72.539.72.223.2]b. IA 92 bridge strain profile comparison.
rd
a. 53 Street Bridge typical FRP deck to girder connection detail.
-80.00 -60.00 -40.00 -20.00 0.00 20.00 40.00 60.00 80.00
0
4818 BDI Sytem 6079 BDI System 4781 BDI System 4827 BDI System 4810 BDI System 4785 BDI System 4703 BDI System
50 100 150 20 2
Reading
Micros
tra
in
0 50 300
4787 BDI System 4818 PDA System 6079 PDA System 4781 PDA System 4827 PDA System 4810 PDA System 4785 PDA System 4703 PDA System 4787 PDA System
[image:35.612.160.453.73.270.2] [image:35.612.84.537.306.605.2]s. b. 53rd Street Bridge strain profile comparison.
0 10 20 30 40 50 60
0 100 200 300 400 500 600 700
Reading Neu tral Axis , in ch es fro m b o tt o m f lan g e Girder 1 Girder 2 Girder 3 Girder 4
a. Example neutral axis plot for IA 92 Bridge girders.
Girder # 1 2 3 4 5 6
IG (in4) 35313 9890 7618 10385 9890 35313
CG (in) 37.4 25.8 20.8 25.3 25.8 37.4
εG 48.57 155.90 67.96 31.33 6.17 N/A
εGIG/cG 45860 59762 24890 12860 2365
ΣεGIG/cG 145737
410 . 0 145737 59762 . . 1 = = =
∑
= n i Gi Gi Gi G G j G j c I c I F D j j ε ε410
.
0
.)
.
(
D
F
FIELD=
(Per Truck)13 . 1 ) 12 ( 5 . 5 2 ) 48 101 ( 5 . 5 .) . ( = + = = s F
D CODE (Per Wheel Line) (D.F.)CODE =0.564 (Per Truck)
38 . 1 410 . 0 564 . 0 .) . ( .) . ( = = ⎭ ⎬ ⎫ ⎩ ⎨ ⎧ FIELD CODE F D F
D (38% Increase)
[image:36.612.72.532.122.683.2]