Dependencies in political studies (non-linearity and typical
methodological errors)
Mikhail Basimov1,*
1Russian State Social University, psychological faculty, 129226Wilhelm Pieck street, 4, build.1, Moscow, Russia
Abstract. The article raises the question of studying the statistical dependencies in a sociological research. Most sociologists, if they study cause and effect relations, offer interpretations of only linear relations and linear models based on their data. However, the problem arises not only with respect to the fact that sociologists interpreting any linear dependencies ignore a large number of simple non-linear relations (type 1 errors) often without understanding the essence of the issue. In the last 20-25 years, they often study processes not so simple to describe them by means of linear models. And sociologists go (consciously or not) along the way when weak linear relations (not strong ones are detected), referring to the hypothesis of zero correlation coefficient (saving stars SPSS), began to be presented as “significant” and tacitly understood as sufficiently strong correlations of a scientific interest for interpretation of cause and effect relations.But there is an even more significant error (type 2 errors), when they fail to notice not only the simplest non-linear dependencies, but strong simple non-linear dependencies between the parameters that provide their linear approximations with a weak correlation, and even a very weak correlation (0.11-0.3), which completely distorts the real picture of the phenomenon or process under study. It turns out to be scientific knowledge that does not correspond to reality, which contributes to the parallel development of philosophical (qualitative) analysis of social processes, based mainly on an intuitive understanding of social problems, the emergence of contradictions between the approaches. The article deals with some individual dependencies and their interpretation according to the results of the study of political preferences of young people, demonstrating the type 1 and 2 errors.
1. I
NTRODUCTIONToday, sociologists (psychologists) work on synergetic ideas applied to social sciences (human sciences) at the philosophical and methodological level, on the one hand, and with the exception of individual single studies (mainly plotting points for individual pairs of parameters) and based on their data, they offer interpretations of basically only linear relations, interpretations of linear models, on the other hand. However, according to our experience, the overwhelming majority of linear dependencies make up a small part of strong dependencies, and their content is rather trite and predictable.
A massive descending trend (intentional or unconscious) to the low values of correlation coefficient is traced, when “non-zero correlation” (hypothesis of zero correlation coefficient) becomes sufficient to describe the relation as strong. This may be attributed to a lack of strong linear relations in the analysis that have an absolute value more than 0.6 (or at least 0.5), when any predominantly non-linear objects are studied. And the tools set is still being used representing the linear model, and the researchers do not want or do not realize that it is
time for another analysis of experimental data in the context of synergetic paradigm and non-linear models.
For example, the article of the candidate of engineering sciences and PhD candidate “Correlation Analysis in Sociological Research” cites and approves (judging by the content thereof) the opinion from a political sociology textbook: there is an opinion that values of correlation coefficients above 0.5 are not very often in sociological studies, therefore, it is possible to take into account those that are equal to or exceed 0.3, i.e. they characterize moderate correlation of indicators.
Linear dependencies are symmetric by definition. It does not matter for them what the cause is (an independent variable), and what the effect is (a dependent variable). This is determined at will of the researcher, and is often dictated by his interests, concept and model, theoretical arguments, subjective views on the subject of research. The correlation method and linear relations, identified by him, do not allow choosing the direction of relation. The cause and effect in this case are mathematically equal, and may be interpreted arbitrarily at will of the researcher.
logically deduces, and often feels that other patterns simply do not exist. In addition, some more complex sociological patterns are mostly unpredictable and require experimental study, further analytical work, which is not limited to linear representations.
The classical apparatus of natural science was also originally created primarily on a linear basis, when any equal changes in one – the independent value must necessarily correspond to equal changes in the dependent one. The world of linear functions is uniform: a linear function impartially (that is, regardless of the independent variable value) responds with the same increments to identical increments of the independent variable. It can describe neither resonant bursts, nor saturation, nor oscillations.
Although in the past physics knew many non-linear theories, we could not call the physics of the past as non-linear even with a great stretch. It lacked the main thing for that: the non-linearity has not yet taken its rightful place among the “first principles” on which physical thinking was based then. Most physicists were confident that the main line of cognitive plot development ran away from non-linear models, and the few experimentally discovered laws were more likely the annoying exceptions. Only in the middle of the 20TH century, everything changed dramatically.
The experiment is mainly secondary in Humanities, and must confirm the hypothesis put forward by the researcher; and his thinking is structured in such a way that formulation of the hypothesis is usually unconsciously of a linear nature. Only if the experiment in Humanities becomes a more significant method of cognition, there will be practice, first to identify the dependencies, including not always obvious ones, and then try to interpret them, theoretically comprehend and go to the next experimental stage of cognition.
A non-linear effect is an effect described by some non-linear dependence. Mathematically, such dependencies are expressed by non-linear functions. In order to avoid a methodological impasse in a person and society study and reach a fundamentally new level in interpretation of research results, it would be sufficient to focus on the simplest non-linear dependencies: the dependencies with the maximum, dependencies with the minimum, and monotonic dependencies (increasing and decreasing) that are far from linear in their form.
2.
M
ATERIALS AND METHODSBased on the author’s [2] method of multiple comparison, a new approach was elaborated for studying variously-shaped statistical dependencies. This method employs a generalized version of the multiple comparison method for quantile splitting (triads, quarters, quinters) of data by each parameter being measured, so that there is no need to preliminarily propose a hypothesis about the shape of dependence. As a result, the strength and shape of dependence are determined while linear dependencies are established as a specific particular case. The proposed approach not only enables the simultaneous tracking of various types of non-linear dependencies, but also makes
it possible to determine for which intervals of parameter values those dependencies are observed. This allows a more precise interpretation of results.
We’ll look at the case study of political preferences of young people, which shows that ignoring the complex nature of the political realities perception and seeking to restrict the results of such studies by any mechanistic views lead not only to the loss of a large amount of information (represented by simple non-linear relations), but also to a lot of system errors in the results interpretation.
190 respondents were interviewed during the sociological research.
3.
R
ESULTSLinear dependencies are symmetric by definition. Therefore, when applying our method for the identified linear dependencies, we choose only one option of two symmetrical, according to the linear correlation, to the structured representations of dependencies that fall under conditions for selecting strong relations.
Overall, 21 relatively strong (the correlation coefficient modulo more than 0.5) linear (close to linear) dependences were identified. Only 10 dependencies can be attributed to strong (the correlation coefficient modulo more than 0.6) linear dependencies out of 21. Only 3 dependencies out of 10 were really strong (the correlation coefficient modulo is more than 0.7).
Linear dependencies, as a rule, connect related parameters, they are easily predictable, and, therefore, do not represent any large heuristic interest for the researcher. However, a person, by virtue of his usual research logic, foresees, formulates in the form of research hypotheses, logically deduces precisely such dependencies and often feels that other patterns simply do not exist. In addition, some more complex sociological (and beyond) patterns are mostly unpredictable and require experimental study, further analytical work, which is not limited to the linear representations.
To emphasize the above, we shall list the identified and relatively strong linear dependencies (abs (R)> 0.5) for 2 of 7 conceptual groups.
1. Dependence of the parameters: “Attitude to V.V. Zhirinovsky” and “Attitude to the LDPR party”;; “Attitude to G.A. Zyuganov” and “Attitude to the CPRF party”.
2. Dependence of the parameters: “Attitude to V.V. Putin” and “Attitude to the United Russia party”;; “Attitude to D.A. Medvedev” and “Attitude to the United Russia party”;; “Attitude to V.V. Putin” and “Attitude to D.A. Medvedev”.
Linear dependencies can rather serve as monitoring of sincerity of the respondents' answers, as checking the results for the absence of falsified responses in the questionnaire (equivalent of deceit psychological scales).
We turn first to one of the strongest simplest non-linear dependence, which does not fall into the list of especially gross errors (type 2 errors in the author’s notation), since the correlation for the considered pair of parameters is close to zero (-0.07), and it cannot be of
any priori interest in the linear representations. In this case, the real non-linear dependence is simply not fixed, for most researchers it simply does not exist. In our view, this is type 1 error.
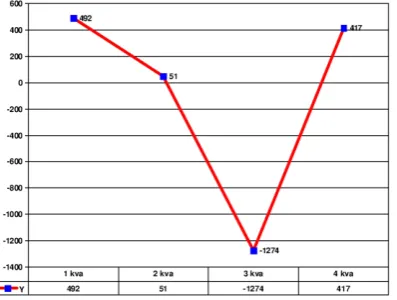
Table 1. Dependence of the parameter “Attitude to the United Russia party” (Y) on the parameter “Attitude to V.V. Zhirinovsky” (X) as comparative weightiness of the parameter
Y for quarters on a scale X Quarters on
the scale X the parameter Y for quarters Comparative weightiness of
X-4 +417
X-3 -1274
X-2 +51
X-1 +492
Factor of the connection strength = 0.75 (0.03) Coefficient of correlation = -0.07
The cause for the growth of a positive attitude towards V.V. Zhirinovsky in the first three quarters is a sharp decline in attitudes towards the United Russia ruling party (from +492 to -1274 by relative weight). Then, at the final stage of growth of V.V. Zhirinovsky acceptance, there is a sharp rise in the acceptance of the United Russia party of power (from -1274 to +417 on relative weight) at a high level (preference in the elections) to the values close to the initial (1 quarter), when the acceptance of V.V. Zhirinovsky was minimal. It may be noted that the acceptance or non-acceptance of V.V. Zhirinovsky promotes the loyalty to the United Russia ruling party (1st and 4th quarters), but the process of forming a positive attitude towards the politician leads to the minimum with respect to the United Russia party. The graph of dependence (Table 1) is given in Figure 1.
The dependency diagram is shown in Figure 1. Fig. 1. The chart of dependence of the parameter “Attitude to the United Russia party” on the parameter “Attitude to V.V. Zhirinovsky”
The inverse dependence is weak (Factor of the connection strength = 0.03). And the attitude to the ruling party United Russia does not form Attitude to the chairman of the party of the parliamentary opposition V.V. Zhirinovsky. Linear correlation also does not give
grounds for interpretations (Coefficient of correlation = -0.07).
Consider the number of different dependencies for the model of the quarts of the independent parameter. In general, 107 simplest non-linear dependencies were found in the model for quarts of the independent variable (with the strenght of relation coefficient (Factor of the connection strength) SV> 0.5). Relatively strong linear dependencies (with a correlation coefficient with modulo is a large 0.5), we have only 21.
Value 0.14 is that Rubicon after which (for a sample of 190) the correlation in the research community is considered significant and noteworthy when interpreting its results in traditional linear models. Sociologists and psychologists (see numerous articles) too often make no difference in the correlation coefficient value: 0.14, 0.6 or even 1, it is “significant” for them and that is more than enough.
65 dependencies out of 107 with the strength of relation coefficient SV> 0.5 can be attributed to type 1 errors in the traditional correlation approach, and 42 to type 2 errors.
70 dependencies out of 107 can be identified with the strength of relation coefficient SV> 0.6. In the correlation approach, 44 dependencies out of 70 can be attributed to type 1 errors, and 26 to type 2 errors. There are 10 linear dependencies with the coefficient of correlation modulo greater than 0.6.
46 dependencies out of 70 can be identified with the strength of relation coefficient SV> 0.7. In the correlation approach, 28 dependencies out of 46 can be attributed to type 1 errors, and 18 to type 2 errors. There are 3 linear dependencies with the coefficient of correlation modulo greater than 0.7.
28 dependencies out of 46 can be identified with the strength of relation coefficient SV> 0.8. In the correlation approach, 15 dependencies out of 28 can be attributed to type 1 errors, and 13 to type 2 errors. There are no linear dependencies with the coefficient of correlation modulo greater than 0.8.
There were found 57 (for 57 pairs of parameters) linear dependencies “significant” by the critical value in the hypothesis that the correlation coefficient is zero (abs (R)> 0.14, for a sample of 190), on the one hand, and related to the very weak correlations (abs (R) <0.3), on the other hand.
At the same time, for the same pairs of parameters, 26 sufficiently strong non-linear relations were identified (with a relation coefficient greater than 0.6), which could be considered in terms of the “significant” correlation, as linear relations of interest to be interpreted within linear models.
any priori interest in the linear representations. In this case, the real non-linear dependence is simply not fixed, for most researchers it simply does not exist. In our view, this is type 1 error.
Table 1. Dependence of the parameter “Attitude to the United Russia party” (Y) on the parameter “Attitude to V.V. Zhirinovsky” (X) as comparative weightiness of the parameter
Y for quarters on a scale X Quarters on
the scale X the parameter Y for quarters Comparative weightiness of
X-4 +417
X-3 -1274
X-2 +51
X-1 +492
Factor of the connection strength = 0.75 (0.03) Coefficient of correlation = -0.07
The cause for the growth of a positive attitude towards V.V. Zhirinovsky in the first three quarters is a sharp decline in attitudes towards the United Russia ruling party (from +492 to -1274 by relative weight). Then, at the final stage of growth of V.V. Zhirinovsky acceptance, there is a sharp rise in the acceptance of the United Russia party of power (from -1274 to +417 on relative weight) at a high level (preference in the elections) to the values close to the initial (1 quarter), when the acceptance of V.V. Zhirinovsky was minimal. It may be noted that the acceptance or non-acceptance of V.V. Zhirinovsky promotes the loyalty to the United Russia ruling party (1st and 4th quarters), but the process of forming a positive attitude towards the politician leads to the minimum with respect to the United Russia party. The graph of dependence (Table 1) is given in Figure 1.
The dependency diagram is shown in Figure 1. Fig. 1. The chart of dependence of the parameter “Attitude to the United Russia party” on the parameter “Attitude to V.V. Zhirinovsky”
The inverse dependence is weak (Factor of the connection strength = 0.03). And the attitude to the ruling party United Russia does not form Attitude to the chairman of the party of the parliamentary opposition V.V. Zhirinovsky. Linear correlation also does not give
grounds for interpretations (Coefficient of correlation = -0.07).
Consider the number of different dependencies for the model of the quarts of the independent parameter. In general, 107 simplest non-linear dependencies were found in the model for quarts of the independent variable (with the strenght of relation coefficient (Factor of the connection strength) SV> 0.5). Relatively strong linear dependencies (with a correlation coefficient with modulo is a large 0.5), we have only 21.
Value 0.14 is that Rubicon after which (for a sample of 190) the correlation in the research community is considered significant and noteworthy when interpreting its results in traditional linear models. Sociologists and psychologists (see numerous articles) too often make no difference in the correlation coefficient value: 0.14, 0.6 or even 1, it is “significant” for them and that is more than enough.
65 dependencies out of 107 with the strength of relation coefficient SV> 0.5 can be attributed to type 1 errors in the traditional correlation approach, and 42 to type 2 errors.
70 dependencies out of 107 can be identified with the strength of relation coefficient SV> 0.6. In the correlation approach, 44 dependencies out of 70 can be attributed to type 1 errors, and 26 to type 2 errors. There are 10 linear dependencies with the coefficient of correlation modulo greater than 0.6.
46 dependencies out of 70 can be identified with the strength of relation coefficient SV> 0.7. In the correlation approach, 28 dependencies out of 46 can be attributed to type 1 errors, and 18 to type 2 errors. There are 3 linear dependencies with the coefficient of correlation modulo greater than 0.7.
28 dependencies out of 46 can be identified with the strength of relation coefficient SV> 0.8. In the correlation approach, 15 dependencies out of 28 can be attributed to type 1 errors, and 13 to type 2 errors. There are no linear dependencies with the coefficient of correlation modulo greater than 0.8.
There were found 57 (for 57 pairs of parameters) linear dependencies “significant” by the critical value in the hypothesis that the correlation coefficient is zero (abs (R)> 0.14, for a sample of 190), on the one hand, and related to the very weak correlations (abs (R) <0.3), on the other hand.
At the same time, for the same pairs of parameters, 26 sufficiently strong non-linear relations were identified (with a relation coefficient greater than 0.6), which could be considered in terms of the “significant” correlation, as linear relations of interest to be interpreted within linear models.
[image:3.595.74.273.560.710.2]Then, in 26 cases, when considering the “significant” correlations and describing the relation between parameters as linear, we get the grossest errors (type 2 errors), since in these cases there are strong relations of the simplest non-linear form, and they must be interpreted in the synergistic views, the non-linear nature of patterns in the study of political preferences.
Further, we consider dependencies that represent only examples of gross research errors, which most researchers usually consider in the linear representations, as the noteworthy “significant” correlations, although in fact these very weak linear relations can simultaneously be considered as strong simple non-linear relations of great interest.
Table 2. Dependence of the parameter “Attitude to A.A. Navalny” (Y) on the parameter “Attitude to the CPRF party” (X) as comparative weightiness of the parameter Y for quarters
on a scale X Quarters on
the scale X the parameter Y for quarters Comparative weightiness of
X-4 -114
X-3 +1420
X-2 -183
X-1 -1527
Factor of the connection strength = 0.97 (0.29) Coefficient of correlation = 0.22
Fig. 2. The chart of dependence of the parameter “Attitude to A.A. Navalny” on the parameter “Attitude to the CPRF party”
It is possible to identify two unequal areas in the dependency. Initially, there is a close to linear growth (from -1527 to +1420) of the dependent variable from quart 1 to quart 3 of the independent variable (attitude to the Communist Party of the Russian Federation), and then the decline of the “Attitude towards A.A. Navalny” at quart 4 of the independent variable, but up to the values (-114) are much larger than the initial (-1527) for quart 1. There is a general positive trend in the acceptance of A.A. Navalny (from -1527 to -114 by comparative weight), which is expressed by the value of weak, but not zero correlation. The graph of dependence (Table 2)given in Figure 2.
Table 3.Dependence of the parameter “Attitude to A.A. Navalny” (Y) on the parameter “Attitude to G.A. Zyuganov” (X) as comparative weightiness of the parameter Y for triads on
a scale X Triads on the
scale X Comparative weightiness of the parameter Y for triads
X-3 -48
X-2 +778
X-1 -891
Factor of the connection strength = 0.73 (0.14) Coefficient of correlation = 0.28
There is a general positive trend (from -891 to -48 on relative weight) in the acceptance of A.A. Navalny in the present dependency for the independent parameter “Attitude towards G.A. Zyuganov”. The graph of dependence (Table 3) isgiven in Figure 3.
Fig 3. The chart of dependence of the parameter “Attitude to A.A. Navalny” on the parameter “Attitude to G.A. Zyuganov”
The dependence with asymmetric maximum and general growth. There is a much smaller value (-891) of the “Attitude towards A.A. Navalny” for the low-level triad of the attitude towards G.A. Zyuganov than for the high-level triad independent parameter (-48). Therefore, with a maximum for an average level, it is possible to discuss the general positive dynamics of the attitude towards A.A. Navalny when comparing the low and high levels of attitudes towards G.A. Zyuganov.
Next, we provide a dependence related to the content of the previous one, when the independent variable is no longer G.A. Zyuganov, but his CPRF party. The dependence between these parameters is defined for the independent variable quarters.
Table 4. Dependence of the parameter “Attitude to A.A. Navalny” (Y) on the parameter “Attitude to the CPRF party” (X) as comparative weightiness of the parameter Y for quarters
on a scale X Quarters on
the scale X the parameter Y for quarters Comparative weightiness of
X-4 -69
X-3 +857
X-2 -160
X-1 -816
Factor of the connection strength = 0.57 (0.20) Coefficient of correlation = 0.22
The graph of dependence (Table 4) is given in Figure 4.
Fig. 4. The chart of dependence of the parameter “Attitude to A.A. Navalny” on the parameter “Attitude to G.A. Zyuganov”
The pattern of relation resembles the previous one. Now, due to a more detailed solution of the problem, when the independent parameter is divided into quarts, two unequal areas can be identified. Initially, it is the near linear growth (from -816 to +857) of the dependent variable from quart 1 to quart 3 of the independent variable (related to the CPRF), and then the decline of the “Attitude to A.A. Navalny) at quart 4 of the independent variable, but up to the values (-69) that are much larger than the initial (-816) for quart 1.
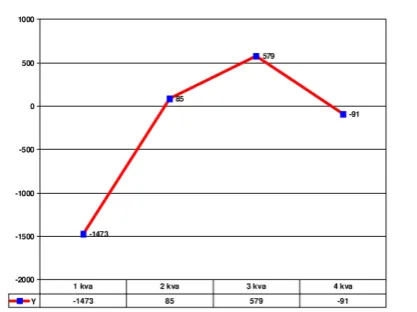
Table 5.Dependence of the parameter “Attitude to G.A. Zyuganov” (Y) on the parameter “Attitude to the Fair Russia
party” (X) as comparative weightiness of the parameter Y for quarters on a scale X
Quarters on
the scale X the parameter Y for quarters Comparative weightiness of
X-4 -91
X-3 +579
X-2 +85
X-1 -1473
Factor of the connection strength = 0.59 (0.40) Coefficient of correlation = 0.22
The graph of dependence (Table 5) is given in Figure 5.
Fig. 5. The chart of dependence of the parameter “Attitude to G.A. Zyuganov” on the “Attitude to the Fair Russia party”
Below, we give the description of five dependencies of the discussed category:
Table 6.Dependence of the parameter “Attitude to the Yabloko party” (Y) on the parameter “Attitude to G.A. Zyuganov” (X) as comparative weightiness of the parameter Y
for quarters on a scale X Quarters on
the scale X the parameter Y for quarters Comparative weightiness of
X-4 +572
X-3 +31
X-2 +1883
X-1 -978
Factor of the connection strength = 1.14 (0.73) Coefficient of correlation = 0.29
The graph of dependence (Table 6)is given in Figure 6.
Fig. 6. The chart of dependence of the parameter “Attitude to the Yabloko party” on the parameter “Attitude to G.A. Zyuganov”
Table 7. Dependence of the parameter “Attitude to V.V. Putin” (Y) on the parameter “Attitude to G.A. Zyuganov” (X) as comparative weightiness of the parameter Y for quarters on a
scale X Quarters on
the scale X the parameter Y for quarters Comparative weightiness of
X-4 -1388
X-1 -816
Factor of the connection strength = 0.57 (0.20) Coefficient of correlation = 0.22
The graph of dependence (Table 4) is given in Figure 4.
Fig. 4. The chart of dependence of the parameter “Attitude to A.A. Navalny” on the parameter “Attitude to G.A. Zyuganov”
[image:5.595.326.535.65.221.2]The pattern of relation resembles the previous one. Now, due to a more detailed solution of the problem, when the independent parameter is divided into quarts, two unequal areas can be identified. Initially, it is the near linear growth (from -816 to +857) of the dependent variable from quart 1 to quart 3 of the independent variable (related to the CPRF), and then the decline of the “Attitude to A.A. Navalny) at quart 4 of the independent variable, but up to the values (-69) that are much larger than the initial (-816) for quart 1.
Table 5.Dependence of the parameter “Attitude to G.A. Zyuganov” (Y) on the parameter “Attitude to the Fair Russia
party” (X) as comparative weightiness of the parameter Y for quarters on a scale X
Quarters on
the scale X the parameter Y for quarters Comparative weightiness of
X-4 -91
X-3 +579
X-2 +85
X-1 -1473
Factor of the connection strength = 0.59 (0.40) Coefficient of correlation = 0.22
[image:5.595.70.271.189.339.2]The graph of dependence (Table 5) is given in Figure 5.
Fig. 5. The chart of dependence of the parameter “Attitude to G.A. Zyuganov” on the “Attitude to the Fair Russia party”
[image:5.595.320.528.308.435.2]Below, we give the description of five dependencies of the discussed category:
Table 6.Dependence of the parameter “Attitude to the Yabloko party” (Y) on the parameter “Attitude to G.A. Zyuganov” (X) as comparative weightiness of the parameter Y
for quarters on a scale X Quarters on
the scale X the parameter Y for quarters Comparative weightiness of
X-4 +572
X-3 +31
X-2 +1883
X-1 -978
Factor of the connection strength = 1.14 (0.73) Coefficient of correlation = 0.29
[image:5.595.314.515.499.658.2]The graph of dependence (Table 6)is given in Figure 6.
[image:5.595.64.278.523.652.2]Fig. 6. The chart of dependence of the parameter “Attitude to the Yabloko party” on the parameter “Attitude to G.A. Zyuganov”
Table 7. Dependence of the parameter “Attitude to V.V. Putin” (Y) on the parameter “Attitude to G.A. Zyuganov” (X) as comparative weightiness of the parameter Y for quarters on a
scale X Quarters on
the scale X the parameter Y for quarters Comparative weightiness of
X-4 -1388
[image:5.595.325.524.721.773.2]X-2 +1591
X-1 -288
Factor of the connection strength = 1.06 (0.07) Coefficient of correlation = -0.08
The graph of dependence (Table 7) is given in Figure 7.
Table 8.Dependence of the parameter “Attitude to V.V. Putin” (Y) on the parameter “Attitude to S.M. Mironov” (X) as comparative weightiness of the parameter Y for quarters on a
scale X Quarters on
the scale X the parameter Y for quarters Comparative weightiness of
X-4 -141
X-3 +55
X-2 +1694
X-1 -448
Factor of the connection strength = 0.87 (0.28) Coefficient of correlation = 0.05
The graph of dependence (Table 8)is given in Figure 8..
Fig. 7. The chart of dependence of the parameter “Attitude to V.V. Putin” on the parameter “Attitude to G.A. Zyuganov”
Fig 8, The chart of dependence of the parameter “Attitude to V.V. Putin” on the parameter “Attitude to S.M. Mironov”
Table 9.Dependence of the parameter “Satisfaction with the voting results in the elections to the State Duma of the Russian Federation” (Y) on the parameter “Participation in the discussion of political issues in their environment” (X) as
comparative weightiness of the parameter Y for quarters on a scale X
Quarters on the
scale X Comparative weightiness of the parameter Y for quarters
X-4 +142
X-3 -275
X-2 +1794
X-1 +1098
Factor of the connection strength = 0.69 (0.77) Coefficient of correlation = -0.22
The graph of dependence (Table 9)is given in Figure 9.
Fig. 9. The chart of dependence of the parameter “Satisfaction with the voting results in the elections to the State Duma of the Russian Federation” on the parameter “Participation in the discussion of political issues in their environment”
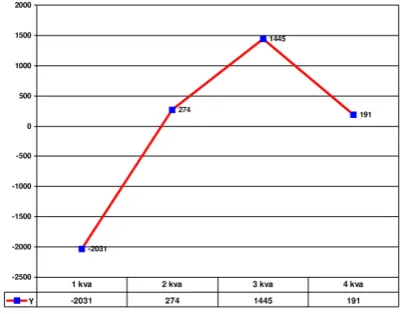
Table 10.Dependence of the parameter “Attitude to the Fair Russia party” (Y) on the parameter “Attitude to the CPRF party” (X) as comparative weightiness of the parameter Y for
quarters on a scale X Quarters on
the scale X the parameter Y for quarters Comparative weightiness of
X-4 +191
X-3 +1445
X-2 +274
X-1 -2031
Factor of the connection strength = 1.03 (0.54) Coefficient of correlation = 0.34
The graph of dependence (Table 10)is given in Figure 10.
Fig 10. The chart of dependence of the parameter “Attitude to the Fair Russia party” on the parameter “Attitude to the CPRF party”
The study of political preferences of young people also shows that a linear approximation in the data analysis leads to many substantial and methodological errors, which is unacceptable in scientific research, because contributes to a highly distorted view of the subject under study.
Although this is a “significant” correlation in traditional, but erroneous approaches to the interpretation of the correlation coefficient for a given sample size, the traditional researcher should interpret this dependence over the entire interval of change of the independent variable as a linear increase.
This is also the case for traditional erroneous approaches to interpretation of the correlation coefficient.
4.
D
ISCUSSIONWe have demonstrated the work of the authorial method for statistical relations analysis on the specific study data in political sociology, when emphasis is placed on studying the simplest non-linear relations (primarily these are dependencies with a maximum and minimum), and linear relations are identified as the particular type of dependencies.
This continues our research in the context of nonlinear nature with regard to social sciences (human sciences).
At the same time, the nonlinear nature of psychological and sociological data is not relevant for most researchers, although the nonlinearity of psychological and social has already been revealed in numerous studies [1, 3, 4, 5, 7, 8, 12, 13, 14, 15] with the help of the authorial method [2].
As previously mentioned [6, 9, 10, 11], a set of the so-called “significant” correlation coefficients is proposed to avoid the frequent statement of absence of the results in the study (except when a large number of related indicators are analyzed for relation). In the past, this mainly referred to a testing of hypothesis of zero correlation coefficient, i.e. the calculated correlation for a
sample transferred to the general population with a shift of zero point to the critical value determined by the sample size.
In this case, a very weak correlation (0.14-0.3), which is called “significant” (in module it is a larger table value within the null correlation hypothesis), is often interpreted as sufficiently strong and being of clear research interest, and the study of a corresponding component is considered to have achieved a positive result. The authors describe the linear cause and effect relation in such a situation which is actually weak or even very weak, but since it is “significant”, it is “the only” possible for them.
5.
C
ONCLUSIONThe problem of traditional research substitutions with consideration of linear “significant” relation both for the case of actual absence of relation (linear or simplest nonlinear) and for the cases of presence of strong simplest nonlinear relation is considered in detail also in previous articles of the author.
6. Acknowledgments [if any]
Preparation of the paper was supported by the grant of the Russian Foundation for Basic Research (RFBR). Project: № 18-011-01071а.
7. References
1. M. M. Basimov EpSBS. Non-linear nature of tolerance characteristic “Sensation of closeness to one’s family”. XXXV. pp. 145-155 (2017)
2. M. Basimov IJP. The analysis of statistical dependences in non-linear psychology. V51.S1. pp. 851 (2016)
3. M. Basimov IJP. Vanity in the system of requirements to the teachers profession (non-linear psychology).V51.S1. pp. 789 (2016)
4. P. Basimova IJP. Competitiveness as the reason Impulsiveness in non-linear psychology (Five-Factor Personality Model).V51.S1. pp. 903 (2016)
5. P. Basimova Commitment to Principles in Pedagogic Activity (non-linear aspect).V51.S1. pp. 789 (2016)
6. Y. Danilovu, Site of Sergei P.Kurdyumov,
Nonlinearity. Introduction to Synergetics. Retrieved from: http://spkurdyumov.ru/category/introduction (2016)
7. Y. Ilinyh IJP. Non-linear influence of severity on the lifemean orientations of the child. V47.S1. pp. 261 (2012)
8. Y. Ilinyh IJP. Non-linear effects in interaction “child-parent”.V47.S1. pp. 261 (2012)
10. V. Yu. Krylov Methodological and idealized problems of mathematical psychology. Moscow:Yanus-K. (2000)
11. K. Mainzer Thinking in Complexity. The Complex Dynamics of Matter, Mind, and Mankind. Berlin:Springer-Verlag (1994)
12. I. Nikolaeva Value characteristic "I" as object of non-linear psychology. AbstractBook "The 14th
European Congress of Psychology", Milan, Italy, 7-10 july 2015. pp. 784 (2015)
13. I. Nikolaeva Non-linear relation of durability and subjective remoteness from "Worst others".
AbstractBook "The 14th European Congress of
Psychology", Milan, Italy, 7-10 july 2015. pp. 785 (2015)
14. E. Padurina IJP. Non-linear influence of the gnostic emotional orientations on parental feelings.V47.S1. pp. 403 (2012)
15. E. Padurina Understanding of the reasons of a condition of the child as an object of non-linear psychology. AbstractBook "The 14th European