City, University of London Institutional Repository
Citation
: Dykes, J., Wood, J. and Slingsby, A. (2010). Rethinking Map Legends with
Visualization. IEEE Transactions on Visualization and Computer Graphics, 16(6), pp.
890-899. doi: 10.1109/TVCG.2010.191
This is the unspecified version of the paper.
This version of the publication may differ from the final published
version.
Permanent repository link:
http://openaccess.city.ac.uk/178/
Link to published version
: http://dx.doi.org/10.1109/TVCG.2010.191
Copyright and reuse:
City Research Online aims to make research
outputs of City, University of London available to a wider audience.
Copyright and Moral Rights remain with the author(s) and/or copyright
holders. URLs from City Research Online may be freely distributed and
linked to.
City Research Online:
http://openaccess.city.ac.uk/
[email protected]
Rethinking Map Legends with Visualization
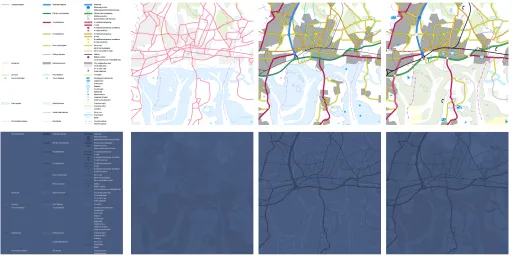
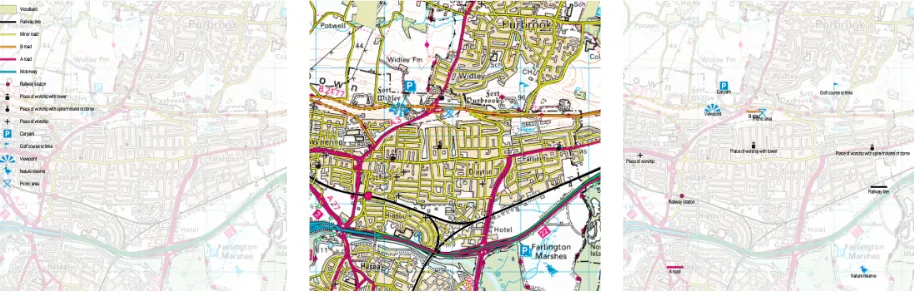
Jason Dykes, Jo Wood,Member, IEEE, and Aidan SlingsbyFig. 1.The Map is the Legend – Map Becomes Legend (Becomes Map...). Relationships between map and legend are explored in
Prototype 1with animated transitions between three ordered layouts:legend(1D categorical,left),map(2D geospatial,center) and
mapped legend(2D geospatial,right). c�Crown Copyright/database right 2010. An Ordnance Survey/EDINA supplied service. Abstract—This design paper presents new guidance for creating map legends in a dynamic environment. Our contribution is a set of
guidelinesfor legend design in a visualization context and a series of illustrativethemesthrough which they may be expressed. These are demonstrated in an applications context through interactive software prototypes. The guidelines are derived from cartographic literature and in liaison with EDINA who provide digital mapping services for UK tertiary education. They enhance approaches to legend design that have evolved for static media with visualization by considering: selection,layout,symbols,position,dynamism
anddesign and process. Broad visualization legend themes include:The Ground Truth Legend,The Legend as Statistical Graphic
andThe Map is the Legend. Together, these concepts enable us to augment legends with dynamic properties that address specific needs, rethink their nature and role and contribute to a wider re-evaluation of maps as artifacts of usage rather than statements of fact. EDINA has acquired funding to enhance their clients with visualization legends that use these concepts as a consequence of this work. The guidance applies to the design of a wide range of legends and keys used in cartography and information visualization.
Index Terms—Cartography, design, Digimap service, legend, online web mapping, visualization.
1 INTRODUCTION
Information visualization is concerned with spatial mappings of data that are not “inherently spatial” [29]. These should be “cognitively useful” when applied to well-defined tasks in combination with dy-namic and interactive techniques that support a process of data ex-ploration [29]. Yet the degree to which data, or the spatial mappings derived from them to amplify cognition, are “inherently spatial” is far from unequivocal. We explore this uncertainty to enhance map leg-ends specifically and spatial information visualization more generally. All cartographic projections transform data about positions on the Earth’s surface to a plane, resulting in the loss of important character-istics of space [54]. Some emphasize the aspatial aspects of data at the expense of geospatial properties for good reason [16, 56]. Equally, geospatial orderings in 1D (e.g. distance) and 2D can be usefully added to established mappings of aspatial data [11, 62]. The degree to which space is fundamental to information also varies across the map in its broadest sense. Wood and Fels [61] draw attention to theparamap– “the production surrounding a map” [34]. This consists ofperimap– including titles, photographs, illustrations and credits and theepimap
• Jason Dykes, Jo Wood and Aidan Slingsby are at the giCentre in the Department of Information Science, City University London,
E-Mail: j.dykes jwo sbbb717 @soi.city.ac.uk, Web: http://gicentre.org/. Manuscript received 31 March 2010; accepted 1 August 2010; posted online 24 October 2010; mailed on 16 October 2010.
For information on obtaining reprints of this article, please send email to: [email protected].
– accompanying articles, advertisements, marketing copy, letters and details on how the map was produced. This information has a power-ful role in conveying authority and affirming the status of the map as an objective reference object [61]. Certain elements of theparamap
have geographic characteristics that may be reflected through spatial mappings (cartography). In some cases spatial layout can be used to show aspatial relationships (information visualization), whilst other elements do not seem inherently spatial or would not benefit from spa-tial representation. Here we focus on an important component of the
perimap: the legend – a mapping of data that uses space and so ben-efits from methods from information visualization and cartography in which layout represents information or geospatial structure. We do so for four related reasons:
1. the legend is an influential component of theparamap[61]; 2. an effective legend seems key to acognitively usefulmap; 3. there is scope for using dynamism to achieve this;
4. cartography texts provide little guidance on theparamap[61].
and difficult to navigate when comprehensive.
Our objective is to explore possibilities for enhancing legends with visualization – to see whether cartography and information visualiza-tion can be effectively applied to generate novel and cognitively plau-sible mappings of the spatial elements of theperimap. We do so in the Digimap context by exploring visualization design opportunities for Digimap data sets and establishing affect. This is achieved through a phased study based upon aformalised informalapproach to multime-dia cartography praxis and evaluation [35, 36] in which participatory approaches are used to characterize the problem domain and determine
goals,formative evaluationis undertaken andimpactestablished.
Phase 1 – Imagination Exercise: tocharacterize the problem do-main by establishing context, exchanging ideas and data and identifying broad requirements; to develop broadly applicable
guidancefrom existing practice,themesthat inform design and
digital prototypesto demonstrate possibilities with data.
Phase 2 – Focussed Development: toevaluatethemes and their im-plementation in digital prototypes, establish more specific re-quirements and generate more focussed and functional digital prototypes with selected Digimap data sets.
Phase 3 – Impact: toevaluateviews of the Digimap team and poten-tial for incorporating visualization legends into their services.
2 PROBLEMDOMAINCHARACTERIZATION
Harrower contends that “Digital and Web cartography fails when we try to reproduce paper maps on-screen” [24] and calls for a creative approach to design. Keates [33] bemoans the tragedy of cartographers to failing to think beyond existing norms. We required creative think-ing on visualization and legends and promoted this through a struc-turedimagination exercise. The problem domain was explored in a dedicated workshop at EDINA. A loosely structured opening session allowed for lengthy discussion to ensure comprehensive common un-derstanding of the data, the user base and outstanding issues. ED-INA GeoSpatial Services and User Support (“EDINA”) described cur-rent approaches to legends and introduced data sets and user needs. Digimap clients, paper and digital prototypes that provide access to the comprehensive Historic, Geology and Ordnance Survey collections were presented and their characteristics and usage discussed. Existing Digimap legends have a dual role in supporting the visual interpre-tation of maps through lookup and as a means of map customisation by enabling the selection of data types for display. Discussions were manually transcribed in parallel by participants, collated and approved as an accurate and comprehensive record.
The creative activity began with a refresher session in which infor-mation visualization examples were presented to prompt discussion. The intention was to stimulate broad and creative thinking by distanc-ing the group from existdistanc-ing Digimap legends and ideas, whilst demon-strating the scope of visual solutions. Data collection followed with three participatory exercises to establish views on Digimap legends.
2.1 Current Problems and Successes
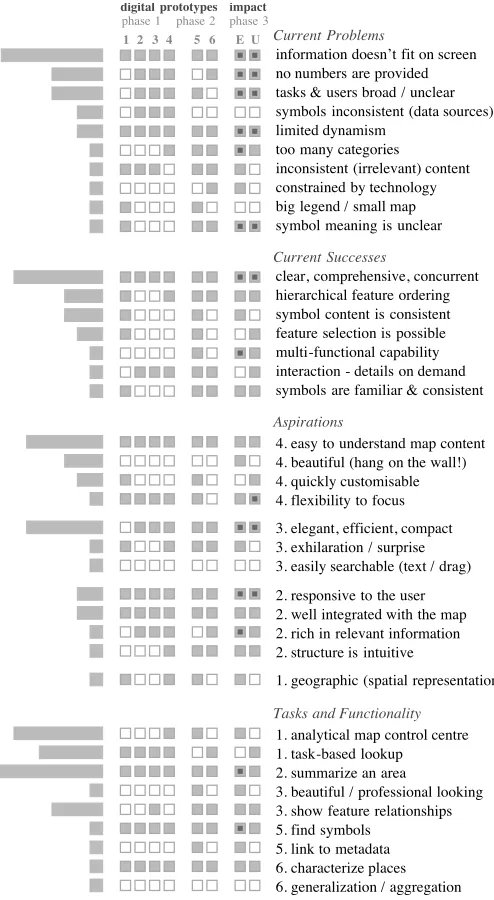
Existing services were the initial focus with the seven participants recording problems and successes associated with the current clients on sticky notes. Participants were asked to highlight the most sig-nificant of their responses and report this characteristic to the group, drawing attention to the scope of issues, common ideas and ensuring buy-in from all members. The twenty-five responses were retained with closely related issues subsequently grouped into ten response sets. Each was allocated an indicative name, such as “Information doesn’t fit on screen”, which contains 7 items (Fig. 2) including “You can’t see all the information – doesn’t fit on screen and is difficult to locate / remember”.
Positive legend characteristics were recorded, shared and aggre-gated through a similar process. Eighteen notes were allocated to seven response sets (Fig. 2). The most popular of these contained 7 responses including “The maps have legends! They are clear, com-prehensive and visible concurrently alongside the map”. This set was labelled “clear, comprehensive, concurrent” (Fig. 2).
digital prototypes
phase 1 phase 2 phase 3 1 2 3 4 5 6
impact
E U Current Problems
information doesn’t fit on screen no numbers are provided tasks & users broad / unclear symbols inconsistent (data sources) limited dynamism
too many categories
inconsistent (irrelevant) content constrained by technology big legend / small map symbol meaning is unclear
Current Successes
clear, comprehensive, concurrent hierarchical feature ordering symbol content is consistent feature selection is possible multi-functional capability interaction - details on demand symbols are familiar & consistent
Aspirations
4. easy to understand map content 4. beautiful (hang on the wall!) 4. quickly customisable 4. flexibility to focus
3. elegant, efficient, compact 3. exhilaration / surprise 3. easily searchable (text / drag)
2. responsive to the user 2. well integrated with the map 2. rich in relevant information 2. structure is intuitive
1. geographic (spatial representation)
Tasks and Functionality
1. task-based lookup 2. summarize an area
3. show feature relationships 1. analytical map control centre
5. find symbols
6. characterize places
3. beautiful / professional looking
5. link to metadata
[image:3.612.313.560.48.498.2]6. generalization / aggregation
Fig. 2.The Problem Domain – Responses, Emphases and Impacts. Aggregated sets of responses established during the problem domain characterization workshop are mapped to stages of the process. Rows relate to response sets with indicative names (right) and bars (left) showing numbers of responses. Square symbols in three groups of columns relate tophase 1prototypes,phase 2prototypes and reported
impactson the EDINA ’E’ team and Digimap users ’U’ established in
phase 3(as reported insection 7). Gray squares show associations, with dark dots representing strongphase 3impacts.
2.2 Aspirations
2.3 Tasks and Functionality
Finally we asked participants to identify up to four important tasks that Digimap legends should support or functionality that they should ex-hibit. Participants were then allocated to one of two discussion groups. Responses were presented to the group and aggregated into categories according to broad themes that emerged through discussion. Thirty characteristics were suggested and aggregated into twelve categories (six for each group). These were named and prioritised by group mem-bers as detailed in Fig. 2. The results for both groups are combined in Fig. 2 where bar length shows how often a theme was identified and the numbers show the highest priority amongst groups.
3 LEGENDDESIGN
Established guidance on legend design is very general, with occasional examples [53] and alternatives [13], but few principles – perhaps be-cause it is difficult to generalize between use cases and experimental contexts. As in cartography more generally, legend design seems to rely on a subjective evaluation of design options informed by experi-ence, preference and knowledge in the context of particular use cases: “cartographers must rely on their best judgments” [15].
The focus is predominantly on static cartography but Lobben and Patton include a short section on legend design in their “Design Guide-lines for Digital Atlases” [40]. The suggestions are surprisingly con-servative, recommending replication of static legends or the use of symbols that reveal text when interrogated. The former of these seems to contradict their earlier advice on ensuring graphic simplicity for maps that are designed for computer screens and is challenged by Har-rower [24] who draws particular attention to the need to minimise the degree to which users divide their attention between map and legend.
A review of 47 cartographic texts, papers and digital resources leads us to propose broad guidelines relating to six high-level characteristics for consideration in visualization legend design.
3.1 Selection – What to Include?
Only show relevant information – include just what is required. Our domain characterization emphasized the cartographic tendency for comprehensive legends. However, effective selection of content will minimise cognitively expensive look-up tasks and reduce the ex-tent to which atex-tention is divided between map and legend. It can be achieved by limiting to “all unknown or unique symbols used” [15], those that are “not self-explanatory” [53] or items “critical to reading the map in question” [48]. Relevance changes over time, and accord-ing to task and user – thus requiraccord-ing careful consideration. Visual methods may be useful to highlight selected and de-emphasize non-selected items through binary or continuous symbolism. Updates may be appropriate where legends are dynamic and visual de-emphasis may maintain legend stability where selection changes. Input from the user and system use may be effective in determining what is required. Evi-dence suggests that legends are not necessary amongst some users for some map tasks and a situation with no look-up and no legend may sometimes be a viable and effective objective [2].
3.2 Layout – How to Use Legend Space?
Reflect meaningful geospatial or attribute structure by arranging legend symbols in a relational manner.
Legend layout “is worthy of careful attention” [48] and should exhibit “visual logic” [13] and “visual balance” [48] so that symbols are un-ambiguous, harmonious with the map and clear [15]. This may be achieved through 1D ordering of legend items [48] or more sophisti-cated use of the space. 2D layouts that represent information structure have been shown to be effective in some circumstances [2, 14], sug-gesting that improvements in performance may result where the di-mensionality of a legend concurs with the didi-mensionality in the data. MacEachren [41] explains in terms ofschemata– elements of long-term memory used to organise knowledge and frame future under-standing. For example, the abstract notion that closer in space means closer in kind is a spatial schema used advantageously in cartography and information visualization [50, 51]. Any visual description of in-formation, such as a map or legend, will rely upon both the graphic
itself and the schemata used to view it – particularly in terms of their appropriateness and completeness. Interpretations of legends are con-sidered as specific map schemata: “For cartographers and readers to share interpretants for specific signs requires a common understand-ing of how sign-set variation is matched to data set variation and/or an explicit definition for a sign relationship” [41].
Legends that reflect the nature of relationships in the data are thus likely to be most effective [41]. Aspects of layout may do this effec-tively through image schemata, which include center-periphery and containment: “While legends typically employ linguistic codes to pro-vide a link to propositional knowledge representations, presentational codes can also be used to link with analogical knowledge representa-tions and image schemata” [41].
Ordering legend items consistently with lower values at the bot-tom and high at the top [48], natural legends [14], and 2D legends [2, 3] may meet these criteria. Considering the planar dimensions as mappable space into which information that contains 1 and 2D orders, hierarchical relationships and categorical differences may be produc-tive – for example to represent category, age and regional variation in a geology map legend [22]. Doing so may also lead to new ideas for improved legends that are based upon image schemata. The container schema is not used frequently in legend design, but as an embodied image schema that is considered by some to have inherent meaning [38, 41] it may be effective when used in legend layout.
In short we recommend the legend be considered as a spatial representation of information and thus the relative positions of ele-ments should be of primary concern as they are when developing a map or less inherently spatial graphic. Recent cartographic literature makes useful recommendations about visual groupings, meaningful metaphors and effective use of text [4, 53].
3.3 Symbols – How to Represent Features?
Symbols in the legend must relate directly to those used on the map. Legends should be consistent with the maps they support. Symbols should relate: directly to the map with identical characteristics [48, 53]; to each other (see section 3.2 above); to the mapped phenomenon of interest; to social and cultural expectation. Some evidence suggests that where quantitative estimation tasks are important, displaying a range of values may be effective in overcoming the non-linear nature of perception [12]. In such cases the zero lookup or empty legend objective may not apply and advice on representation is available [30]. Emerging technologies and contributed geo-referenced data sources provide scope for innovation in terms of using ground truth to relate maps and legends to mapped phenomena [8].
3.4 Position – Where or When to Show Legends?
Ensure that when, where or how a legend is encountered, is task ap-propriate and matches expectation.
The position or availability of the legend may vary according to prior knowledge, task and cultural expectation or norm but should be a key element of design. In the case of bivariate legends or unfamiliar sym-bolism it has been argued that the legend should be seen before the map [48]. When legends are expected to be used less frequently and as map use continues, this primacy may become less necessary.
3.5 Dynamism – Which Interactions and Animations?
Supplement information and vary legend characteristics in informa-tive and relevant ways.
Dynamism can overcome some issues associated with alternative de-sign decisions and change. In dynamic environmentsselection,layout,
symbolsandpositioncan be varied to emphasize relationships and suit situation, task and user. For example:
• varyingselection– by geography, attribute, choice or experience:
symbol transparency[49] may be used effectively here; • varyinglayout– to reflect different orders of and relationships
between symbols: if layout changes then it must be clear why the change has occurred and what it represents;
Concepts and approaches useful in implementing these guidelines in-cludethe active legend[46, 49],bi-directional highlighting[49],smart legendsacting as acentral control unit for the map [49], animated transitions[28] and the application ofstyles[10, 31, 32, 43].
3.6 Design and Process – How to Proceed?
Design the legend as you would a map or data graphic – consider the legend as (spatial) information visualization.
Overall legend design is an informed trade-off that should be under-taken in close association with map design using appropriate design principles. The cartographic literature lists various characteristics that are indicative of good legend design that might be considered as aes-thetic and relational qualities. Aesaes-thetic qualities includeharmony,
visual balance,clarity, and legends that arein keeping with the map. Relational qualities includevisual logic,logical groupingsand unam-biguous encoding. We might add functional qualities, which are re-lated and the subject of various experiments (e.g. [2, 12, 14, 20]).
These guidelines emphasize the informed and effective use of lay-out in legend design. As such, approaches used in information visual-ization and cartography are applicable. The seven controls on the map design process may be a helpful starting point for spatial legends: pur-pose;reality(and mapped reality);available data(and its selection or omission in the map); (map)scale;audience; conditions of use;
technical limits(and opportunities?) [48]. The information visualiza-tion literature also contains a wealth of relevant knowledge with recent indications that interactive legends have positive effects in certain cir-cumstances [47]. Ultimately, design relies on a cartographer’s judg-ments in the light of experience and consideration of use. A creative and open approach is important throughout the process [7, 24, 33, 42]. Continual reflection, discussion, task-based evaluation and redesign should be applied [35] as the designer “edits vigorously” [4].
4 LEGENDTHEMES
Our characterization of the problem domain and development of de-sign guidelines provided impetus for a creative exercise in which broad visualization legend themes were developed to frame ideas and guide software development. Each describes a novel perspective on the leg-end that can be used with the guidelines to address the problem do-main. Themes are neither comprehensive nor mutually exclusive and may be used individually or in combination to inspire visualizations.
4.1 The Map is the Legend
The roles of map (spatial representation of geographic setting) and legend (spatial representation of map content and symbols) are blurred in this theme that emphasizes spatial layouts.
No Legend– Must a map always have a legend? If symbols are known or map tasks do not require precise identification or ac-curate estimation then expensive map-to-legend references may be removed by omitting the legend – the map sufficing as an in-dicator of content. The omission of many known symbols from existing legends (see [60]) could be extended to zero selection if all symbols were known or “self-explanatory” [53]. In a dy-namic environment details on demand [40] may suffice and limit the risks associated withno legend. They may also limit the in-terruptions associated with look-up assumed by the literature on (static) cartography. Transient legends are used in a number of Digimap clients and offer possibilities.
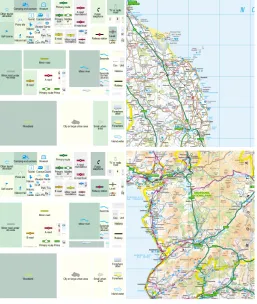
Map Section– Legends with 2D spatial ordering.Natural legendsof topography, annotated and stylized indicative map sections re-lating symbol and referent, have significant positive effects for some tasks [14]. This approach is used to an extent by the Ord-nance Survey in their paper map legends [44] (Fig. 3) and by Digimap with marine data sets. In both cases the features used tend to occur in broadly linear arrangements. A stylized labeled 2D map section is a viable and effective alternative [14].
Map Becomes Legend (Becomes Map...) – A dynamic map that transforms from map to legend and vice versa may help relate
650
600
Ferry P Ferry V
A 493 B 4518 B 885 A 855 S 1 M1
L
:
50 144 t E ( WV V V
[ ] {
X
\
`
Ù
l
A 470 LC a o Not necessarily rights of wayROADS AND PATHS
Elevated Junction number Service area Footbridge Unfenced Dual carriageway Bridge Primary Route
Motorway (dual carriageway) Motorway under construction Main road
Primary Route / Main road under construction Secondary road
Narrow road with passing places Road generally less than 4m wide Path / Other road, drive or track Gradient: 20% (1 in 5) and steeper, 14% (1 in 7) to 20% (1 in 5) Gates / Road Tunnel
Ferry (passenger) / Ferry (vehicle) Road generally more than 4m wide
RAILWAYS
Level crossing Bridges / Footbridge
Tunnel
Track multiple or single Track under construction
Light rapid transit system, narrow gauge or tramway
Station, (a) principal
WATER FEATURES Bridge Canal Towpath Aqueduct Lake
Weir Normal tidal limit Footbridge
Canal (dry)
Cliff Slopes
Marsh or salting
Lock Flat rock Sand Dunes Ford Mud Shingle Beacon Lighthouse (in use) Lighthouse (disused)
Low water mark
High water mark
HEIGHTS 1 metre = 3.2808 feet ROCK FEATURES
Contours are at 10 metres vertical interval Heights are to the nearest metre above mean sea level Heights shown close to a triangulation pillar refer to the ground at the base of the pillar and not necessarily to the summit.
Cliff Scree Outcrop Coniferous wood Non-coniferous wood Mixed wood
Orchard / Park or ornamental ground Quarry
Spoil heap, refuse tip or dump
National Trust-always open
National Trust for Scotland Forestry Commission access land
National Trust-limited access, observe local signs Wind pump / wind generator Chimney or tower Glass structure
Graticule intersection at 5’ intervals Heliport
Triangulation pillar
Windmill with or without sails Mast
Place of worship
with tower
with spire, minaret or dome without such additions Electricity transmission line (pylons shown at standard spacing) Pipe line
(arrow indicates direction of flow) Buildings
Public building (selected) Bus or coach station
LAND FEATURES
ruin
OS Landranger
®(1:50 000 scale)
Map symbols
Siding
Light rapid transit system station
Viaduct
Cutting / embankment
[image:5.612.309.563.51.129.2]www.ordnancesurvey.co.uk/mapzone
Fig. 3.The Map is the Legend – Map Section.
An extract of the OS Landranger 1:50,000 map symbols sheet [44] con-taining a natural legend. Features are arranged in a linear fashion to show indicative but fictitious geography. c�Crown Copyright 2002.
symbol and location effectively and reduce lookup activity by removing the need to separate the representation of map and leg-end. Smooth animated transitions [28] may be beneficial. An-imating symbol locations between positions that are geospatial, spatially indicative and those that relate to aspatial feature char-acteristics such as order and hierarchy addresses this theme in an innovative way (Figs. 1 and 9).
4.2 The Legend as Statistical Graphic
A graphical statistical summary of current map content and a dynamic query filter for map exploration.
Layout and dynamism can be combined effectively to develop ac-tive legends[46] whereby graphical statistics summarise current map content and act as a query filter orcontrol center[49]. Map explo-ration is supported by linking views withbi-directional interactions
[49]. This theme provides scope for a variety of 1 and 2D uni and bi-variate statistical graphics [19, 37] and draws upon a rich tradition of combining alternative views of data for exploration through dynamic linking (e.g. [1, 17, 26, 27]). Interface elements containing graphically encoded information may be appropriate [59]. Requirements for ex-ploratory data analysis software [57] should be considered to support typical queries discussed at our workshops such as: Are there more A or B-roads on this map? Where are the museums? What type of landcover do windmills occur on? Does this vary in different places?
4.3 A Legend of Legends
Alternative styles are displayed and related using layout.
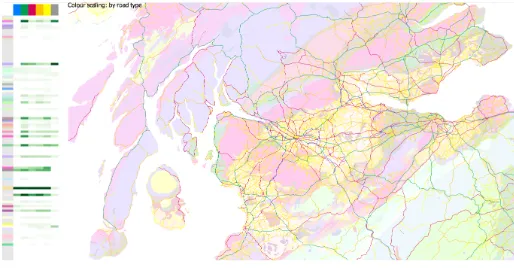
The emergence of alternative symbolism schemes for maps through expert systems [31] or crowd sourcing [10] poses an additional issue: how do we produce a legend of legends? Furthermore, in the context of the advice proffered here, how do we spatially arrange, ormap, these legends? Maps of symbolism styles arrange alternatives spatially so that users can relate and navigate between alternative symbolism sets (Fig. 4) according to relevance determined by preference [10], usage, scale or geography [32].
4.4 The Relevant Legend
Selection includes only what is required, varying as this changes.
Relevance is a key concept in consideringselectionandlayout. This changes over time, according to data and with use and user. The Rel-evant Legendshows only what is required. A geospatiallyRelevant Legendshows only what is on the map and addresses a common user concern raised directly during our workshops: “I don’t want a legend that is showing things that are not on the map”. A dynamic implemen-tation updates continually.
Fig. 4. The Legend of Legends. Legends for three levels of feature classification (left) and associated sets of maps (right) are shown for two contrasting styles (topandbottom) inPrototype 5. Either of the legend tripletsleftcan be considered aLegend of Legendsand could be used for selecting levels of aggregation. Any vertical pair of maps (right) can be considered aLegend of Maps. These or the vertical pair ofLegend of Legendscould be used to select styles. c�Crown Copyright/database right 2010. An Ordnance Survey/EDINA supplied service.
Fig. 5. The Legend as Statistical Graphic – Hierarchy. Three legend / map pairs show bedrock geology for the United Kingdom inPrototype 4. Areas on the legend relate to areas on the map for era (left, center) and lithology (right). The legend can be interactively reordered to show chronological (left), geospatial (center, right) or attribute orders at and for each level of the attribute hierarchy.
Based upon 1:625K DiGMapGB with the permission of the British Geological Survey.
Pop Legend– Legend items are selected and arranged according to user community usage or needs.A legend in whichselectionand
layout(order) depend upon symbol usage (by recency or partic-ular users and groups) may be useful. Mapping Digimap usage would allow frequently selected, included or interrogated sym-bols to be explored and may help identify those that are relevant:
What do people map or look-up?
Spatial selection by popularity might be effective in some cir-cumstances [21]:Where do people download or map?
My Legend, My Map– Content, layout and order are controlled and saved by individuals or groups as required according to task, knowledge, location or symbolism. Users vary a range of map and legend characteristics to address the issues of relevance and knowledge associated with effective legend design. These in-clude selection of features, feature classes (with possible aggre-gation or disaggreaggre-gation - see Fig. 5,center, right), geographic
location, legend structure or layout (see Fig. 5,left, center), leg-end position and symbolism or style (see Fig. 4).
The Paint-Box Legend– Symbols are dragged from a comprehen-sive legend on to the map. This approach may be beneficial in the learning and teaching context. APaint-Box Legend might be used to find areas containing features, or groups of features relating to symbols or groups of symbols. Symbol combina-tions could be used to identify areas where features co-occur: e.g.Where do windmills and lighthouses occur?
The Shopping Basket Legend– Symbols are dragged from the map into a legend area when needed [49]. A teacher could use a
Shopping Basket Legendto create a subset of items from which students could create maps with aPaint-Box Legend.
[image:6.612.55.567.360.511.2]4.5 The Source Independent Legend
Data are integrated from multiple sources with conflicts resolved. Sources are identifiable but items grouped by other characteristics.
Legends frequently integrate data from multiple sources, the Digimap Carto and ROAM clients are examples with scales vary-ing across the Ordnance Survey collection. Feature classes, defini-tions and levels of uncertainty may differ between sources in a single ‘mashed-up’ map. TheSource Independent Legendaddress such con-flicts in a seamless and elegant manner, perhaps through hierarchical ordering. Origin should be evident in the legend but symbols should be distinguishable and grouped according other characteristics – such as feature class, task, users’ knowledge, popularity of use, or others. Varying imposed (false) hierarchies can help explore structure in a data set [52] and this approach may be relevant here.
4.6 The Ground Truth Legend
Symbols are augmented or replaced with (local, community con-tributed) imagery. The user community could determine relevance.
In traditional legends the relational link is between symbol and map. Various online communities provide access to geo-referenced imagery that could be used to augment the links between location and reality afforded by traditional symbolism. A number of sophisticated and spatial designs use imagery in this way [8, 18, 23]. The theme could be enhanced by community contributions – with images tagged according to the degree to which they are representative of particular features or places. Queries that might be answered include:
Is there a photograph of this [feature]? What does this [feature] look like?
Do all the [features] around here look the same? Where is the nearest photograph of this [feature]? Where are the most typical [features]?
Requests could also be combined:
Where do typical cases of [feature1] occur
near totypical cases of [feature2]?
Most of these questions could be usefully asked and answered both locally and globally to encourage consideration of spatial variations.
5 DIGITALPROTOTYPES: IMAGINATIONEXERCISE
The themes were used to design visualization legends for core Digimap data sets identified in characterizing the problem domain. Four initial prototypes (numbered 1-4) were presented to EDINA along with the guidelines and themes to demonstrate possibilities, communicate ideas and elicit further feedback in ways that are only feasible with tangible artifacts containing real geospatial data [39]. Each prototype is dominated by a particular theme, and named ac-cordingly, but influenced by others (Fig. 6). Variations on a theme are differentiated by graphic type. Characteristics of the problem domain addressed by each prototype are tabulated in Fig. 2. The accompa-nying movie details the dynamic functionality of each prototype and should be consulted in conjunction with these static figures.
5.1 The Map is the Legend
We use this theme to explore the relationships between geospatial and aspatial graphics of geographic information with three alternative combinations of layout and selection for legend items (Fig. 1). The idea is to create a legend that is as familiar as possible to users and yet to take advantage of alternative layouts that are available in a dy-namic medium. Prototype 1uses the1:50,000 Scale Colour Raster Landrangerfor a 20km2tile with a broad range of inland and coastal features (SU60). Vectors were acquired from theOS Meridian 2 prod-uct. Feature locations within the selected area were manually digi-tized from Landranger to relate locations with symbols and symbol categories supplied by EDINA.
Thelegendview consists of a 1D ordered layout with a single case of each feature (Fig. 1, left). This transforms into a map– a 2D geospatial layout of all features (Fig. 1,center). A third layout, the
mapped legendis a 2D geospatial ordering with a single case of each feature at an indicative location (Fig. 1,right). These are randomly se-lected in our prototype, but our emphasis on the importance of layout
digital prototypes phase 1 phase 2
1 2 3 4 5 6 Themes Addressed
The Map is the Legend The Legend as Statistical Graphic A Legend of Legends
The Relevant Legend The Source Independent Legend The Ground Truth Legend
Data Sets Used
OS 1:2,500 MasterMap
OS 1:50k Scale Colour Raster (Landranger) OS 1:50k Vector Features (Meridian) OS 1:250k Vector Features (Strategi) OS 1:250k Scale Colour Raster
[image:7.612.321.544.51.212.2]BGS 1:625K Onshore Bedrock Mapping (DiGMapGB)
Fig. 6.Themes and Data Sets Used in Developing Prototypes. The matrix shows associations (influenced by/demonstrates) between theme and prototype (top). Gray squares show associations, dots dom-inance. Data sets used in each prototype are also recorded (bottom).
suggests that locations should be selected in more meaningful ways. Smooth transitions animate between each view to relate locations in geographic and attribute space. Selection updates as geospatial extent is varied through zoom and pan.
5.2 The Legend as Statistical Graphic – Bar Chart
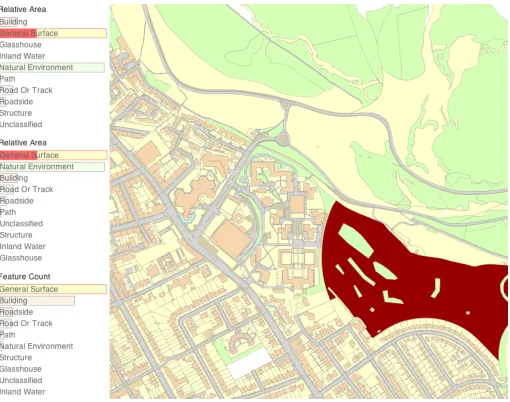
Areal features and associated descriptive groups are the focus of Proto-type 2, which uses a subset of theOS MasterMap Topographic Layer. This high-resolution vector mapping product partitions Great Britain into just under half a billion tessellating polygons corresponding to buildings, fields and the geometry of roads and paths. Dynamic leg-end symbols summarise features in the current map view through aBar Chart(Fig. 7). The planar coordinates of the legend show all feature classes displayed in the map with a magnitude (horizontal axis) relat-ing to some statistical attribute of the class (e.g. number [37], area, perimeter). Bars are ordered by an appropriate characteristic (
verti-Fig. 7.The Legend as Statistical Graphic – Bar Charts.
Bar charts (left) inPrototype 2show characteristics of an area selected with zoom and pan (right). Feature areas (top, center) and counts ( bot-tom) are shown, with vertical ordering by alphabet (top) and magnitude (center, bottom). Bi-directional highlighting allows symbols or features to be selected on demand with linked views. c�Crown Copyright/database
[image:7.612.310.565.465.666.2]cal axis). Map and statistical graphic exhibit consistent bi-directional interactions for selection and highlighting. Bar orders and lengths update during navigation. The concurrent use of feature class label and statistical graphic could be considered a ‘scented legend’ after the ‘scented widgets’ of Willettet al.[59].
5.3 The Legend as Statistical Graphic – Matrix
We compare features of different geometry from different sources in
Prototype 3where geology and road data are combined in an interac-tive statistical graphic (Fig. 8). The BGS Rock Lexicon recorded in
DiGMapGB[6] is used to classify the geology. This 1:625k data set contains onshore bedrock polygons with information about rock age and type. Road features are fromOS Strategi, a vector version of the
1:250k Scale Colour Rasterthat contains feature type, point and line geometry and a rich set of attributes for roads, rivers and points of interest (see section 6).
A dynamic 2D visualization legend shows a feature class from one of the sources in each dimension (Fig. 8, left). These are ordered by an appropriate characteristic: age in the case of bedrock (vertical) and capacity for roads (horizontal) and shaded to show co-occurrence. Secondary visual variables are used to show quantity in a heat map [58] – in this case the degree to which legend elements co-occur ge-ographically in the current map. Interactions relate visualization leg-end and map with mouseover-invoked details on demand supporting lookup tasks. This example shows ‘line in area’ relationships as re-quested in our workshops, but for data sets with limited likely asso-ciation in this case. The approach is applicable to other data sets and relationships including: point in area, point within distance of line, and point within distance of point. Different configurations of layout and symbolism in the legend could transform the matrix into a mosaic plot or fluctuation diagram. Dynamic functionality such as feature class re-ordering and aggregation could be applied within this theme.
5.4 The Legend as Statistical Graphic – Hierarchy
Prototype 4consists of a dynamic, spatial legend in which the geo-graphic and hierarchical nature of the national bedrock geology classi-fication (seesection 5.3) is depicted through a 2D spatial treemap [62]. We built a 6-level classification hierarchy from the four hierarchical geological timescale units ofEon,Era,PeriodandEpoch, followed by the BGS Rock Classification Scheme (RCS) and the BGS Rock Lex-icon entry (LEX). Established color schemes were used for the latter two levels [5]. We allocated ColorBrewer [25]Set1, Set2andSet3
[image:8.612.53.310.506.640.2]schemes toEon,EraandPeriodand random colors to the 30Epoch
Fig. 8.The Legend as Statistical Graphic – Matrix.
A matrix legend allows co-occurring features to be explored inPrototype 3. Here the matrix shows bedrock (vertical) vs. roads (horizontal) with colors indicating relative co-occurrence for each road type (column). Al-ternative scalings by bedrock (row) or global values (area) are available. The matrix values update as the map is navigated with zoom and pan. Bi-directional highlighting relates map and legend with textual details provided on demand. c�Crown Copyright/database right 2010. An Ord-nance Survey/EDINA supplied service. Based upon 1:625K DiGMapGB with the permission of the British Geological Survey.
categories. In Fig. 5 the treemaps are at the level ofEra(left, center) androck lexicon(right). Chronological (left) and geospatial (center, right) layouts of legend categories are shown hierarchically. The leg-end can also be ordered byarea. Other 1 or 2D orders could be added – relevance ordering would address theRelevant Legendtheme. Smooth animations are used to transition between layouts. Bi-directional in-teractions relate map and legend with details on demand supporting lookup tasks – any category being selectable in map or legend.
6 DIGITALPROTOTYPES: FOCUSSEDDEVELOPMENT
APossibilities Reportcontaining the legend guidelines and themes, along with the four initial prototypes demonstrating how these could be applied imaginatively to Digimap products, formed the basis of a second round of more focussed discussion. The objectives of the
imagination exerciseinvolved collectively exploring and communicat-ing possibilities and generatcommunicat-ing more specific requirements for further development. Responses were positive. Discussion about the ideas and their applicability to the various data holdings and utility to user groups was broad initially, but constructive and animated – the pro-totypes stimulated plenty of ideas. EDINA suggested various ways of applying the themes in a variety of use cases with a range of additional data sets, demonstrating their utility in communicating possibilities. These included a wireframe ofThe Ground Truth Legend with com-munity contributed styles and locally relevant photographs. EDINA took time to evaluate the possibilities before establishing priorities for more constrained and functional prototypes. These included:
• a focus on theStrategidata set [45];
• applying 2D layouts to the richStrategifeature class hierarchy; • enhancing prototypes with styles, layout options and more
fea-tures for bi-directional interaction.
OS Strategifeature descriptions are very specific (e.g.Motorway, un-der construction) and we used EDINA’s existing interpretation of the three-level Ordnance Survey hierarchy [45] to group features with 8, 46 and 210 categories at each level. Two of the digital prototypes were enhanced accordingly in line with the design guidelines.Prototypes 5 and 6resulted and are illustrated in Figs. 9 and 10 and through the accompanying movies.
6.1 The Map is The Legend – Strategi
We appliedThe Map is the LegendtoStrategiand further spatialized the legend view with 2D ordered layouts containing a single case of each feature structured according to feature class. Navigation through the legend hierarchy inPrototype 5is supported through interactive controls to select levels. The richer feature set required a number of design issues to be considered. The traditional legend no longer fit-ted on screen if viewed with a large (familiar) font and a number of features selected. Interactive controls over item size and spacing were added to provide a continuum between ‘visible’ and ‘not visible’ de-pending on the importance of the legend view at any time. To reinforce the continuum between map and legend views, togglable feature class selection and highlighting was added in all views to allow features to be selected geospatially or thematically (see Fig. 9). Multiple legend orderings reinforce the notion that the traditional legend is simply one of many possible views of the data. Three orderings are available: by theme, alphabet (for finding a symbol of known named type) and drawing order (related to theStrategifeature code order). Other orders are possible, for example to addressThe Relevant Legendtheme.
Fig. 9.The Map is the Legend – Strategi. Symbols move between geospatial and thematic layout inPrototype 5. The map-to-legend transition is shown for the all features (top) and a selection (bottom). c�Crown Copyright/database right 2010. An Ordnance Survey/EDINA supplied service.
Fig. 10.The Legend as Statistical Graphic – Strategi.
InPrototype 6, containment reflects the hierarchy of point, line and area features inStrategi. Legend symbols show relative occurrences for each geometry type through size (national) and color (local). The area south of Berwick (top) is characterised by level crossings, minor roads and rivers and foreshore features in comparison to the Barmouth area ( bot-tom) where coastline and railway stations feature more than at national level. Camping sites are expected in coastal regions with low propor-tions of urban area but the predominance of picnic sites and trails in one location versus museums and golf courses in the other suggests differ-ent functions and recreational possibilities. Raster maps are generalized inPrototype 6to ensure rapid response. c�Crown Copyright/database right 2010. An Ordnance Survey/EDINA supplied service.
6.2 The Legend as Statistical Graphic – Strategi
InPrototype 6the treemap legend acts as a 2D statistical graphic show-ing Strategi feature occurrence for three feature geometries at two geospatial extents: nationaloccurrence with areas relating to counts, total length and total area for point, line and area features respectively; andlocaloccurrence through color schemes showing relative frequen-cies for each geometry in the current view (Fig. 10). 2D ordering in the legend emphasizes different characteristics of the global data set or the local selection including: geography, occurrence, relevance. Point count, line length and area are not directly comparable characteristics of features with varying geometry – the same area is thus allocated to each geometric type in the default treemaps. Features in the treemaps can alternatively be sized equally, as in conventional legends, or ac-cording to local occurrence. These different orderings and emphases may draw attention to particular characteristics of the area summarized by the legend and address or inspire particular research questions [52]. Animated transitions morph between views whenever layout changes. Map and legend are closely linked and highly interactive with the leg-end updated according to geospatial selection through zoom and pan.
7 IMPACT
This study involved ongoing communication between the designers and EDINA. Feedback was regular and largely informal. Reactions at a third workshop toPrototypes 5 and 6were very positive and some-times effusive: “Even my Mum would understand that!”
In line with theformalized informalapproach to cartographic praxis [35, 36] we solicited views on the degree to which the Digimap visual-ization legends had achieved impact in EDINA. A lightweight evalua-tion structured responses around the issues identified in domain char-acterization (Fig. 2). Two key contacts at EDINA were asked to con-sider whether the two-phase process ofImagination Exerciseand Fo-cussed Developmenthad or were likely to have avaluable impacton:
• them as individuals– through their thinking about legends • the service– through plans to deploy any knowledge acquired Responses are summarized below and in Fig. 2 where designers’ inten-tions for each of the six prototypes are listed against reported impacts.
7.1 Current Problems and Successes
[image:9.612.47.304.306.610.2]the high ranking successes and problems, indicating that the exercise enhanced the way in which clear, comprehensive and logically struc-tured legends are applied to Digimap data in limited screen real estate. The case of too much space being given over to legend at the expense of map is the only issue in which the prototypes were designed to have an impact, but none was recorded – an ongoing priority.
7.2 Aspirations
A valuable impact on achieving aspirations was reported, with par-ticular emphasis onelegance,flexibility,richnessandresponsiveness
(Fig. 2) – key characteristics of the information visualization approach emphasized in our designs. The issue of text-related search was not ad-dressed. Whilst not originally identified as a high priority, our themes and guidelines provide scope for additional designs through which search could be supported. Aesthetic is important in cartography and has been shown to have a measurable effect on usability in informa-tion visualizainforma-tion [9]. Perhaps our most challenging aspirainforma-tion was to produce a solution “so beautiful [that] the user prints the legend and puts it on their wall!” Positive feedback on this was encouraging.
7.3 Tasks and Functionality
Responses to the impact evaluation emphasize the way that visualiza-tion legends summarize and characterize an area effectively in ways that static legends do not, show relationships between features and can help users find and relate symbols (Fig. 2) – key tasks associated with map use. The evaluators also indicated that visualization legends can make digital maps look more professional – an important role of the
paramapto which visualization can contribute. EDINA respondents did not report a valuable impact on their thinking about legends in terms ofproviding support for communicating symbol meaning across a range of tasks(task-based lookupresponse set in Fig. 2). They did however acknowledge a likely impact upon users of the service in lookup tasks through the planned adoption of the ideas.
7.4 Other Reactions
Views expressed in free text indicated that the exercise helped ED-INA investigate alternate approaches to visualization and consider how these might be applied in the various clients. The work was regarded as “inspirational” by one respondent who indicated that “Exciting times lie ahead”. The most significant achievements were deemed to be:
• the opportunity to think about legends in new ways and incorpo-rate these ideas in the new generation of mapping clients; • demonstration that legends can be more information rich and
functional by providing more than an explanation of symbol meaning and through higher levels of user interaction that sup-port a number of tasks involved in understanding data;
• raising awareness of possibilities for improving the presentation of other sorts of[aspatial]digital content delivered by EDINA.
The responses link closely to our objectives and the issues raised in establishing the problem domain. They can be considered as evidence of success. The first achievement is particularly important as EDINA has secured financial support for this activity on the basis of the value of the work undertaken – the Joint Information Systems Committee (JISC) is funding a 12-month service enhancement project to develop
Active Bi-directional Legendsin Digimap clients. This will include a newGeology Mapperand a plan for active legend functionality in other clients. EDINA regard this as “a major step forward for Digimap in approaching how we tackle legend visualization” and describe the visualization legend work as “making us realise that we had an ex-citing opportunity to do something innovative and beneficial both for the service and the user’s experience”. A satisfying outcome beyond the original scope of our rethinking exercise is the suggestion that up-grades to non-GeoSpatial EDINA services may result – supporting our contention that the work is of broad relevance.
Reporteddisappointmentsincluded operating within the technolog-ical constraints associated with national service delivery, the realisa-tion that legend visualisarealisa-tion in existing clients was lacking and the
time that will be needed to realize the ideas. Happily, the funding se-cured on the basis of the successes will help with some of these issues. Neither the inconsistency of symbolism between products and data of different scales, nor possibilities for aggregation / generalization func-tionality were addressed (Fig. 2) – but neither were all themes were utilised (Fig. 6). The same is true of issues relating to paper legends, which are important in a large number of Digimap use cases. These remain open issues requiring creative solutions.
8 CONCLUSION
Theparamapmakes a significant contribution to geospatial tion and other para-information is important in information visualiza-tion. We have argued here that the principles and guidance governing good map design should also direct goodparamapdesign and we ex-tend this argument to keys, legends and meta-information associated with other data graphics that are less “inherently spatial”. This con-tention is explored here with respect to map legends for a national dig-ital data provider through a series of priorities and ideas that emerged from users and an assessment of good practice described in the carto-graphic literature. The high-level principles and broad themes devel-oped have shaped design decisions and enable us to use principles and guidance for map design in legend design. We explored the themes and principles through data prototypes and suggest that this approach may be widely beneficial in information visualization where understanding data is intrinsically linked with understanding data representation.
The various impacts and omissions reported insection 7indicate that there is scope for further work to apply, enhance and evaluate the various concepts and to extend and enhance the application of visu-alization legends. The general nature of the themes and guidelines leaves ample room for interpretation and refinement. We need to ex-plore the design space partially described by the concepts presented here and address many of the open questions raised regarding use of legend space as we react to this re-thinking of legends. This work may include: designing and evaluating interactions and controls that sup-port the kinds of dynamism presented here; evaluating legend designs to build on reports of positive effects under certain conditions [47]; un-derstanding, predicting and accounting for the effects of legend insta-bility (in for example theRelevant Legend); establishing meaningful locations for themapped legend; the possibility of aLegend Legendas legend designs use layout and colour in more sophisticated ways.
Working with a large data provider serving mapping data that have traditionally been considered static and often paper-based has provided some interesting challenges. We found conducting theimagination ex-erciseshighly valuable in this context where opportunities offered by information visualization can allow radically different approaches to legend construction and use. Our prototypes that implemented these approaches have with favourable responses from the data provider and have resulted in new funded activity to implement novel forms of leg-end for leg-end users. This should allow more task-based evaluation and the approach to be applied, enhanced and evaluated in a wider range of data visualization contexts and activities.
Ultimately, design in both cartography and information visualiza-tion involves informed human decision-making, as does effective us-age of the artifacts each discipline produces. We draw attention to the need to design spatially, whatever the degree of spatiality in a particu-lar data set, or view of it. We hope that a focus on legend design will result in more cognitively useful and explicitly spatial maps, graphics and associated para-information to support those using visualization.
ACKNOWLEDGMENTS
REFERENCES
[1] G. Andrienko and N. Andrienko. Interactive maps for visual data explo-ration.Int. J. Geog. Inf. Science (IJGIS), 13(4):355–374, 1999. [2] H. R. Aspaas and S. J. Lavin. Legend designs for unclassed,
bivari-ate, choropleth maps. Cart. & Geog. Inf. Science (CAGIS), 16(4):257– 268(12), 1989.
[3] C. A. Brewer. Color use guidelines for mapping and visualization. In A. M. MacEachren and D. Taylor, editors,Visualization in Modern Car-tography, pages 123–147. Elsevier, Tarrytown, NY, 1994.
[4] C. A. Brewer. Designing Better Maps; A Guide for GIS Users. ESRI Press, Redlands, CA, 2005.
[5] British Geological Survey. Colour on geological maps. http://bit.ly/d57FXe, 2010.
[6] British Geological Survey. DiGMapGB - 1:625 000 scale data. http://bit.ly/dph5vb, undated.
[7] B. Bucher, E. Buard, L. Jolivet, and A. Ruas. The need for web leg-end services. In G. E. Ware, J. Mark; Taylor, editor,Web and Wireless Geographical Information Systems, Lecture Notes in Computer Science 4857, pages 44–60. Springer, 2007.
[8] W. Cartwright. Extending the map metaphor using web delivered multi-media.Int. J. Geog. Inf. Science (IJGIS), 13(4):335–353, 1997. [9] N. Cawthon and A. Vande Moere. The effect of aesthetic on the usability
of data visualization. InIEEE Int. Conf. Info Vis (IV’07), Zurich, Switzer-land, pages 637–648, 2007.
[10] CloudMade. CloudMade makes maps differently. http://maps.cloudmade.com/, 2010.
[11] C. Collins, F. B. Vi´egas, and M. Wattenberg. Parallel tag clouds to explore faceted text corpora. InProc. of IEEE Symp. VAST, pages 91–98, 2009. [12] C. W. Cox. Anchor effects and the estimation of graduated circles and
squares.The American Cartographer, 3(1):65–74, 1976.
[13] D. J. Cuff and M. T. Mattson. Thematic Maps: Their Design and Pro-duction. Methuen, New York, NY, 1982.
[14] A. DeLucia and D. Hiller. Natural legend design for thematic maps.The Cartographic Journal, 19(1):46–52, 1982.
[15] B. D. Dent. Cartography: Thematic Map Design. Wm. C. Brown, Dubuque, IA, second edition, 1990.
[16] D. Dorling, A. Barford, and M. Newman. Worldmapper: The world as you’ve never seen it before. IEEE Trans. Vis. Comp. Graphics, 12(5):757–764, 2006.
[17] J. A. Dykes. Exploring spatial data representation with dynamic graphics.
Computers & Geosciences, 23(4):345–370, 1997.
[18] J. A. Dykes. An approach to virtual environments for visualization us-ing linked geo-referenced panoramic imagery.Comp., Env. & Urb. Syst. (CEUS), 24(2):127–152, 2000.
[19] S. Egbert and T. A. Slocum. EXPLOREMAP: an exploration system for choropleth maps.Ann. Assoc. Am. Geog. (AAAG), 82(2):275–288, 1992. [20] E. A. Ellehoj and M. R. Coulson. Legend design for soil maps: An
ex-periment.Cart. & Geog. Inf. Syst. (CAGIS), 17(3):225–235, 1990. [21] D. Fisher. Hotmap: Looking at geographic attention. IEEE Trans. Vis.
Comp. Graphics, 13(6):1184–1191, 2007.
[22] J. Floyd, R. Addison, D. Reay, A. Leslie, T. Pharaoh, A. Myers, P. Turner, J. Arbon, and I. Cooke. A new edition of the bedrock geol-ogy map of the United Kingdom. In A. Smith, editor,Journal of Maps 10.4113/jom.2009.1109, pages 232–252. 2009.
[23] Google Inc. Street View: Explore the world at street level. http://bit.ly/aCpt2c, 2010.
[24] M. Harrower. Tips for designing effective animated maps.Cartographic Perspectives, 44:63–65, 2003.
[25] M. Harrower and C. Brewer. Colorbrewer.org: an online tool for selecting colour schemes for maps.The Cartographic Journal, 40(1):27–37, 2003. [26] J. Haslett, R. Bradley, P. Craig, A. Unwin, and G. Wills. Dynamic graph-ics for exploring spatial data with application to locating global and local anomalies.The American Statistician, 45(3):234–242, 1991.
[27] J. Haslett, G. Wills, and A. Unwin. SPIDER - an interactive statistical tool for the analysis of spatial data. Int. Jour. Geog. Inf. Syst. (IJGIS), 4(3):285–296, 1990.
[28] J. Heer and G. Robertson. Animated transitions in statistical data graph-ics.IEEE Trans. Vis. Comp. Graphics, 13(6):1240–1247, 2007. [29] IEEE Computer Society V>C. VisWeek 2010: InfoVis Welcome.
http://bit.ly/bcUR19, 2010.
[30] B. Jenny, E. Hutzler, and L. Hurni. Self-Adjusting legends for propor-tional symbol maps.Cartographica, 44(4):301–304, 2009.
[31] L. Jolivet. On-demand map design based on user-oriented specifications. InProc. AutoCarto 08, Shepherdstown, WV, 2008. CAGIS.
[32] L. Jolivet. Characterizing maps to improve on-demand cartography - the example of european topographic maps. InProc. of the 17th GIS Research UK Annual Conference, Durham, UK, 2009. University of Durham. [33] J. Keates. Some reflections on cartographic design. The Cartographic
Journal, 30(2):199–201, 1993.
[34] R. Kitchin. The practices of mapping. Cartographica, 43(3):211–215, 2008.
[35] J. Krygier. Cartographic multimedia and praxis in human geography and the social sciences. In W. Cartwright, M. Peterson, and G. Gartner, edi-tors,Multimedia Cartography, pages 245–256. Springer, 1999. [36] J. Krygier, C. Reeves, D. DiBiase, and J. Cupp. Design, implementation
and evaluation of multimedia resources for geography and earth science education.J. Geog. in Higher Ed. (JGHE), 21(1):17–39, 1997. [37] N. Kumar. Frequency histogram legend in the choropleth map: A
substitute to traditional legends. Cart. & Geog. Inf. Science (CAGIS), 31(4):217–236, 2004.
[38] G. Lakoff.Women, Fire, and Dangerous Things: What Categories Reveal about the Mind. University of Chicago Press, Chicago, IL, 1987. [39] D. Lloyd. Evaluating human-centered approaches for geovisualization.
PhD thesis, City University London, 2010.
[40] A. Lobben and D. K. Patton. Design guidelines for digital atlases. Car-tographic Perspectives, 44:51–62, 2003.
[41] A. MacEachren. How Maps Work: Representation, Visualization and Design. Guildford Press, New York, NY, 1995.
[42] B. Medynska-Gulij. PointSymbols: investigating principles and original-ity in cartographic design.Cartographic Journal, 45(1):62–67, 2008. [43] Open Geospatial Consortium, Inc. Styled Layer Descriptor.
http://bit.ly/64hWjy, 2010.
[44] Ordnance Survey. OS Landranger (1:50,000 scale) map symbols. http://bit.ly/d4N4RJ, 2002.
[45] Ordnance Survey. Strategi user guide and technical specification: v6.3. http://bit.ly/9VUCwz, 2006.
[46] M. Peterson. Active legends for interactive cartographic animation. Int. J. Geog. Inf. Science (IJGIS), 13(4):375–383(9), 1999.
[47] N. H. Riche, B. Lee, and C. Plaisant. Understanding interactive legends: a comparative evaluation with standard widgets.Computer Graphics Fo-rum, 29(3):1193–1202, 2010.
[48] A. H. Robinson, J. L. Morrison, P. C. Muehrcke, A. J. Kimerling, and S. C. Guptill.Elements of Cartography. Wiley, New York, NY, 1995. [49] R. Sieber, C. Schmid, and S. Wiesman. Smart Legend - Smart Atlas. In
Proc. XXII Int. Carto Conf. (ICC2005), 2005.
[50] A. Skupin. From metaphor to method: Cartographic perspectives on in-formation visualization. InProc. IEEE Symp. Information Visualization 2000, pages 91–97, 2000.
[51] A. Skupin and S. Fabrikant. Spatialization methods: A cartographic research agenda for non-geographic information visualization. Cart. & Geog. Inf. Science (CAGIS), 30(2):99–120, 2003.
[52] A. Slingsby, J. Dykes, and J. Wood. Configuring hierarchical layouts to address research questions.IEEE Trans. Vis. Comp. Graphics, 15(6):977– 984, 2009.
[53] T. A. Slocum, R. B. McMaster, F. C. Kessler, and H. H. Howard. The-matic Cartography & Geovisualization. Series in Geographic Informa-tion Science. Prentice Hall, Upper Saddle River, NJ, third ediInforma-tion, 2009. [54] J. P. Snyder. Map Projections: A Working Manual Edition. USGS
Pro-fessional Paper. US Geological Survey, 1987.
[55] E. Sutton, D. Medyckyj-Scott, and T. Urwin. The EDINA Digimap Ser-vice 10 Years On.The Cartographic Journal, 44(3):268–275, 2007. [56] W. Tobler. Thirty five years of computer cartograms. Ann. Assoc. Am.
Geog. (AAAG), 94(1):58–73, 2004.
[57] A. Unwin. Requirements for interactive graphics software for exploratory data analysis.Computational Statistics, 14(1):7–22, 1999.
[58] L. Wilkinson and M. Friendly. The history of the cluster heat map. The American Statistician, 63(2):179–184, 2009.
[59] W. Willett, J. Heer, and M. Agrawala. Scented widgets: Improving navigation cues with embedded visualizations. IEEE Trans. Vis. Comp. Graphics, 13(6):1129–1136, 2007.
[60] D. Wood.The Power of Maps. The Guilford Press, New York, NY, 1992. [61] D. Wood and J. Fels. The natures of maps: Cartographic constructions of
the natural world.Cartographica, 43(3):189–202, 2008.
![Fig. 3.HEIGHTS50 The Map is the Legend – Map Section1 metre = 3.2808 feetROCK FEATURESContours are at 10 metresvertical interval650Heights are to the nearest.An extract of the OS Landranger 1:50,000 map symbols sheet [44] con-taining a natural legend](https://thumb-us.123doks.com/thumbv2/123dok_us/1607817.113718/5.612.309.563.51.129/heights-section-feetrock-featurescontours-metresvertical-interval-heights-landranger.webp)