Introduction
The extent of paralysis and loss of sensation following Spinal Cord Injury (SCI) depends upon the neurological level and completeness of injury. In complete thoracic SCI, the lower limbs are paralysed (paraplegia), but not the upper limbs. In in-complete thoracic SCI, some pathways are spared, leading to varying degrees of remaining sensation and of voluntary control of lower limb muscles. After SCI, extensive muscle atrophy is accompanied by substantial bone loss in the paralysed limbs,
increased risk of fracture and reduced quality of life1
. Fragility fracture rates in SCI are at least twice those in the general pop-ulation2
. The most common fracture sites are both epiphyses of the tibia, and the distal epiphysis of the femur3.
In paraplegia, unloading of the bones from muscle disuse in the paralysed limbs is a significant factor in this sublesional bone loss. Neurogenic factors may also have an important role4
. In neurologically-intact individuals, mechanical loading through muscle action can have a positive osteogenic effect5
. Hence, electrically-stimulated exercise has been used to me-chanically reload the bones in SCI, with the aim of attenuating or reversing bone loss in the paralysed limbs6-9
.
Treadmill training may positively influence muscle and bone in incomplete SCI. In a treadmill intervention study in acute SCI, Giangregorio et al. found that the subject showing the smallest reductions in BMD in the lower limbs also made the greatest improvements in ambulatory abilities10
. For pa-tients with motor-incomplete SCI with some lower limb mus-cles still under voluntary control, reintroducing ambulatory activity may have positive musculoskeletal effects in the
ex-Muscle and bone adaptations after treadmill training
in incomplete Spinal Cord Injury: a case study using
peripheral Quantitative Computed Tomography
S. Coupaud
1,2, L.P. Jack
1,2, K.J. Hunt
1,2, D.B. Allan
21
Centre for Rehabilitation Engineering, Department of Mechanical Engineering, University of Glasgow, Glasgow, UK;
2
Scottish Centre for Innovation in Spinal Cord Injury, Queen Elizabeth National Spinal Injuries Unit, Southern General Hospital, Glasgow, UK
Abstract
We describe the use of peripheral Quantitative Computed Tomography (pQCT) to identify musculoskeletal responses to partial body-weight supported treadmill training (BWSTT) in incomplete spinal cord injury (SCI). Long-term health consequences of SCI include extensive muscle atrophy, severe bone loss and an increased fracture risk in the affected limbs, mostly at both tibial epiphyses and the distal femoral epiphysis. Regular treadmill training may slow or reverse bone loss by recruiting available lower-limb musculature and loading the leg bones dynamically. The potential for detailed analysis of musculoskeletal changes using pQCT is illustrated with a single case study (14.5 years post-SCI), who completed seven months of partial BWSTT. Pre- and post-training lower-limb pQCT scans were taken to quantify changes in trabecular bone, cortical bone, and soft-tissue. Trabecular bone mineral density increased by 5% (right) and 20% (left) in the distal tibia. Changes in proximal tibia and distal femur were negligible. Increases in muscle cross-sectional area were 6% (right) and 12% (left) in the lower leg, 7% (right) and 5% (left) in the thigh. We suggest that treadmill training may lead to positive musculoskeletal adaptations at clinically-relevant sites. Such changes can be measured in detail using pQCT.
Keywords:Βody-Weight Supported Treadmill Training (BWSTT), Bone Mineral Density, Exercise, Peripheral Quantitative Computed Tomography (pQCT), Spinal Cord Injury (SCI)
Case Report Article Hylonome
The authors have no conflict of interest.
Corresponding author: Dr. Sylvie Coupaud, Centre for Rehabilitation Engi-neering, Department of Mechanical EngiEngi-neering, University of Glasgow, Glaskow, G12 8QQ, UK
E-mail: [email protected]
ercising legs. Training during the first year post-injury may at-tenuate bone loss, but is unlikely to prevent it completely dur-ing this phase of typically rapid and extensive bone loss.
In a separate study, Giangregorio et al. investigated muscu-loskeletal effects of treadmill intervention in 13 subjects with chronic incomplete SCI11
. They found that there was no overall mean increase in BMD associated with the BWSTT training, but the authors emphasised the large intersubject variability in response to the training. With time since injury ranging from 1-24 years, at least 60% of the subjects had chronic but not long-established SCI, and may still have been experiencing bone loss when recruited on the study. The term “chronic” is misleading when used in relation to bone in SCI: the term is used clinically in relation to the patient’s neurology which tends to stabilise within weeks or months of injury, compared to the years it takes for bones in the paralysed limbs to reach a new, lower steady-state (5-7 years), as documented by Eser et al.12
. Subjects in Giangregorio et al.’s study11
who did not have long-established SCI experienced bone loss despite the intervention – recorded as decreases in BMD from baseline. As they were unlikely to be in a bone steady-state at enrolment, the treadmill training may have attenuated the rate of bone loss that would have occurred in the absence of intervention, but this could not be discerned. Analysing each subject’s response to the inter-vention on a case-by-case basis would have been informative. After excluding a single subject who was only 1 year post-in-jury from the analysis, BMD at the distal femur either remained stable or increased in the remaining participants11
.
A review on Spinal Cord Injury Rehabilitation Evidence (SCIRE)13
acknowledges the difficulties in interpreting and com-paring results from interventional studies carried out to date, due to low numbers of participants and variability with the primary outcome measures. An example is a study by de Bruin et al. (1999)14
in which 13 subjects with acute SCI completed a period of one of three rehabilitation programmes: immobilization alone (n=4), standing only (n=5) and combined standing and walking (n=4). Their results suggested a lesser decrease in trabecular BMD in the distal tibia in those subjects who underwent standing or combined standing and walking. However, the musculoskele-tal responses could not be compared between the two groups as those who performed standing only all had a motor-complete (grades A & B on the American Spinal Injuries Association Im-pairment Scale15) thoracic SCI whilst those undergoing treadmill walking as well as standing all had a motor-incomplete SCI (American Spinal Injuries Association Impairment Scale grades C & D) and so had some level of remaining control of certain muscles below the level of injury not quantified in the study. Therefore, the potential osteogenic effects attributable to the treadmill walking per secould not be identified.
Peripheral Quantitative Computed Tomography (pQCT) al-lows bone parameters of the peripheral skeleton to be investi-gated in detail. Dual-energy X-ray absorptiometry is currently used for routine clinical bone densitometry for diagnosing os-teoporosis and osteopenia. However, pQCT provides more quantitative information about the bone than dual-energy X-ray absorptiometry. pQCT provides volumetric BMD, instead
of projected areal BMD, and discriminates between trabecular and cortical bone, thus enabling investigations of bone distri-bution, architecture and geometry16
. In longitudinal investiga-tions, pQCT allows quantification of changes in bone parameters and cross-sectional areas of muscle and fat. Where changes are expected in tissue, pQCT is preferable as soft-tissue changes can lead to artefacts in dual-energy X-ray ab-sorptiometry bone measurements, through underestimation of changes in bone or lack of detection of an effect17
.
In their studies, Giangregorio et al. used dual-energy X-ray absorptiometry to determine areal BMD in the distal femur and proximal tibia, and CT to determine bone and muscle param-eters at the mid-shaft. The use of dual-energy X-ray absorp-tiometry to image the epiphyses limited the potential for detailed bone data to be collected at the fracture-prone sites. Ideally, CT would have been used to image the distal femur and proximal tibia to separate trabecular from cortical bone and to determine trabecular BMD values in the epiphyses. Changes in response to reduced loading tend to occur most rapidly in trabecular-rich areas12,18
. These are the most frac-ture-prone sites in SCI. Eser et al.3
have proposed that trabec-ular BMD at the distal epiphyses of the tibia and femur is the most sensitive parameter distinguishing persons with SCI with fractures from those without. The authors determined trabec-ular BMD fracture thresholds based on their findings3
. We pro-pose that trabecular BMD at these sites is a key parameter to be investigated in longitudinal studies in SCI.
We present a case study of a male subject with long-estab-lished incomplete SCI, 14 years post-injury, and therefore in a stable motor, sensory and bone phase at the start of participa-tion. This case study illustrates the use of pQCT for quantify-ing changes in bone parameters, especially trabecular bone mineral density, at clinically-relevant sites after a period of treadmill training. These can be related to changes in leg mus-cles also recorded using pQCT.
Methods
Subjects
The subject was male, 40 years old, body mass 105 kg, with SCI at neurological level T6, (American Spinal Injuries Asso-ciation Impairment Scale grade C15), 14.5 years post-injury, and greater neurological impairment on the left side. Prior to participation, he could ambulate over short distances using a walking frame. Independently of this study, the subject’s med-ical consultant prescribed once weekly 35 mg Risedronate (bisphosphonate), with Calcium and Vitamin D supplement tablets (three times daily) at the same time as the subject’s par-ticipation in the study. The study was approved by the South Glasgow Research Ethics Committee. Written informed con-sent was obtained.
Apparatus for training
speed of 0.1m.s-1
and a gradient of 0%, twice weekly. To achieve this, the subject required approximately 30% BWS. Intermittent training (walking as long as possible, with 10 minute rest bouts in between) was permitted to achieve the tar-get duration. This continued until a continuous 15mins was achieved 3 sessions in a row. This took 15 training sessions over 2 months. Thereafter, a progressive 5-month training pro-gramme followed. Training sessions were increased to 3 times weekly, starting at 0.1m.s-1
, 0% gradient for as long as possi-ble. The target duration was increased by 5 minutes every 3 weeks, to a maximum of 30 minutes. The focus of the training sessions alternated between increasing speed and increasing gradient. During speed training, the gradient was 0%; during gradient training, the speed was 0.15 m.s-1
. Training frequency increased to three 30-minute sessions weekly. Training inten-sity increased by 1% or 0.05 m.s-1
when the subject could com-plete 3 consecutive continuous 30-minute sessions at a particular speed or gradient. By the end of the intervention pe-riod, training speed had trebled to 0.30 m.s-1and gradient had increased from 0 to 5%.
Functional electrical stimulation (FES) was applied to the peroneal nerve on the more impaired side (left) to elicit the withdrawal reflex and achieve foot clearance during swing phase. The two-channel stimulator (Odstock O2CHS, Salis-bury, UK) was controlled by the investigator using a finger switch. Surface gel electrodes (50mm diameter, PALS Ultra-flex, Axelgaard, USA) were applied on the skin over the popliteal fossa and the head of the fibula. Stimulation param-eters were 40Hz, 40mA, and 117-351μs. Body weight support was 32 kg (~30% body mass). No additional manual assistance was given during training.
Bone measurements
Scans were performed: (1) prior to intervention (baseline) and (2) after seven months of treadmill training (post-training). A pQCT scanner (XCT 3000, Stratec Medizintechnik, Ger-many) was used. It measures attenuation of X-rays, which is lin-early transformed into hydroxyapatite densities. It is calibrated with respect to water (set at 60 mg hydroxyapatite), with fat at 0 mg hydroxyapatite. Quality assurance scans were performed prior to each scanning session using the manufacturer's phantom. Tibial length was measured from the distal end of the medial malleolus to the medial joint cleft. Femur length was approx-imated to be equal to tibial length. The subject transferred from his wheelchair to a height-adjustable couch and lay supine. A scout view was carried out to place the reference line on the distal endplate of the tibia. Tibial scans were performed at 4%, 14%, 38% and 66% of total bone length, starting distally. The leg was then moved further into the scanner and scout views were performed for the proximal tibia and the femur. From the proximal tibia scout view, the reference line was placed on the proximal end of the more distal of the two condyles of the bone; the tibia was scanned at 4% from the proximal end. From the distal femur scout view, the reference line was placed on the distal end of the more proximal of the two condyles of the bone; the distal femur was scanned at 4% and 25% from
the distal end. Slice thickness was 2 mm. Voxel size was 0.5 mm (tibia) or 0.3 mm (femur).
The manufacturer's software (XCT 550, Stratec Medizin-technik, Germany) was used for analysis. Epiphyseal bone pa-rameters (4% scan sites) were: total cross-sectional area of bone (CSAtot), bone mineral content (BMC), total BMD (BMDtot) and trabecular BMD (BMDtrab). Contour algo-rithms with thresholds of 180 mg.cm-3in the distal tibia, 150 mg.cm-3
in the proximal tibia and 130 mg.cm-3
in the distal femur were used to find the periosteal surface of the epiph-ysis12
, to calculate BMC, BMDtot and CSAtot. For BMDtrab calculations, concentric pixel layers were automatically peeled off from the perimeter until the central 45% area re-mained12,21,22
.
Diaphyseal bone parameters (14%, 25% and 38% sites) were: BMC, CSAtot, cortical bone CSA (CSAcort), cortical BMD (BMDcort), and polar strength-strain index (SSIpol). A threshold-based contour algorithm (set at 280 mg.cm-3
) iden-tified the periosteal surface of the diaphysis, to obtain BMC, CSAtot and SSIpol. Cortical bone was identified using the standard manufacturer's threshold of 710 mg.cm-3
, to deter-mine BMDcort and CSAcort.
Reproducibility has been shown by Eser et al.12to be better than 1% for most parameters, with coefficients of variation ranging from 0.47% (BMC and BMDcort) to 3.80% (SSIpol) in the femur, and from 0.24% (BMC) to 1.23% (CSAtot) in the tibia.
Where precision errors and coefficient of variations were available, the least significant change was calculated for each parameter (x) in the same units, according to the following equa-tion: LSCx=1.96√SDx. Changes in bone parameters recorded over the intervention period were compared to the LSCs.
Soft-tissue measurements
Muscle and fat CSAs were estimated at the 66% tibial and 25% femoral pQCT scan sites. Combined muscle and fat CSA was automatically calculated by subtracting CSAtot from the total image CSA. For the remaining area, the manufacturer's threshold of 36 mg.cm-3
was used to separate fat from muscle, providing estimates of muscle CSA and fat CSA. We used a combination of filters (3*3 filter for all voxels; 5*5 filter for all voxels between -500 & 600 mg.cm-3
; 3*3 filter for all vox-els between -500 and 36 mg.cm-3
) to extract the total fat from the muscle. The bone-to-muscle ratio (BMR) was calculated as the ratio of cortical bone CSA (tibia+fibula) to muscle CSA, presented as a percentage. The fat-to-muscle ratio (FMR) was calculated as the ratio of total fat CSA to muscle CSA, as a percentage. BMR and FMR were determined at the 66% scan site in the lower leg and the 25% scan site in the thigh.
Results
Bone
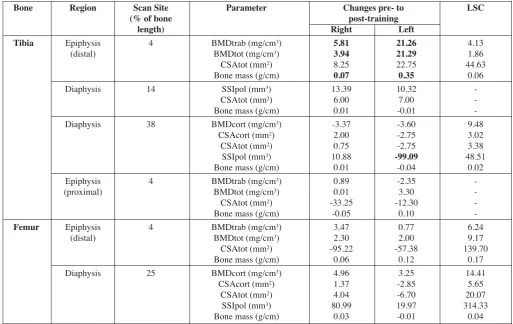
Bone Region Scan Site Parameter Right Left (% of bone length) Baseline Post-training Baseline Post-training
Tibia Epiphysis 4 BMDtrab (mg/cm3) 118.4 124.2 108.3 129.6
(distal) BMDtot (mg/cm3) 184.2 188.2 169.3 190.6
CSAtot (mm2) 1453.75 1462.00 1434.25 1457.00
Bone mass (g/cm) 2.68 2.75 2.43 2.78
Diaphysis 14 SSIpol (mm3) 1630 1643 1580 1590
CSAtot (mm2) 575.00 581.00 584.25 591.25
Bone mass (g/cm) 2.29 2.30 2.18 2.17
Diaphysis 38 BMDcort (mg/cm3) 1121.9 1118.5 1119.2 1115.6
CSAcort (mm2) 279.5 281.5 279.8 277.0
CSAtot (mm2) 483.00 483.75 493.50 490.75
SSIpol (mm3) 1912 1923 2054 1955
Bone mass (g/cm) 3.62 3.63 3.62 3.58
Epiphysis 4 BMDtrab (mg/cm3) 83.1 84.0 85.5 83.2
(proximal) BMDtot (mg/cm3) 136.1 136.1 130.8 134.1
CSAtot (mm2) 3306.0 3272.75 3352.30 3340.00
Bone mass (g/cm) 4.50 4.45 4.38 4.48
Femur Epiphysis 4 BMDtrab (mg/cm3) 158.9 162.3 147.2 147.9
(distal) BMDtot (mg/cm3) 197.8 200.1 190.6 192.6
CSAtot (mm2) 3857.00 3841.38 3761.78 3784.00
Bone mass (g/cm) 7.6 7.7 7.2 7.3
Diaphysis 25 BMDcort (mg/cm3) 1102.7 1107.7 1107.7 1111.0
CSAcort (mm2) 300.2 301.6 283.5 280.7
CSAtot (mm2) 1042.40 1046.44 1030.92 1024.22
SSIpol (mm3) 4072 4153 3706 3726
[image:4.609.44.553.70.385.2]Bone mass (g/cm) 4.33 4.36 4.07 4.06
[image:4.609.112.483.447.724.2]Table 1.Bone parameters determined from pQCT scans.
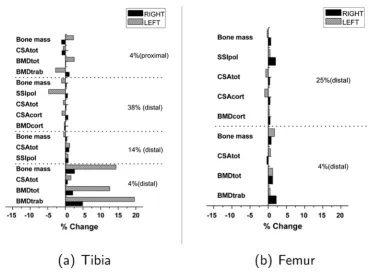
training period, BMDtrab increased at the distal tibia by 6 mg.cm-3
(5%) in the right and 21 mg.cm-3
(20%) in the left. BMC increased at the distal tibia by 0.07 g.cm-1
(3%) on the right and 0.35 g.cm-1(14%) on the left. Corresponding in-creases in BMDtot at these sites were 4 mg.cm-3
(2%) in the right and 21 mg.cm-3
(13%) in the left. These increases were greater than the LSCs. The pQCT scan images of the left distal tibia are shown in Figure 2.
Negligible changes (smaller than the LSCs) in BMDtrab and BMDtot were recorded at the distal femur on both sides. No comparison of changes at the proximal epiphysis of the tibia with LSCs is provided, as repeatability data are not avail-able for that site.
A decrease in SSIpol of 99.1 mm3(greater than the least sig-nificant change) was recorded in the left tibial shaft. All other changes were negligible.
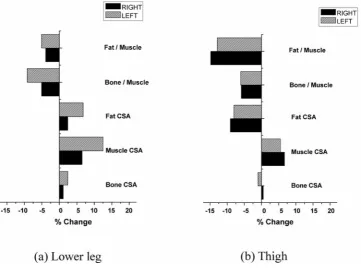
Muscle and other parameters
Muscle CSA and fat CSA data are summarised in Table 3, and percentage changes from baseline to the end of training are illustrated in Figure 3. Muscle CSA increased by 610 mm2
(6%) in the right and 1223 mm2
(12%) in the left lower leg over the training period. The pQCT images of the left lower leg are shown in Figure 4. Thigh muscle CSA increased by 391 mm2
(7%) in the right and 327 mm2
(5%) in the left. With training, fat CSA increased slightly in the lower leg, by 96 mm2(2%) in the right and 268 mm2(7%) in the left, but decreased in the thigh by 819 mm2
(9%) in the right and 786 mm2
(8%) in the left. Bone-to-muscle ratio decreased by 0.2 (5%) in the right and 0.3 (9%) in the left lower leg, and by 0.3 (6%) on both sides in the thigh. Fat-to-muscle ratio decreased by 1.7 (4%) in the right and 2.0 (5%) in the left lower leg, and by 22.7 (15%) in the right and 21.2 (13%) in the left thigh.
Discussion
Previous pQCT studies suggest that BMDtrab, BMDtot and BMC decrease significantly in the long bones of the paralysed limbs for up to 5-7 years after SCI12
; thereafter, values tend to stabilise at a new, lower steady-state19
. In our case report, the subject had a long-established SCI (14.5 years post-injury). His lower-limb bone-loading history would have remained
rela-Bone Region Scan Site Parameter Changes pre- to LSC
(% of bone post-training
length) Right Left
Tibia Epiphysis 4 BMDtrab (mg/cm3) 5.81 21.26 4.13
(distal) BMDtot (mg/cm3) 3.94 21.29 1.86
CSAtot (mm2) 8.25 22.75 44.63
Bone mass (g/cm) 0.07 0.35 0.06
Diaphysis 14 SSIpol (mm3) 13.39 10.32
-CSAtot (mm2) 6.00 7.00
-Bone mass (g/cm) 0.01 -0.01
-Diaphysis 38 BMDcort (mg/cm3) -3.37 -3.60 9.48
CSAcort (mm2) 2.00 -2.75 3.02
CSAtot (mm2) 0.75 -2.75 3.38
SSIpol (mm3) 10.88 -99.09 48.51
Bone mass (g/cm) 0.01 -0.04 0.02
Epiphysis 4 BMDtrab (mg/cm3) 0.89 -2.35
-(proximal) BMDtot (mg/cm3) 0.01 3.30
-CSAtot (mm2) -33.25 -12.30
-Bone mass (g/cm) -0.05 0.10
-Femur Epiphysis 4 BMDtrab (mg/cm3) 3.47 0.77 6.24
(distal) BMDtot (mg/cm3) 2.30 2.00 9.17
CSAtot (mm2) -95.22 -57.38 139.70
Bone mass (g/cm) 0.06 0.12 0.17
Diaphysis 25 BMDcort (mg/cm3) 4.96 3.25 14.41
CSAcort (mm2) 1.37 -2.85 5.65
CSAtot (mm2) 4.04 -6.70 20.07
SSIpol (mm3) 80.99 19.97 314.33
[image:5.609.54.568.69.393.2]Bone mass (g/cm) 0.03 -0.01 0.04
tively constant prior to inclusion in the study as he relied on his wheelchair for mobility. Therefore, bone parameters in the tibia and femur were assumed to be in steady-state at enrolment.
Prior to training, BMDtrab, BMDtot and BMC were higher in the distal epiphyses of the right tibia and femur, compared to the left. In incomplete SCI, one side of the body is often more impaired than the other. In this subject the left was his more impaired side. Weaker, more extensively paralysed mus-cles in the left leg may explain the lower baseline values.
This asymmetry was evident in the subject’s gait pattern at the start of participation, who exhibited drop foot on the left side only. During training, surface FES was applied to the per-oneal nerve on the left side to correct for drop foot, and to achieve a more natural pattern of gait during training. No FES
was applied on the right side, as the subject was able to dorsi-flex the right foot sufficiently and clear the ground unaided.
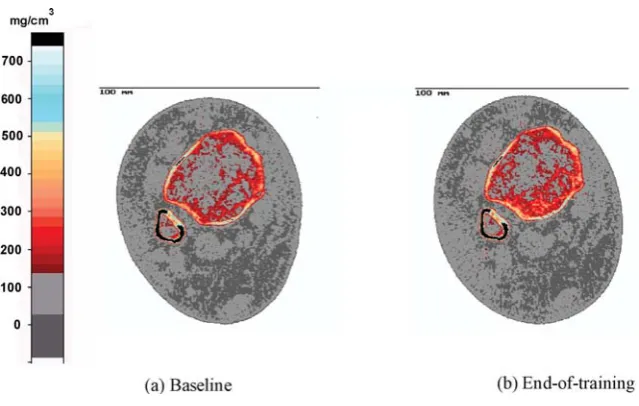
Asymmetry was evident in the response to training, with larger increases in muscle CSA recorded in the left lower leg (12% compared to 6% in the right) and associated increases of BMDtrab at the distal tibia (20% in the left, 5% in the right), which could be related to the FES. FES may have produced hypertrophy and more forceful contraction of the stimulated muscles over time, to a greater extent than through voluntary muscle action in the right. A greater osteogenic response may have resulted in the left than the right distal tibia. As well as the magnitude of changes being greater, many of the final ab-solute values in the left were higher than in the right. This sug-gests a potential role for combining FES with voluntary effort Figure 2.Baseline (a) and end-of-training (b) pQCT scans of the distal epiphysis of the left tibia, on the same scale. A comparison of baseline and post-training images shows apparent regional differences in trabecular BMD at the distal tibia between the two time points, and most notably a higher BMD after the treadmill training intervention. The legend to the far left shows the density (in mg/cm3) associated with each colour.
Measurement site Parameter Right Left
Baseline Post- Baseline Post-training Post-training
Lower leg CSAcort-tibia+fibula (mm2) 362.5 366.5 351.8 360.0
(at 66 % of leg length Muscle CSA (mm2) 9323.5 9933.3 9810.0 11033.5
from distal tibia) Fat CSA (mm2) 4102.8 4199.0 3959.3 4227.8
Bone to muscle ratio (%) 3.9 3.7 3.6 3.3
Fat to muscle ratio (%) 44.0 42.3 40.4 38.3
Thigh CSAcort - femur (mm2) 300.2 301.6 283.5 280.7
(at 25 % of thigh length Muscle CSA (mm2) 5866.9 6257.7 5912.9 6240.4
from distal femur) Fat CSA (mm2) 9013.6 8194.9 9666.6 8881.0
Bone to muscle ratio (%) 5.1 4.8 4.8 4.5
[image:6.609.138.458.67.270.2]Fat to muscle ratio (%) 153.6 131.0 163.5 142.3
to enhance the benefits of training in incomplete SCI. Previous studies have investigated the effects of FES-exercise on the bones in the lower-limbs in SCI, such as FES-cycling6-9,20-22
, but results have been equivocal. Some groups found attenua-tion of bone loss9,20
, others no significant change21
, and yet oth-ers positive gains in bone parametoth-ers6-8,22
following FES-training. Details of the FES-training (e.g. frequency and
magnitude of muscular contractions, and training duration) are likely to be important in achieving desired musculoskeletal changes in the paralysed limbs in SCI. Dudley-Javoroski & Shields provide evidence to support this for long-term electri-cally-stimulated training of the soleus muscle in SCI23,24
[image:7.609.131.493.71.341.2]. In subjects who underwent unilateral soleus training, enabling comparison of the trained and untrained sides, the investigators Figure 3.Summary of changes in bone, muscle and fat distribution, calculated as percentages of baseline values.
[image:7.609.140.484.405.579.2]demonstrated that “long-term electrically-elicited soleus con-tractions delivered sufficient loads to the tibia to attenuate the post-SCI decline in trabecular BMD. Soleus loads approxi-mated 1.5 times body weight and were performed ~8,000 times a month over the study”24
.
Usually, the largest forces acting on bones are those exerted by muscles, with resulting strains potentially inducing os-teogenic responses in accordance with Wolff’s Law25-26
and Frost’s Mechanostat theory27
. Frost hypothesised how bone re-sponds to changes in strain (relative to modelling and remod-elling thresholds) and has the capacity to adapt to loads applied through exercise28
. In our case study, the magnitude of the os-teogenic response might reflect the magnitude of changes in the muscles acting on the relevant bones. Factors that may in-fluence the extent of the osteogenic response include muscle size and force-producing capability, and the direction of forces exerted by the muscles on the bones during training.
As Giangregorio et al. (2005) point out, “Treadmill training would not normally be considered a method for inducing muscle hypertrophy, but in individuals who have experienced a dramatic reduction in muscle activity, the walking stimulus may represent a considerable challenge to the atrophied muscle.”10
If the changes in bone observed with the subject in our Case Report could be attributed to changes in the muscle, this would be re-lated to the FES-assisted treadmill intervention, as the subject made no other changes to his physical activity during the period of treadmill training. However, as his medical consultant simul-taneously prescribed a bisphosphonate (Risedronate) with Cal-cium and Vitamin D supplementation independently of this study, we cannot rule out a pharmacological effect of this med-ical intervention on the bones. The treatment was initiated at the same time as the treadmill-training intervention. At this stage post-injury, anti-resorptive therapy alone would not be expected to reverse bone loss as it acts to suppress bone turnover, not to stimulate bone formation. If the medical intervention explained positive changes in the bones, this would not account for the dif-ferent responses observed in the tibia and the femur.
We can only speculate between the theories of the formation of new trabeculae or increased mineralisation in the distal tibia. The former effect has not been shown to date from animal stud-ies of bisphosphonate treatment interventions. If formation of new trabeculae explains the changes recorded at the distal tibia, we would therefore postulate that positive changes in bone pa-rameters in the lower-limbs over the intervention period would be attributed to the physical intervention, rather than the bispho-sphonate. Alternatively, if increased mineralisation explains the observed changes, it could be in response to the exercise, the bisphosphonate effects on remodelling, increased mineralisation by vitamin D, or a combination of these factors. As the medical intervention was maintained throughout the period of training, we cannot rule out effects of the bisphosphonate and supple-ments on the bones. The evidence for the osteogenic effective-ness of bisphosphonate and/or vitamin D supplementation after SCI remains equivocal13,29,30
. As noted by Bauman et al. in their study of the effect of supplementation with a vitamin D analog, “the potential synergistic effects of pharmacological therapy and
a physical therapy, possibly with a form of mechanical loading, may be considered”30
. Potential benefits of combining exercise and pharmacological therapies may become most apparent in incomplete SCI, as recognised by Pearson et al.31
in their study looking at differential responses to cyclical etidronate between patients with acute incomplete SCI (walkers) and those with motor-complete SCI (wheelchair-bound).
The decrease in bone-to-muscle ratio we recorded over the training period reflects faster and greater increases in muscle CSA in response to training, compared to those in cortical bone CSA. This may raise concerns if, by the end of this training intervention period, the muscle force-generating capability of the muscle has increased beyond the capacity of the bone. Similar concerns have been raised for FES-cycling intervention in chronic motor-com-plete SCI in which hypertrophy of the muscle is achieved rapidly with training22
. In a person with long-established SCI, the bones seem to be adapted to the much reduced typical peak loads on the bone that accompany muscle paralysis. With hypertrophy of the muscle through training, it may take a longer intervention period for the bone to re-adapt to increased levels of muscle activity. We recorded increased BMD at distal epiphysis of the bone over the intervention period, but the tibial shaft may have become weaker. This reduced ratio of bone to muscle, combined with the decrease in SSIpol (greater than the least significant change) recorded at the same site in the shaft, may indicate a tibial shaft at greater risk of fracture than at baseline. BMC, which provides an indication of the whole bone strength32, increased at the distal tibia in parallel with BMD, but showed signs of decreasing in the shaft of the bone. Although the tibial shaft is not typically fracture-prone in SCI, a weakening of the shaft could potentially increase the risk of fracture at this site.
In addition to the changes in muscle and bone, the regular treadmill exercise led to reduced fat CSA, but a slight increase in fat CSA in the lower legs. Fat-to-muscle ratios decreased at all sites. In the long-term, such body-composition changes could be beneficial in tackling the secondary health issues as-sociated with chronic SCI, such as elevated risks of developing conditions related to reduced physical activity, including Type II diabetes and cardiovascular diseases.
We have presented data from a single case study without a control group, from a population of individuals with SCI with considerable variations in musculoskeletal composition. We cannot extrapolate the positive musculoskeletal changes fol-lowing treadmill training intervention from this subject to the wider SCI population.
Conclusions
References
1. Chen B and Stein A. Osteoporosis in acute spinal cord in-jury. Top Spinal Cord Inj Rehabil 2003;9(1):26-35. 2. Vestergaard P, Krogh K, Rejnmark L and Mosekilde L.
Fracture rates and risk factors for fractures in patients with spinal cord injury. Spinal Cord 1998;36:790-6. 3. Eser P, Frotzler A, Zehnder Y, Denoth J. Fracture
thresh-old in the femur and tibia of people with spinal cord in-jury as determined by peripheral Quantitative Computed Tomography. Arch Phys Med Rehabil 2005;86:498-504. 4. Maimoun L, Fattal C, Micallef J-P, Peruchon E, Ra-bischong P. Bone loss in spinal cord-injured patients: from physiopathology to therapy. Spinal Cord 2006;44:203-10.
5. Chillibeck P, Sale D and Webber C. Exercise and bone mineral density. Sports Med 1995; 19(2): 103-122. 6. Bélanger M, Stein R, Wheeler G, Gordon T, Leduc B.
Electrical stimulation: can it increase muscle strength and reverse osteopenia in spinal cord injured individuals? Arch Phys Med Rehabil 2000;81:1090-8.
7. Chen S-C, Lai C-H, Chan W, Huang M-H, Tsai H-W, Chen J-J. Increases in bone mineral density after func-tional electrical stimulation cycling exercise in spinal cord injured patients. Disability & Rehabil 2005;22:1337-41. 8. Mohr T, Pødenphant J, Biering-Sørensen F, Galbo H,
Thamsborg G, Kjaer M. Increased bone mineral density after prolonged electrically induced cycle training of par-alyzed limbs in spinal cord injured man. Calcified Tissue Int 1997;61:22-5.
9. Shields R and Dudley-Javoroski S. Musculoskeletal plas-ticity after acute spinal cord injury: effects of long-term neuromuscular electrical stimulation training. J Neuro-physiol 2006;95:2380-90.
10. Giangregorio L, Hicks A, Weber C, Phillips S, Craven B, Bugaresti J and McCartney N. Body weight supported treadmill in acute spinal cord injury: impact on muscle and bone. Spinal Cord 2005;43:649-57.
11. Giangregorio L, Weber C, Phillips S, Hicks A, Craven B, Bugaresti J, McCartney N. Can body weight supported treadmill training increase bone mass and reverse muscle atrophy in individuals with chronic spinal cord injury? Appl Physiol Nutr Metab 2006;31:283-91.
12. Eser P, Frotzler A, Zehnder Y, Wick L, Knecht H, Denoth J, Schiessl H. Relationship between the duration of paral-ysis and bone structure: a pQCT study of spinal cord in-jured individuals. Bone 2004;34(5):869-80.
13. Craven BC, Ashe MC, Krassioukov A, Eng JJ. Spinal Cord Injury Rehabilitation Evidence, Chapter 9: Bone health in spinal cord injury, version 2.0.
http://www.icord.org/scire/pdf/SCIRE_II_CH9.pdf (downloaded Aug 2009).
14. de Bruin ED, Frey-Rindova P, Herzog RE, Dietz V, Dambacher MA, Stussi E. Changes of tibia bone proper-ties after spinal cord injury: effects of early intervention.
Arch Phys Med Rehabil 1999;80:214-20.
15. Maynard F, Bracken M, Creasey G, Donovan W, Ducker T, Garber S, et al. International Standards for Neurologi-cal and Functional Classification of Spinal Cord Injury. Spinal Cord 1997;35:266-74.
16. Jiang Y, Zhao J, Rosen C, Geusens P and Genant H. Per-spectives on bone mechanical properties and adaptive re-sponse to mechanical challenge. J Clin Densitometry 1999;2(4):423-33.
17. Bolotin H. A new perspective on the causal influence of soft tissue composition on DXA-measured in vivobone mineral density. J Bone Mineral Res 1998;13(11):1739-46. 18. Rittweger J, Frost HM, Schiessl H, Ohshima H, Alkner B, Tesch P, Felsenberg D. Muscle atrophy and bone loss after 90 days’ bed rest and the effects of flywheel resistive exercise and pamidronate: results from the LTBR study. Bone 2005;36:1019-29.
19. Frotzler A, Berger M, Knecht H, Eser P. Bone steady-state is established at reduced bone strength after spinal cord in-jury: a longitudinal study using peripheral Quantitative Computed Tomography (pQCT). Bone 2008;43(3):549-55. 20. Hangartner TN, Rodgers MM, Glaser RM, Barre PS. Tib-ial bone density loss in spinal cord injured patients: ef-fects of FES exercise. J Rehabil Res Dev 1994; 31(1):50-61.
21. Eser P, de Bruin ED, Telley I, Lechner HE, Knecht H, Stüssi E. Effect of electrical stimulation-induced cycling on bone mineral density in spinal cord-injured patients. Eur J Clin Invest 2003;33:412-9.
22. Frotzler A, Coupaud S, Perret C, Kakebeeke TH, Hunt KJ, Donaldson NN, Eser P. High-volume FES-cycling partially reverses bone loss in people with chronic spinal cord injury. Bone 2008;43:169-76.
23. Dudley-Javoroski S and Shields RK. Dose estimation and surveillance of mechanical loading interventions for bone loss after spinal cord injury. Phys Therapy 2008; 88(3):387-96.
24. Dudley-Javoroski S and Shields RK. Asymmetric bone adaptations to soleus mechanical loading after spinal cord injury. J Musculoskelet Neuronal Interact 2008;8(3):227-38. 25. Frost HM. From Wolff’s Law to the Utah Paradigm: in-sights about bone physiology and its clinical applications. The Anatomical Record 2001;262(4):398-419.
26. Frost HM. Wolff’s Law and bone’s structural adaptations to mechanical usage: an overview for clinicians. The Angle Orthodontist 1994;64(3):175-88.
27. Frost HM. Perspectives: a proposed general model of the “Mechanostat” (suggestions from a new skeletal-biologic paradigm). The Anatomical Record 1996;244:139-47. 28. Frost HM. Why do marathon runners have less bone than
weight lifters? A vital-biomechanical view and explana-tion. Bone 1997;20(3):183-9.
30. Bauman WA, Spungen AM, Morrison N, Zhang R-L, Schwartz E. Effect of a vitamin D analog on leg bone mineral density in patients with chronic spinal cord injury. J Rehab Res Dev 2005;42(5):624-34.
31. Pearson EG, Nance PW, Leslie WD and Ludwig S. Cycli-cal etidronate: its effect on bone density in patients with acute spinal cord injury. Arch Phys Med Rehabil 1997;
78:269-72.