Elsevier Editorial System(tm) for Journal of Materials Processing Technology Manuscript Draft
Manuscript Number: PROTEC-D-12-00022R1
Title: A computational fluid dynamic analysis of the effect of side draughts and nozzle diameter on shielding gas coverage during gas metal arc welding
Article Type: Research Paper
Keywords: CFD, GMAW, welding nozzle diameter, shielding gas coverage, side Corresponding Author: Miss Gemma Ramsey,
Corresponding Author's Institution: University of Strathclyde First Author: Gemma Ramsey
Order of Authors: Gemma Ramsey; Alex M Galloway, B.Sc, PhD, CEng; Stuart W Campbell, MEng; Norrie A McPherson; Tom J Scanlon, BEng, PhD, CEng
Department of Mechanical and Aerospace Engineering 75 Montrose Street University of Strathclyde
Glasgow G1 1XJ
Dear Editors,
I would like to take this opportunity to thank you for considering this paper as it is my first to be submitted for publication. The subject of which is a study of shielding gas composition with respect to side draughts and nozzle diameter. I can conform that this submission is original and has not been submitted for publication anywhere else.
I would like to draw your attention to the close correlation between the computational and experimental validation results and point out that the simplification of the welding arc during computational simulation appears to have a minimal effect on these results.
I look forward to hearing from you in the near future.
Yours faithfully,
Miss Gemma Ramsey
Department of Mechanical and Aerospace Engineering
12/03/12
The Editor
Journal of Materials Processing Technology
Journal Submission
A computational fluid dynamic analysis of the effect of side draughts and nozzle diameter on shielding gas coverage during gas metal arc welding
Reviewer #1
I appreciate you taking the time to read and comment on this text.
Subject Editor
Many thanks for taking the time to read and comment on this manuscript. I have the pleasure of submitting the amended document for your re-consideration. I have identified the modifications you have suggested and have made the following changes to the script.
Abstract:
I understand your comments regarding the first statement and it has been removed in order to avoid the repetition of the title of the paper. Similarly, line 4 has also been removed and the subsequent statement reworded. The phrase ‘as expected’ has also been removed from the text.
After reviewing the manuscript, I concur that the final statement of the abstract is out of place and has also been removed.
Main Text:
I have amended the ‘Conclusion’ section of the manuscript to read ‘Conclusions’ as you suggested.
I have reconsidered the final paragraph of the conclusions section and, taking into account the JMPT is only reporting on past research, have removed this small ending segment from the paper. I feel the conclusions read better without the statement.
Yours faithfully,
Highlights
A simplified computational model and experimental trials correlate closely
A 16 mm nozzle can produce highly concentrated shielding gas columns with diameters of up to 28 mm
Decrease in shielding gas coverage and weld quality as side draught velocity increases Reduction in nozzle diameter increases the shielding gas columns resistance to side
draughts
Critical ratio of shielding gas to side draught velocity decreases as nozzle diameter decreases
1
A computational fluid dynamic analysis of the effect of side
draughts and nozzle diameter on shielding gas coverage
during gas metal arc welding
Ramsey, G.M.1*, Galloway, A.M.1, Campbell, S.W.1 and McPherson, N.A.2, Scanlon, T.J.1
1
Department of Mechanical & Aerospace Engineering, University of Strathclyde, Scotland,
United Kingdom
2
BAE Systems Surface Ships Limited, Glasgow, United Kingdom
*
[email protected] *Manuscript
2
Abstract: Extensive experimental trials were conducted, emulating the conditions modelled, in order to validate the computational fluid dynamic results. Final results demonstrated that a more
constricted nozzle was more effective at creating a stable gas column when subjected to side
draughts. Higher shielding gas flow rates further reduce the gas column’s vulnerability to side
draughts and thus create a more stable coverage. The results have highlighted potential economic
benefits for draught free environments, in which, the shielding gas flow rate can effectively be
reduced.
Keywords: CFD,GMAW,welding nozzle diameter, shielding gas coverage, side draughts
LIST OF SYMBOLS
k turbulence kinetic energy
ε rate of dissipation
µ viscosity
µt turbulent viscosity
Gk generation of turbulence kinetic energy due to mean velocity gradients
Gb generation of turbulence kinetic energy due to buoyancy
YM contribution of the fluctuating dilation in compressible turbulence to the overall
dissipation rate
σk turbulent Prandtl number for turbulence kinetic energy
σε turbulent Prandtl number for rate of dissipation
β thermal expansion coefficient
3
ν kinematic viscosity
ρ density
g gravity
q heat flux
qrad radiative heat flux
hf fluid-side local heat transfer coefficient
hext external heat transfer coefficient
Tw wall surface temperature
Tf local fluid temperature
Text external heat sink temperature
T∞ temperature of radiation source or sink
εext emissivity of the external wall surface
σ Stefan-Boltzmann constant
aP centre coefficient
anb influence coefficient for neighbouring cells
b contribution of the constant part of the source term and boundary conditions
Po total pressure
Ps static pressure
Sk, Sε user defined source terms
C1ε, C2ε, C3ε, constants
Cμ constant
4 INTRODUCTION
The shielding gas is a fundamental component in any gas shielded welding process and, as a
result of individual gas properties, has the ability to significantly influence the appearance and
overall weld quality as demonstrated by Vaidya’s (2002) in depth analysis of the effect of
shielding gas mixtures for semi-automatic welds. The primary purpose of any welding shielding
gas is to protect the molten metal during the arc transfer process and to protect the weld surface
from reacting with atmospheric contaminants during solidification. This is shown in Tani et al.
(2007) through their work investigating the effects of shielding gas in hybrid laser-MIG welding.
In each case, the absence of sufficient quantities of shielding gas will generally result in the
formation of porosity and other defects in the solidified weld and therefore compromise the
quality and integrity of the weld.
Shielding gases are commonly delivered to the welding region in a premixed state in order to
take advantage of the beneficial properties of each gas. Argon-based mixed gases are generally
used as the preferred shielding gas in cases where carbon steels are welded using the GMAW
process. An argon/carbon dioxide (80/20) mixture is a commonly used GMAW shielding gas in
Western Europe, particularly in carbon steel fabrication industries. In such cases, carbon dioxide
is routinely added to an argon-based mixture as it has the ability to stabilize the arc and produce
a more consistent weld than argon on its own as demonstrated by Chae et al. (2008).
The correct shielding gas flow rate can vary considerably and is dependant upon the welding
5
GMAW shielding gas flow rates are in the region 15-20 l/min, although Campbell et al (Under
review) have found that this can be lowered considerably with a flow rate of 6 l/min producing
good quality welds in a draught free environment.It is common for flow rates to be set in excess
of 25 l/min, normally because the welder makes the assumption that more gas means better
protection. However, other studies namely Uttrachi (2007) and Loxton Industries (2010) have
explored the impact of the initial surge of shielding gas, at weld ignition, has on the stability of
the shielding gas column. This effect has been reported to create turbulence in the flow, which,
in turn draws atmospheric gases into the weld region potentially creating defects within the
solidified weld. Lyttle and Stapon (2005) have shown this to also be the case after the initial
surge with flow rates above approximately 23 l/min creating turbulence within the shielding gas
column.
Side draughts present a significant problem to the welding process from both a technical and
economic viewpoint, potentially adversely affecting the shielding gas’s ability to protect the
weld region from contamination by atmospheric gases such as nitrogen and oxygen. To
counteract these effects, there is a generally accepted industrial mindset that more must be better,
and for that reason shielding gas flow rates in the region of 20-25 l/min are typically used when
draughts are present; however there is no scientific evidence to support this action.
Very little published work is available on the specific subject of the application of CFD
modelling to weld shielding gas coverage. A finite element model of a GMAW welding nozzle
was developed by Dreher et al. (2009) (2010) using ANSYS CFX to analyse the effects of
6
work piece. However, there is no literature at present reporting on the use of CFD to model the
problem of side draughts during the GMAW process. The development of this tool could
potentially be of major benefit and, would allow the simulation of potential welding
environments to be evaluated without the need to consistently resort to expensive, time
consuming and often-inconclusive plant trails.
MODEL
The present study investigated the effect that the shielding gas flow rate, side draught velocity
and nozzle outlet diameter have on the shielding gas flow characteristics during GMAW through
the use of CFD modelling. A multi-physics, 3D transient state model was therefore developed for
three different welding torch nozzle diameters using the CFD software Fluent. In order to
validate the CFD model, extensive experimental trials were conducted which replicated the
geometry and welding conditions simulated.
The model geometry was constructed in Gambit, in which, the welding nozzle is positioned with
a 10 mm gap directly above the surface of a 250 x 500 x 8 mm thick plate. The nozzle and plate
are situated within a defined volume of sufficient size to ensure that all flow development was
captured, although the main area of interest which was the 10 mm between the tip of the nozzle
and the plate surface. Fig.1 shows a 12 mm diameter hemisphere positioned directly below the
nozzle which was used to represent the welding arc region. Boundary layers and zones were
defined within the geometry of the model, enabling conditions for each to be set in Fluent.
7
The generated mesh was then imported into Fluent, where the physics of the model were defined.
The energy equation was initiated allowing heat transfer through the fluid and plate to be
analysed. A combined convection and external radiation condition was used to model the heat
transfer from the welding arc to the plate using Equation. 1.
rad f
w
f T T q h
q ( ) hext(Text Tw)ext(T4 Tw4) ……… (1)
The gravitational acceleration components were input enabling buoyancy effects to be
considered. The buoyancy forces were evaluated using Equation.2, a ratio of the Grashof and
Reynolds numbers. 2 2 Re TL g GR
... (2)
Buoyancy contributed strongly to the flow when the ratio in Equation.2 approached unity.
Semi-empirical transport equations (Equation.3 & 4) for the standard k-ε turbulence model were
8 k M b k j k t j i i S Y G G x k x k x k
t
) ( )
( ... (3)
S k C G C G k C x x x
t j k b
t j i i 2 2 3
1 ( )
) ( )
( …………... (4)
The turbulent viscosity was determined by combining the turbulent kinetic energy and the rate of
dissipation as shown in Equation.5.
t C k2 ... (5)
The side draught was modelled as a uniform laminar flow, as this best represented the
experimental validation, by defining a pressure inlet within the fluid volume. This causes a
pressure difference in the model and a stream of air to flow from the pressure inlet to the nozzle.
The streams velocity was related to the total and static pressures through Bernoulli’s equation
(Equation.6). 2 0 2 1 v p
9
The desired side draught velocities were generated by adjusting the total pressure. Shielding gas
flow rates of 5, 10, 15 and 18 l/min through nozzle diameters of 11, 14 and 16 mm were
simulated with 0-8 mph side draughts, with 1 mph increments.
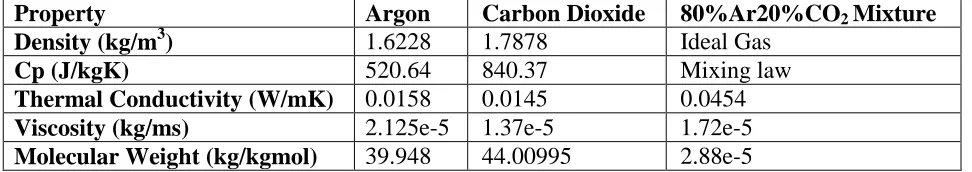
The shielding gas used during this work was 80%Ar/20%CO2, the properties of which were
defined by importing the individual properties of argon and carbon dioxide from Fluent’s
material property database, specifying their respective ratios and applying the rule of mixtures.
These properties are shown in Table 1 and vary with temperature according to a defined
polynomial function. A mass flow inlet condition positioned inside the nozzle allowed the flow
rate of the shielding gas to be set.
Property Argon Carbon Dioxide 80%Ar20%CO2 Mixture Density (kg/m3) 1.6228 1.7878 Ideal Gas
Cp (J/kgK) 520.64 840.37 Mixing law
Thermal Conductivity (W/mK) 0.0158 0.0145 0.0454 Viscosity (kg/ms) 2.125e-5 1.37e-5 1.72e-5 Molecular Weight (kg/kgmol) 39.948 44.00995 2.88e-5
Jönsson et al. (1995) determined that the peak arc temperature during GMAW using a pure argon
shielding gas was approximately 24,000 K. To ensure that the correct arc temperature was fed
into the model, the heat transfer through the plate was found experimentally using K-type
thermocouples to establish the temperature distribution. The results from this were confirmed
through thermal imaging measurements. The arc temperature was then systematically increased
in Fluent until the correct heat transfer from arc to plate was achieved in the model. This
occurred at a value of 32,000 K, higher than that determined by Jönsson et al. However this was
[image:13.612.65.551.349.435.2]10
produce greater penetration as shown by Chae et al. (2008). It was therefore anticipated that
greater penetration would be the result of an increased arc temperature when compared to that of
pure argon.
An interface was defined between the fluid and plate volumes enabling Fluent to compute across
this boundary as their respective meshes slide over one another. Finally, the convergence criteria
of the simulations were set. Following each iteration, the residual sum (Equation.7) for each
variable is computed, which ideally, will tend to zero as the solution converges. In reality, they
reduce to a small value and then become constant.
nb nb nb P
P a b
a ………... (7)
Equation.7 shows the conservation equation after discretisation for a variable φ at a cell P that is
then summated over all cells. The model was considered to have solved when each residual
simultaneously converged to a value of 1e-5.
EXPERIMENTAL VALIDATION
An integral part of this research involved experimentally validating the CFD model results
through extensive trials emulating to the conditions simulated. The experimental validation took
11
Trials were performed on an automatic welding rig that moved the plate at a pre-set velocity of
3.2 mm/s beneath a stationary GMAW nozzle. The nozzle was positioned with a 10 mm gap,
centrally located above a 250 x 500 mm plate. The shielding gas used throughout the
experimentation was 80%Ar/20%CO2.
A pre-calibrated portable arc monitoring system was used throughout the experimentation in
order to accurately measure the arc current and voltage, whilst a second welding monitor was
implemented to measure the shielding gas flow rate; the experimental trials considered shielding
gas flow rates of 5, 10, 15 and 18 l/min. The average welding parameters used throughout were
an arc current and voltage of 210 A and 24.6 V respectively. A flow device capable of producing
a constant laminar stream of air was used to produce a side draught at a consistent velocity. The
velocity of the draught was measured using a pre-calibrated hot-wire anemometer in the region
between the welding nozzle and the plate. The welding region was subjected to side draught
velocities of 0-8 mph, in 1 mph increments. As in the CFD model, experimental data was also
generated for constricted nozzles of diameter 11, 14 and 16 mm. Thermal data was generated
through the use of K-type thermocouples and thermal imaging, enabling a clear view of the
temperature distribution throughout the plate to be established.
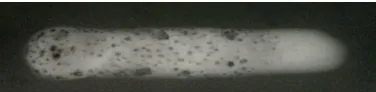
The weld quality was evaluated through a combination of visual and X-ray inspection; the latter
being graded according to the level of porosity present. The X-Ray inspection results are shown
in Tables 2(a-c) where green indicates a pass, yellow indicates dispersed porosity and red
indicates a highly porous weld. Figures 2a and 2b show the typical radiographic images from a
12
(a) 16 mm Side Draught Velocity (mph)
G as Fl o w (l /mi n
) 5 0 1 2 3 4 5 6 7 8
10
15
18
(b) 14 mm Side Draught Velocity (mph)
G as Fl o w (l /mi n )
0 1 2 3 4 5 6 7 8
5
10
15
18
(c) 11 mm Side Draught Velocity (mph)
G as Fl o w (l /mi n )
0 1 2 3 4 5 6 7 8
5 10 15 18 RESULTS
Each model was subjected to a series of simulations using the unsteady solver consisting of each
gas flow rate evaluated at each side draught, a total of 32 simulations per nozzle. The results
were evaluated using contour plots of mass concentration of argon; since the shielding gas
[image:16.612.104.509.70.327.2]modelled was 80 % argon and 20 % carbon dioxide, this meant that a contour of 80 % argon was Fig. 2a: An X-Ray image of a clear weld
[image:16.612.212.400.470.516.2]Table 2a, b and c: Grading of X-Ray inspections for 16, 14 and 11 mm
13
equal to 100 % shielding gas. Fig.3 is a contour plot showing mass concentration of argon for a
16mm nozzle with a shielding gas flow rate of 15 l/min and no side draught. In this instance the
shielding gas achieves a 26 mm diameter column of coverage over the weld. This was measured
by scaling the shielding gas contour plots to actual size enabling the shielding gas column
diameter to be measured directly from the plot as shown in Fig. 3. Tables 3(a-c) show the
diameter of shielding gas coverage for the 16 mm, 14 mm and 11 mm nozzles respectively and
refer to the diameter (mm) over which 100 % shielding gas is present.
14
(a) 16mm Side Draught Speed (mph)
G as Fl o w (l /m in
) 5 28 0 22 1 18 2 0 3 4 0 5 0 0 6 0 7 8 0
10 26 24.8 22 18 14 0 0 0 0
15 26 26 24 21.6 20 16 6 0 0
18 26 26 26 22 21.2 18 14 2 0
(b) 14mm Side Draught Speed (mph)
G as Fl o w (l /m in )
0 1 2 3 4 5 6 7 8
5 26.8 26.8 22 17.2 12 0 0 0 0
10 26 25.2 23.2 20.8 20 18 14.4 6.8 2
15 23.6 23.6 23.6 22 21.2 20 18.4 17.6 16 18 22.8 22.8 22.8 22 21.2 20 19.2 18 18
(c) 11mm Side Draught Speed mph)
G as Fl o w (l /m in )
0 1 2 3 4 5 6 7 8
5 26.4 26.4 22 18.4 17.2 10.8 0 0 0
10 25.2 25.2 24.4 22 21.6 20.4 18.8 17.6 15.6 15 23.2 23.2 23.2 22.4 22.4 22 20.8 20.8 20.4 18 22.8 22.8 22.8 22.8 22.4 22 21.6 21.6 21.6
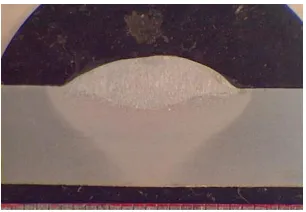
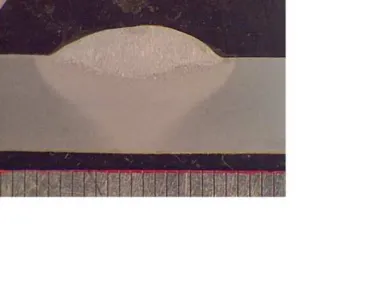
A weld macrograph was produced for a section of weld generated in the experimental trials as
shown in Fig.4; the weld width (15 mm) was then used for the generation of a grading system,
which was subsequently applied to the CFD results. All gas columns of diameter 15 mm and
above were classified as good coverage (green), between 10-15 mm coverage was reduced
[image:18.612.116.496.69.323.2]quality coverage (yellow) and below 10 mm coverage was of poor quality (red).
Table 3a, b and c: The diameter (mm) and classification of shielding gas coverage for 16, 14 and 11 mm nozzles
[image:18.612.230.383.404.510.2]15
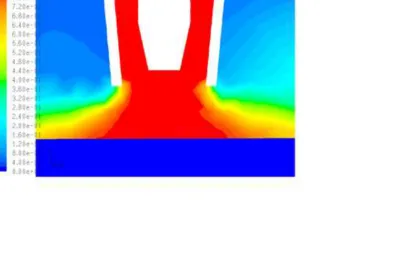
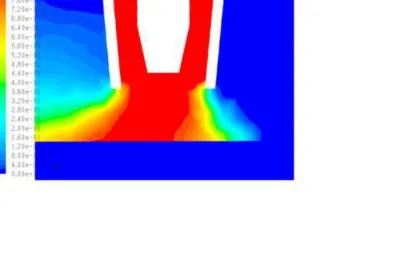
The model presented good welds to have the shielding gases 100 % coverage centred directly
below the nozzle. As the draught velocity was increased the 100 % coverage decreases and drifts
off centre exposing one side of the weld as shown in Fig. 5(a-f). Eventually, the side draught
becomes strong enough to prevent adequate coverage occurring. The side draught velocity at
which this occurs increases as nozzle diameter decreases.
(a)
(b)
(c)
(d)
(e)
(f)
16
From Table 3a, the 16 mm nozzle results followed a pattern showing that as the gas flow rate
was increased, the more resistance the shielding gas column had to side draughts, with the 15
l/min and 18 l/min gas flow rates able to produce good welds up to draughts of 5 mph. From
Table 3b, the 14 mm nozzle followed a similar pattern. As with the other diameters, higher gas
flow rates from the 11 mm nozzle showed more resistance to side draughts. The 10, 15 and 18
l/min flow rates each managed to withstand all the draughts to produce good welds. Fig.5
compares the results of 1, 5 and 8 mph side draughts on the 16 and 11 mm nozzles.
The change in gas flow distribution as the nozzle diameter decreases is noticeable from Tables
3(a-c). The 11 mm diameter nozzle has been shown to provide the greatest resistance to side
draughts of the three nozzle diameters considered. This is due to the principle of the conservation
of mass. The smaller the nozzle exit diameter, the higher the velocity of the exiting gas as
demonstrated in Fig. 6a and b. The 16 mm nozzle generates up to 5 mph shielding gas velocities
[image:20.612.76.481.483.605.2]through its exit while the 11 mm nozzle generates between 10-18 mph shielding gas velocities.
17
The faster the gas exits the nozzle, the greater the draught needed to push it off course. Although
the coverage of 22.8 mm, from the 11 mm nozzle at 18 l/min with no draught, is low when
compared to the 26 mm coverage the 16 mm nozzle manages, the 11 mm nozzle is able to
maintain that level of coverage from 0 to 8 mph. The 16 mm nozzle is more susceptible to the
draught and is unable to maintain the same coverage at the same flow rates.
A critical ratio of shielding gas to side draught velocity can be determined, in doing so
presenting the pass-fail boundary condition for each nozzle diameter. A ratio of approximately
2-2.5 has been determined for a conventional 16 mm nozzle, whilst ratios of approximately 1.5 and
0.8 for the 14 and 11 mm nozzles respectively. The critical ratio has been shown to decrease in
line with the outlet diameter of the nozzle, thus highlighting the effectiveness of the reducing the
nozzle diameter.
The results for the experimental validation are shown in Tables 2(a-c). The results follow the
same trends identified through the CFD model showing that as the shielding gas flow rate
increased the gas columns resistance to side draughts also increased. The results also clearly
indicate that the 11 mm nozzle was capable of producing good, clear welds under higher
velocities of side draught than the 16 mm nozzle. This finding is significant as it presents the
potential to make welding a more efficient process in terms of shielding gas usage, therefore
18 CONCLUSIONS
A CFD model has been developed to determine the effects of nozzle diameter and side draughts
on the shielding gas flow coverage during GMAW. An economic benefit to industry of
constricting nozzle diameter has been identified allowing for a lower shielding gas flow rate to
be implemented whilst maintaining side draught resistance. The conclusions may be summarised
as follows:
1. It was shown that the simplified computational model and experimental trials correlate
closely through the use of their respective grading systems. The results show that a good
shielding gas coverage as determined in the CFD model translated into a good quality
weld determined by X-Ray inspection of the experimental trials.
2. The CFD model has demonstrated the ability of a 16 mm nozzle to produce highly
concentrated shielding gas columns with diameters of up to 28 mm. From the
experimental trails this can be seen as an excessive amount of coverage. A good quality
weld was produced from shielding gas columns as small as 15 mm.
3. Both the CFD model and experimental trials have highlighted the significant effect side
draughts have on shielding gas columns and consequently weld quality. As anticipated,
there is a progressive decrease in the shielding gas coverage and quality as side draught
19
4. A reduction in nozzle diameter has been found to increase the shielding gas columns
resistance to side draughts. The model predicted that an 11 mm nozzle was capable of
maintaining a shielding gas column even at higher side draughts. This was validated
through X-Rays of the corresponding experimental trials showing good quality welds.
5. The critical ratio of shielding gas to side draught velocity is shown to decrease with a
reduction in the nozzle outlet diameter. This reinforces the effectiveness of reducing the
nozzle outlet diameter when subjected to side draughts.
ACKNOWLEDGEMENTS
The author would like to thank BAE Systems for its support and contribution to this work
through use of facilities and supplying materials.
ROLE OF THE FUNDING SOURCE
BAE Systems provided the materials required for the practical portion of this study, as well as
x-ray analysis facilities. This paper was reviewed by N. McPherson, a BAE Systems engineer who
20 REFERENCES
G. Tani, G. Campana, A. Fortunato, A. Ascari: ‘The Influence of Shielding Gas in Hybrid
Laser-MIG Welding.’Applied Surface Science., 2007, 253, 8050-8053.
G.D. Uttrachi, (2007) ‘GMAW Shielding Gas Flow Control Systems’. Welding Journal.,
2007, 86(4), 22-23.
H.B. Chae, C.H. Kim, J.H. Kim, S. Rhee: ‘The effect of shielding gas composition in CO2 laser-gas metal arc hybrid welding.’ IMechE Engineering Manufacture., 2008, 222B, 1315-1324.
K. Lyttle, G. Stapon: ‘Simplifying Shielding Gas Selection.’ Practical Welding Today., 2005,
9, No. 1.
Loxton Industries: ‘New Welding Gas Innovation’. Australasian Welding Journal., 2010,
55(1), 10-11.
M. Dreher, U. Füssel, M. Schnick, M. Hertel: ‘Numerical simulation of the shielding gas flow with GMA welding and options of validation by diagnostics,’ Materials Science and
21
M. Dreher, U. Füssel, M. Schnick: ‘Numerical optimization of gas metal arc welding torches
using ANSYS CFX Proc.’ 63rd Annual Assembly and Int. Conf. of the Int. Institute of
Welding, Istanbul, Turkey, 11-17 July 2010.
P.G. Jönsson, T.W. Eagar, J. Szekely: ‘Heat and metal transfer in gas metal arc welding using argon and helium.’ Metallurgical and Materials Transactions B.,1995, 26B, 383-395.
S.W. Campbell, A.M. Galloway, N.A. McPherson: ‘Techno-economic evaluation of reducing
shielding gas consumption in GMAW whilst maintaining weld quality.’ International
Journal for Advanced Manufacturing Technology. Under review.
V.V. Vaidya: ‘Theory and practice of shielding gas mixtures for semi-automatic welds.’
Welding Journal., 2002, Dec, 43-48.
Figure 1
Figure 2a
Figure 2b
Figure 3
Figure 4
Figure 5a
Figure 5b
Figure 5c
Figure 5d
Figure 5e
Figure 5f
Figure 6a
Figure 6b
Table 1
Table 2
Table 3