symmetry
S S
Article
A Simple Method for Measuring the Bilateral
Symmetry of Leaves
Peijian Shi1, Xiao Zheng1, David A. Ratkowsky2, Yang Li3,*, Ping Wang1and Liang Cheng1,*
1 Co-Innovation Centre for Sustainable Forestry in Southern China, College of Biology and the Environment,
Bamboo Research Institute, Nanjing Forestry University, Nanjing 210037, China; [email protected] (P.S.); [email protected] (X.Z.); [email protected] (P.W.)
2 Tasmanian Institute of Agriculture, University of Tasmania, Private Bag 98, Hobart, Tasmania 7001,
Australia; [email protected]
3 Department of Mathematics and Statistics, University of Minnesota Duluth, Duluth, MN 55812, USA
* Correspondence: [email protected] (Y.L.); [email protected] (L.C.); Tel.: +1-218-726-8377 (Y.L.); +86-25-8542-7787 (L.C.)
Received: 21 March 2018; Accepted: 16 April 2018; Published: 18 April 2018
Abstract:Many plant leaves exhibit bilateral symmetry, but such symmetry has rarely been measured because of the lack of practical methods. We propose a simple method for achieving the above objective. A leaf is divided into left and right sides, and several equally-sized strips are generated to intersect each side of that leaf to generate pairwise left and right sub-regions. A standardized index (SI) for measuring bilateral symmetry is built based on the left–right areal differences of those sub-regions. The leaves of 10 species of plants were sampled for testing the method’s validity. Based on the experimental data, we compared the root-mean-squared error (RMSE), SI, and areal ratio (AR) of the left side to the right side of the leaf. The SI measures the bilateral symmetry of plant leaves well, and it is better than the RMSE and AR for eliminating the effect of leaf size on the goodness of fit. The SI proposed here is the best indicator for evaluating the degree of bilateral symmetry and can be potentially used for comparing the difference in the bilateral symmetry of leaves of different plants.
Keywords:leaf area; leaf size; mirror image; spatstat; standardized index
1. Introduction
Bilateral symmetry in biology has attracted much attention, and some methods for measuring the bilateral symmetry of objects have been proposed [1–9]. The leaf is the most important organ of plants for photosynthesis, and leaf shape has been demonstrated to be linked to photosynthetic rates and temperature optima in some plants [10]. Many plants have leaves that exhibit bilateral symmetry. Thompson [1] studied the leaf shape ofBegonia daedaleaLem. and proposed a hypothesis that the left side of the lamina is proportional to its right side. This hypothesis was confirmed by using the experimental data ofBegonia loranthoidesHook. f. [11]. There are two kinds of bilateral symmetry: matching symmetry and object symmetry [5]. The former denotes the symmetry of two body parts of the same creature (e.g., left and right wings of a bird, left and right hands of a person), and the latter denotes that of two sides of the same organ (e.g., left and right sides of a human face, left and right sides of a leaf). A method for measuring bilateral symmetry was developed in Mardia et al. [5], which requires measuring several paired landmarks of the object and involves a complex calculation based on Procrustes superimposition. There is some shape information lost in measuring bilateral symmetry, because some edge points (non-landmarks) are neglected. The leaf shapes of some trees are rather complex (e.g., the toothed leaf), and there may be many landmarks that will be too time-consuming to measure in practice. In addition, for the leaf which has an edge that forms a smooth arc (e.g.,
Symmetry2018,10, 118 2 of 10
the linear, elliptic leaves), it is difficult to find the paired landmarks on the left and right sides of the leaf. Shi et al. [12] provided a method for automatically extracting the planar coordinates of an object’s edge using an M file in MATLAB (version≥2009a), which provides a possibility to measure directly the extent of bilateral symmetry or asymmetry. In this paper, we will propose a simple approach to measure the bilateral symmetry of the leaves of 10 plant species and show the difference in leaf bilateral symmetry of these plants. Considering that there is a large variation in leaf size among different leaves of the same species or among those from different species of plants [13], we attempt to provide an indicator of bilateral symmetry that is unrelated to leaf size in order to compare the difference in the bilateral symmetrical extent among plants with different leaf sizes. Because leaf shape and leaf size are hypothesized to associate with the photosynthetic capacity of plants, we will discuss whether the bilateral symmetrical extent can affect the photosynthetic rate of plants.
2. Materials and Methods
2.1. Materials
The leaves of nine species of plants were collected from the Nanjing Forestry University campus (118◦4805200 E, 32◦0403700 N), and leaves were collected from one tree species from the Nanjing Zhongshan Botanical Garden (118◦50019” E, 32◦0300900N), Jiangsu Province, China. The Latin names, collection times, sites, and sample sizes of the plants are listed in Table1. Figures1and2intuitively exhibit the leaf shape of the ten species of plants. Four bamboo species came from the same genus, and the other trees belong to various other plant families. These plants were chosen because they were easy to obtain and their leaves exhibited different extents of bilateral symmetry. The first four bamboo species were selected to check whether there were significant differences in the extent of bilateral symmetry among closely related species of the same genus. The investigation times were chosen after the leaves had matured and changed little in shape.
Symmetry 2018, 10, x FOR PEER REVIEW 2 of 10
(e.g., the linear, elliptic leaves), it is difficult to find the paired landmarks on the left and right sides of the leaf. Shi et al. [12] provided a method for automatically extracting the planar coordinates of an object’s edge using an M file in MATLAB (version ≥2009a), which provides a possibility to measure directly the extent of bilateral symmetry or asymmetry. In this paper, we will propose a simple approach to measure the bilateral symmetry of the leaves of 10 plant species and show the difference in leaf bilateral symmetry of these plants. Considering that there is a large variation in leaf size among different leaves of the same species or among those from different species of plants [13], we attempt to provide an indicator of bilateral symmetry that is unrelated to leaf size in order to compare the difference in the bilateral symmetrical extent among plants with different leaf sizes. Because leaf shape and leaf size are hypothesized to associate with the photosynthetic capacity of plants, we will discuss whether the bilateral symmetrical extent can affect the photosynthetic rate of plants.
2. Materials and Methods
2.1. Materials
[image:2.595.160.438.441.724.2]The leaves of nine species of plants were collected from the Nanjing Forestry University campus (118°48′52″ E, 32°04′37″ N), and leaves were collected from one tree species from the Nanjing Zhongshan Botanical Garden (118°50′19″ E, 32°03′09″ N), Jiangsu Province, China. The Latin names, collection times, sites, and sample sizes of the plants are listed in Table 1. Figures 1 and 2 intuitively exhibit the leaf shape of the ten species of plants. Four bamboo species came from the same genus, and the other trees belong to various other plant families. These plants were chosen because they were easy to obtain and their leaves exhibited different extents of bilateral symmetry. The first four bamboo species were selected to check whether there were significant differences in the extent of bilateral symmetry among closely related species of the same genus. The investigation times were chosen after the leaves had matured and changed little in shape.
Figure 1. Examples of four bamboo species: (a) species 1; (b) species 2; (c) species 3; and (d) species 4 (see Table 1 for details). The leaf base for every bamboo species lies on the coordinate origin.
Symmetry2018,10, 118 3 of 10
[image:3.595.148.449.88.551.2]Symmetry 2018, 10, x FOR PEER REVIEW 3 of 10
Figure 2. Examples of six species of trees: (a) species 5; (b) species 6; (c) species 7; (d) species 8; (e) species 9; and (f) species 10 (see Table 1 for details). The leaf base for every tree species lies on the coordinate origin.
Table 1. Plant species, sample size, and sampling time of leaves.
Species Code Latin Name Family Leaves Sampling Time
1 Indocalamus pedalis (Keng) P. C. Keng Poaceae 100 early July 2014
2 Indocalamus barbatus McClure Poaceae 100 early July 2014
3 Indocalamus victorialis P. C. Keng Poaceae 100 early July 2014 4 Indocalamus pumilus Q. H. Dai et C. F. Keng Poaceae 100 early July 2014 5 Chimonanthus praecox (Linn.) Link Calycanthaceae 72 20 October 2017
6 Ginkgo biloba L. Ginkgoaceae 84 20 October 2017
7 Aucuba japonica Thunb. var. variegata D’ombr. Cornaceae 100 20 October 2017
8 Liriodendron tulipifera L. Magnoliaceae 100 11 October 2017
9 Phoebe sheareri (Hemsl.) Gamble Lauraceae 100 26 October 2017
[image:3.595.83.516.641.761.2]10 Pittosporum tobira (Thunb.) Ait. Pittosporaceae 100 27 October 2017 Figure 2.Examples of six species of trees: (a) species 5; (b) species 6; (c) species 7; (d) species 8; (e) species 9; and (f) species 10 (see Table1for details). The leaf base for every tree species lies on the coordinate origin.
Table 1.Plant species, sample size, and sampling time of leaves.
Species Code Latin Name Family Leaves Sampling Time
1 Indocalamus pedalis(Keng) P. C. Keng Poaceae 100 early July 2014
2 Indocalamus barbatusMcClure Poaceae 100 early July 2014
3 Indocalamus victorialisP. C. Keng Poaceae 100 early July 2014
4 Indocalamus pumilusQ. H. Dai et C. F. Keng Poaceae 100 early July 2014
5 Chimonanthus praecox(Linn.) Link Calycanthaceae 72 20 October 2017
6 Ginkgo bilobaL. Ginkgoaceae 84 20 October 2017
7 Aucuba japonica Thunb. var. variegataD’ombr. Cornaceae 100 20 October 2017
8 Liriodendron tulipiferaL. Magnoliaceae 100 11 October 2017
9 Phoebe sheareri(Hemsl.) Gamble Lauraceae 100 26 October 2017
Symmetry2018,10, 118 4 of 10
2.2. Methods
Each leaf was scanned using an HP Scanjet 4850 photo scanner, and the image was saved in its bitmap format. The planar coordinates were extracted using the ‘profile’ function developed based on MATLAB (see [12] for details). Then, the leaf was divided into two parts from leaf apex to base: the upper and lower sides (representing the left and right sides of a leaf). We used same-sized strips to intersect the leaf (Figure3). Letndenote the number of strips, and letAiandBirepresent the upper and lower intersecting areas, respectively, of thei-th strip with the leaf. The extent of bilateral symmetry can be measured using the following two equations:
RMSE=
s n
∑
i=1(Ai−Bi)2/n (1)
SI= 1
n n
∑
i=1|Ai−Bi| Ai+Bi
(2)
Symmetry 2018, 10, x FOR PEER REVIEW 4 of 10
2.2. Methods
Each leaf was scanned using an HP Scanjet 4850 photo scanner, and the image was saved in its bitmap format. The planar coordinates were extracted using the ‘profile’ function developed based on MATLAB (see [12] for details). Then, the leaf was divided into two parts from leaf apex to base: the upper and lower sides (representing the left and right sides of a leaf). We used same-sized strips to intersect the leaf (Figure 3). Let n denote the number of strips, and let Ai and Bi represent the upper
and lower intersecting areas, respectively, of the i-th strip with the leaf. The extent of bilateral symmetry can be measured using the following two equations:
RMSE = √∑(𝐴𝑖− 𝐵𝑖)2/𝑛 𝑛
𝑖=1
(1)
SI =1 𝑛∑
|𝐴𝑖− 𝐵𝑖| 𝐴𝑖+ 𝐵𝑖 𝑛
𝑖=1
[image:4.595.221.379.214.463.2](2)
Figure 3. Illustration of how to divide a leaf into parts using 10 strips. In practice, n larger than 10 was used, which can better reflect the information regarding bilateral symmetry. In the present study, n is 999.
It is apparent that the smaller the root-mean-squared error (RMSE) or standardized index (SI), the greater the bilateral symmetrical degree of the leaf. If n is large, then the extent of asymmetry can be exhibited clearly. In the present study, n was set to be 999. When the leaf sizes among a group of leaves are approximately equal, RMSEs can reflect well the difference in the bilateral symmetry of the individual leaves. However, this indicator might be invalid when there is a large variation in leaf size. SI can diminish the effect of leaf size on the measurement of bilateral symmetry. We checked whether leaf size could significantly affect the calculation of RMSE (or SI) by using a test of the correlation between RMSE (or SI) and leaf area for every plant species. In addition, we used a third index as the reference for measuring bilateral symmetry [3]:
AR = 𝐴/𝐵 (3)
where A represents the area of the upper (left) side of a leaf, and B represents the area of the lower (right) side of the leaf. AR represents the areal ratio of A to B.
To compare the difference of the extent of bilateral symmetry among the plants, Tukey’s honest significant difference (HSD) test was carried out. The coefficient of variation (CV = mean/standard deviation) for every indicator was also calculated to evaluate the extent of the variation of the bilateral symmetry among the different plant species. R software (version 3.2.2) [14] was used to perform statistical analysis and draw graphs. The ‘area.owin’ and ‘setminus.owin’ functions in the package ‘spatstat’ (version 1.43-0.025) were used to calculate the area of the intersection between a strip and a
Figure 3.Illustration of how to divide a leaf into parts using 10 strips. In practice,nlarger than 10 was used, which can better reflect the information regarding bilateral symmetry. In the present study, nis 999.
It is apparent that the smaller the root-mean-squared error (RMSE) or standardized index (SI), the greater the bilateral symmetrical degree of the leaf. Ifnis large, then the extent of asymmetry can be exhibited clearly. In the present study,nwas set to be 999. When the leaf sizes among a group of leaves are approximately equal, RMSEs can reflect well the difference in the bilateral symmetry of the individual leaves. However, this indicator might be invalid when there is a large variation in leaf size. SI can diminish the effect of leaf size on the measurement of bilateral symmetry. We checked whether leaf size could significantly affect the calculation of RMSE (or SI) by using a test of the correlation between RMSE (or SI) and leaf area for every plant species. In addition, we used a third index as the reference for measuring bilateral symmetry [3]:
AR=A/B (3)
whereArepresents the area of the upper (left) side of a leaf, andBrepresents the area of the lower (right) side of the leaf. AR represents the areal ratio ofAtoB.
Symmetry2018,10, 118 5 of 10
statistical analysis and draw graphs. The ‘area.owin’ and ‘setminus.owin’ functions in the package ‘spatstat’ (version 1.43-0.025) were used to calculate the area of the intersection between a strip and a leaf [15]. The ‘HSD.test’ function in the package ‘agricolae’ (version 1.2-4) was used to perform Tukey’s HSD test [16]. An R function ‘bilat.measure’ was developed to calculate the RMSE, SI, and AR (in the online Supplementary Materials).
3. Results and Discussion
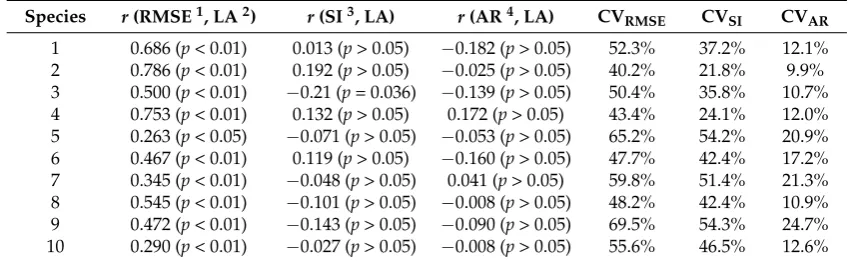
[image:5.595.84.512.328.459.2]There are significant differences in leaf area or leaf length, because the plants were randomly chosen on the Nanjing Forestry University campus, belonging to different taxa (Figure4a,b). RMSE and SI measure different aspects of bilateral symmetry (Figure4c,d). RMSE is significantly related to leaf area, while SI is not (Table2). In general, if the areal ratio (AR) of the left side to the right side is about 1, the leaf is approximately bilaterally symmetric. The areal ratio is also not a function of leaf area (Figure4e and Table2). In some cases, a ratio that is close to unity might deviate from bilateral symmetry (Figure4f). If the SI value is smaller, the areal ratio must be lower; however, the converse is not true. It appears that SI is the best indicator to measure the bilateral symmetry of these three indices.
Table 2.Correlation coefficients (r) and coefficients of variation (CV).
Species r(RMSE1, LA2) r(SI3, LA) r(AR4, LA) CV
RMSE CVSI CVAR
1 0.686 (p< 0.01) 0.013 (p> 0.05) −0.182 (p> 0.05) 52.3% 37.2% 12.1% 2 0.786 (p< 0.01) 0.192 (p> 0.05) −0.025 (p> 0.05) 40.2% 21.8% 9.9% 3 0.500 (p< 0.01) −0.21 (p= 0.036) −0.139 (p> 0.05) 50.4% 35.8% 10.7% 4 0.753 (p< 0.01) 0.132 (p> 0.05) 0.172 (p> 0.05) 43.4% 24.1% 12.0% 5 0.263 (p< 0.05) −0.071 (p> 0.05) −0.053 (p> 0.05) 65.2% 54.2% 20.9% 6 0.467 (p< 0.01) 0.119 (p> 0.05) −0.160 (p> 0.05) 47.7% 42.4% 17.2% 7 0.345 (p< 0.01) −0.048 (p> 0.05) 0.041 (p> 0.05) 59.8% 51.4% 21.3% 8 0.545 (p< 0.01) −0.101 (p> 0.05) −0.008 (p> 0.05) 48.2% 42.4% 10.9% 9 0.472 (p< 0.01) −0.143 (p> 0.05) −0.090 (p> 0.05) 69.5% 54.3% 24.7% 10 0.290 (p< 0.01) −0.027 (p> 0.05) −0.008 (p> 0.05) 55.6% 46.5% 12.6% 1RMSE: root-mean-squared error;2LA: leaf area;3SI: standardized index for bilateral symmetry;4AR: areal ratio
of the left side to the right side of a leaf.
For the four species within the same genusIndocalamus, the absolute values of SI are not the lowest in comparison with those of the other plant species, but the coefficients of variations of SI of the bamboo plants are the lowest. This demonstrates the evolutionary stability of the leaf shape in bamboo plants. In fact, bamboo leaves have been shown to approximate the bilateral symmetry that can be described generally by the simplified Gielis equation [8,17]. The leaves of species 6 (G. biloba) exhibit the greatest asymmetry in shape. Although the leaves of species 10 (P. tobira) exhibit the greatest bilateral symmetry, the variation of bilateral symmetry is not lower than the other plants (Figure4
Symmetry2018,10, 118 6 of 10
Symmetry 2018, 10, x FOR PEER REVIEW 6 of 10
[image:6.595.152.444.87.536.2]not found a significant correlation for any of these species (unpublished data). The results further support the above hypothesis that the extent of bilateral symmetry of leaves is not associated with photosynthetic rate, which is different from the previous report in [22]. Although there are differences in the extent of bilateral symmetry among the leaves of the same plant species, the medians of the areal ratios are approximately 1 (Figure 4e). This means that in the same species, some leaves exhibit left deviation, whereas others do the opposite. Although the bilateral symmetry or bilateral asymmetry of many plants is radically determined by genes [23], environmental factors, especially light, can significantly change leaf shape and symmetry [22]. It has been demonstrated that leaf size can be significantly affected by temperature [13], but evidence that temperature can influence the bilateral symmetry of leaves is still lacking.
Figure 4. Comparison of leaf size and bilateral symmetry among 10 species of plants. The Latin names denoted by ‘species code’ on the x-axis can be found in Table 1. The labels on the y-axis represent leaf area (a); leaf length (b); root mean squared error (c); standardized index for bilateral symmetry (d); and areal ratio of the left side to the right side of a leaf (e); respectively. The areal ratios of the left side to the right side for all the leaves from the 10 species of plants were plotted against the corresponding standardized indices for bilateral symmetry (f). The letters A, B, C, D, E, F, and G are used to represent the significance of differences among different species; species sharing a common letter are not significantly different at the 0.05 significance level.
Figure 4.Comparison of leaf size and bilateral symmetry among 10 species of plants. The Latin names denoted by ‘species code’ on the x-axis can be found in Table1. The labels on the y-axis represent leaf area (a); leaf length (b); root mean squared error (c); standardized index for bilateral symmetry (d); and areal ratio of the left side to the right side of a leaf (e); respectively. The areal ratios of the left side to the right side for all the leaves from the 10 species of plants were plotted against the corresponding standardized indices for bilateral symmetry (f). The letters A, B, C, D, E, F, and G are used to represent the significance of differences among different species; species sharing a common letter are not significantly different at the 0.05 significance level.
There is a power-law relationship between leaf dry weight (LW) and leaf area (LA): LW =
Symmetry2018,10, 118 7 of 10
(a representative leaf trait that can reflect photosynthetic capacity) for two species of existing tulip trees (each species with >200 leaves), their hybrid (also with >200 leaves), and ten geographical populations ofParrotia subaequalis(H.T. Chang) R.M. Hao & H.T. Wei (each with 150 leaves). We have not found a significant correlation for any of these species (unpublished data). The results further support the above hypothesis that the extent of bilateral symmetry of leaves is not associated with photosynthetic rate, which is different from the previous report in [22]. Although there are differences in the extent of bilateral symmetry among the leaves of the same plant species, the medians of the areal ratios are approximately 1 (Figure4e). This means that in the same species, some leaves exhibit left deviation, whereas others do the opposite. Although the bilateral symmetry or bilateral asymmetry of many plants is radically determined by genes [23], environmental factors, especially light, can significantly change leaf shape and symmetry [22]. It has been demonstrated that leaf size can be significantly affected by temperature [13], but evidence that temperature can influence the bilateral symmetry of leaves is still lacking.
Although there is no relationship between SI and leaf size, it is not known whether leaf size can affect the variation of the extent of bilateral symmetry. For every species, we divided leaves into three groups according to their sizes (i.e., leaf areas) and checked whether the coefficient of variation in the SI values in the first group (associated with the smallest 1/3 leaf areas) was significantly different from that in the third group (associated with the largest 1/3 leaf areas). We used the bootstrap percentile method [24] to test the difference significance in the CVs of the SI values between the two groups. Except for species 2, the remaining nine species of plants did not show a significant difference in CVs of the SI values between two groups with unequal leaf sizes (not shown). This means that the degree of variation of the bilateral symmetry of most of the plants studied here is also unrelated to leaf size. In ecology, there is another important power-law relationship between mean (M) and variance (V) in population densities of animals or plants in space or in time: V=αMβ, where the estimate
Symmetry2018,10, 118 8 of 10
Symmetry 2018, 10, x FOR PEER REVIEW 7 of 10
Although there is no relationship between SI and leaf size, it is not known whether leaf size can affect the variation of the extent of bilateral symmetry. For every species, we divided leaves into three groups according to their sizes (i.e., leaf areas) and checked whether the coefficient of variation in the SI values in the first group (associated with the smallest 1/3 leaf areas) was significantly different from that in the third group (associated with the largest 1/3 leaf areas). We used the bootstrap percentile method [24] to test the difference significance in the CVs of the SI values between the two groups. Except for species 2, the remaining nine species of plants did not show a significant difference in CVs of the SI values between two groups with unequal leaf sizes (not shown). This means that the degree of variation of the bilateral symmetry of most of the plants studied here is also unrelated to leaf size.
In ecology, there is another important power-law relationship between mean (M) and variance (V) in population densities of animals or plants in space or in time: V =αMβ, where the estimate of β
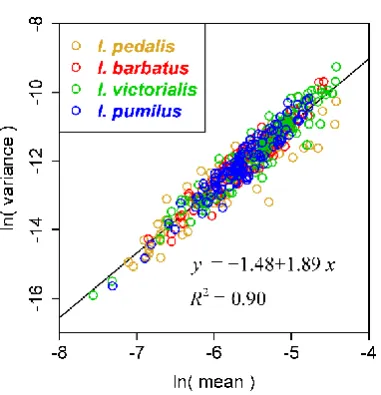
[image:8.595.204.395.84.282.2]usually ranges from 1 to 2 [25–27]. This mean–variance relationship was referred to as Taylor’s power law [26]. There are many biological and abiotic explanations about the empirical range of β’s estimate [26,28–29]. Our recent study shows thatthe exponent βactually reflects the variation degree in energy distribution or energy release among statistical units [29]. The present study is also valuable for demonstrating this hypothesis. Photosynthesis of plants is actually a process of transferring solar energy to bioenergy. The leaf arrangement of plants can significantly affect light capture, and light has vital influence on leaf shape, size, and symmetry [22,30]. The unsheltered part of a leaf usually has higher efficiency in utilizing light than the part that is sheltered by the upper leaves [31], which might lead to bilateral asymmetry of the leaf. It can be deemed as the difference in energy distribution (for maximizing the utilization of light resource) among leaves. The ‘bilat.measure’ function developed here can provide the upper-lower areal difference between the intersecting parts of a leaf and a strip. For a leaf, we can obtain the mean and variance of several areal differences (999 differences in the present study). There are many leaves for any species of plant, so a mean–variance dataset can be used to fit Taylor’s power law. Using the log-transformed data (natural logarithm) of mean and variance for four bamboo species from Indocalamus, a linear relationship was confirmed (Figure 5). The exponent’s estimate is 1.89 ± 0.03 (p < 0.01), which lies in the interval (1, 2). This result is in accord with previous reports on the range of β’s estimate for other study objects [25–29]. It is valuable to check whether there is a relationship between Taylor’s exponent and the extent of bilateral symmetry among different species. However, it is not the main topic of the present study. In addition, as only four species of bamboos were sampled, we did not check this. It merits further investigation using more species within the same taxon. In general, biomass is better than area in depicting Taylor’s power law because biomass is a good indicator for energy [29]. However, leaf weight can be expressed as a power function of leaf area for many plants [18,19]. Therefore, it is appropriate to check Taylor’s power law using the areal differences.
Figure 5.Taylor’s power law between mean and variance of areal differences between upper and lower parts of leaves. A leaf was divided into upper and lower sides. Then, there are two intersecting parts between a leaf and a strip. For a leaf, 999 strips were produced. Then, there are 999 intersecting parts for the upper side of a leaf with these strips, and the same number for the lower side with these strips. Thus, there are 999 areal differences between corresponding upper and lower intersecting parts. For a leaf, the mean and variance were obtained based on the absolute values of these differences. Each open circle represents a leaf. Different colors represent different bamboo species.
4. Conclusions
We developed a new simple indicator, SI, for measuring the extent of bilateral symmetry of plant leaves. This indicator is independent of leaf size, which facilitates the comparison of differences in the leaf shape of different plants. The comparison of the coefficients of variation in SI of the plants studied indicates that bamboo plants have more stable leaf shapes than the dicotyledonous and gymnospermous trees investigated. The present study is also meaningful to check the influence of the extent of leaf bilateral symmetry on the photosynthetic rate of plants and to explore the effect of light on the degree of variation of the energy budget in leaves. The method is also applicable for measuring the bilateral symmetrical extent of other objects (e.g., the planar projections of fishes, seeds, and tree-ring cross sections).
Supplementary Materials:The following are available online athttp://www.mdpi.com/2073-8994/10/4/118/s1. Table S1: Calculation results of the bilateral symmetry extents for the leaves of 10 species of plants; Computer Code: R functions for calculating the extent of bilateral symmetry.
Acknowledgments:This work was financially supported by the National Natural Science Foundation of China (No. 31400348) and the Priority Academic Program Development of Jiangsu Higher Education Institutions.
Author Contributions:Peijian Shi and Xiao Zheng contributed equally to this work; Xiao Zheng, Ping Wang, and Liang Cheng carried out the work of leaf collection; Peijian Shi, David A. Ratkowsky, and Yang Li proposed the methods, analyzed the data, and wrote the manuscript. All authors read and commented on the manuscript.
Conflicts of Interest:The authors declare no conflict of interest.
References
1. Thompson, D.W.On Growth and Form; Cambridge University Press: London, UK, 1917. 2. Van Valen, L. A study of fluctuating asymmetry.Evolution1961,16, 125–142. [CrossRef]
3. Palmer, A.R.; Strobeck, C. Fluctuating asymmetry: Measurement, analysis, patterns.Ann. Rev. Ecol. Syst.
1986,17, 391–421. [CrossRef]
4. Fischer, C.; Neuhaus, G. Influence of auxin on the establishment of bilateral symmetry in monocots.Plant J.
Symmetry2018,10, 118 9 of 10
5. Mardia, K.V.; Bookstein, F.L.; Moreton, I.J. Statistical assessment of bilateral symmetry of shapes.Biometrika
2000,87, 285–300. [CrossRef]
6. Klingenberg, C.P.; Barluenga, M.; Meyer, A. Shape analysis of symmetric structures: quantifying variation among individuals and asymmetry.Evolution2002,56, 1909–1920. [CrossRef] [PubMed]
7. Klingenberg, C.P. Analyzing fluctuating asymmetry with geometric morphometrics: Concepts, methods, and applications.Symmetry2015,7, 843–934. [CrossRef]
8. Gielis, J.The Geometrical Beauty of Plants; Atlantis Press: Paris, France, 2017. [CrossRef]
9. Tuci´c, B.; Budeˇcevi´c, S.; Jovanovi´c, S.M.; Vuleta, A.; Klingenberg, C.P. Phenotypic plasticity in response to environmental heterogeneity contributes to fluctuating asymmetry in plants: first empirical evidence. J. Evol. Biol.2018,31, 197–210. [CrossRef] [PubMed]
10. Nicotra, A.B.; Cosgrove, M.J.; Cowling, A.; Schlichting, C.D.; Jones, C.S. Leaf shape linked to photosynthetic rates and temperature optima in South African Pelargonium species.Oecologia2008,154, 625–635. [CrossRef] [PubMed]
11. Barabé, D.; Daigle, S.; Brouillet, L. On the interpretation of the asymmetrical leaf of Begonia by D’Arcy Thompson.Acta Biotheor.1992,40, 329–332. [CrossRef]
12. Shi, P.J.; Huang, J.G.; Hui, C.; Grissino-Mayer, H.D.; Tardif, J.; Zhai, L.H.; Wang, F.S.; Li, B.L. Capturing spiral radial growth of conifers using the superellipse to model tree-ring geometric shape.Front. Plant Sci.2015,6, 856. [CrossRef] [PubMed]
13. Wright, I.J.; Dong, N.; Maire, V.; Prentice, C.; Westoby, M.; Díaz, S.; Gallagher, R.V.; Jacobs, B.F.; Kooyman, R.; Law, E.A.; et al. Global climatic derivers of leaf size.Science2017,357, 917–921. [CrossRef] [PubMed] 14. R Core Team. R: A Language and Environment for Statistical Computing. Vienna, Austria: R Foundation for
Statistical Computing. 2015. Available online:https://www.R-project.org/(accessed on 17 April 2018). 15. Baddeley, A.; Rubak, E.; Turner, R.Spatial Point Patterns: Methodology and Applications with R; Chapman and
Hall/CRC Press: London, UK, 2015.
16. De Mendiburu, F. Agricolae: Statistical Procedures for Agricultural Research. R Package Version 1.2-4. Available online:https://CRAN.R-project.org/package=agricolae(accessed on 17 April 2018).
17. Lin, S.; Zhang, L.; Reddy, G.V.P.; Hui, C.; Gielis, J.; Ding, Y.; Shi, P. A geometrical model for testing bilateral symmetry of bamboo leaf with a simplified Gielis equation. Ecol. Evol. 2016,6, 6798–6806. [CrossRef] [PubMed]
18. Milla, R.; Reich, P.B. The scaling of leaf area and mass: The cost of light interception increases with leaf size. Proc. R. Soc. Lond. B Biol. Sci.2007,274, 2109–2114. [CrossRef] [PubMed]
19. Lin, S.; Shao, L.; Hui, C.; Song, Y.; Reddy, G.V.P.; Gielis, J.; Li, F.; Ding, Y.; Wei, Q.; Shi, P. Why does not the leaf weight-area allometry of bamboos follow the 3/2-power law?Fron. Plant Sci.2018, in press. [CrossRef] 20. Oren, R.; Schulze, E.-D.; Matyssek, R.; Zimmermann, R. Estimating photosynthetic rate and annual carbon gain in conifer from specific leaf weight and leaf biomass.Oecologia1986,70, 187–193. [CrossRef] [PubMed] 21. Niinemets, Ü.; Kull, K. Leaf weight per area and leaf size of 85 Estonian woody species in relation to shade
tolerance and light availability.For. Ecol. Manag.1994,70, 1–10. [CrossRef]
22. Smith, W.K.; Vogelmann, T.C.; DeLucia, E.H.; Bell, D.T.; Shepherd, K.A. Leaf form and photosynthesis: Do leaf structure and orientation interact to regulate internal light and carbon dioxide?BioScience1997,47, 785–793. [CrossRef]
23. Semiarti, E.; Ueno, Y.; Tsukaya, H.; Iwakawa, H.; Machida, C.; Machida, Y. The ASYMMETRIC LEAVES2 gene of Arabidopsis thaliana regulates formation of a symmetric lamina, establishment of venation and repression of meristem-related homeobox genes in leaves.Development2001,128, 1771–1783.
24. Sandhu, H.S.; Shi, P.; Kuang, X.; Xue, F.; Ge, F. Applications of the bootstrap to insect physiology.Fla. Entomol.
2011,94, 1036–1041. [CrossRef]
25. Taylor, L.R. Aggregation, variance and the mean.Nature1961,189, 732–735. [CrossRef]
26. Cohen, J.E.; Xu, M. Random sampling of skewed distributions implies Taylor’s power law of fluctuation scaling.Proc. Natl. Acad. Sci. USA2015,112, 7749–7754. [CrossRef] [PubMed]
27. Cohen, J.E.; Lai, J.; Coomes, D.A.; Allen, R.B. Taylor’s law and related allometric power laws in New Zealand mountain beech forests: The roles of space, time and environment.Oikos2016,125, 1342–1357. [CrossRef] 28. Shi, P.J.; Sandhu, H.S.; Reddy, G.V.P. Dispersal distance determines the exponent of the spatial Taylor’s
Symmetry2018,10, 118 10 of 10
29. Cheng, L.; Hui, C.; Reddy, G.V.P.; Ding, Y.-L.; Shi, P.-J. Internode morphometrics and allometry of Tonkin CanePseudosasa amabilisMcClure.Ecol. Evol.2017,7, 9651–9660. [CrossRef] [PubMed]
30. Valladares, F.; Brites, D. Leaf phyllotaxis: Does it really affect light capture? Plant Ecol.2004,174, 11–17. [CrossRef]
31. Jurik, T.W. Temporal and spatial patterns of specific leaf weight in successional northern hardwood trees species.Am. J. Bot.1986,73, 1083–1092. [CrossRef]