Treatment options to mitigate transport of harmful
algal species and pathogens via ships' ballast water
and shellfish translocation
Matthew David Gregg
Bachelor of Science (Honours)
Submitted in fulfilment of the requirements for the Degree of
Doctor of Philosophy
July, 2009
Declaration and Authority of Access
This thesis contains no material which has been accepted for award of a degree or diploma by the University or any other institution and, to the best of my knowledge and belief, the thesis contains no material previously published or written by another person except where due acknowledgement is made in the text, nor does the thesis contain any material that infringes copyright.
This thesis may be made available for loan and limited copying is permitted in accordance with the Copyright Act 1968.
//
Acknowledgements
Although this thesis has felt like a very personal and somewhat isolated journey, it would never have happened without so many people providing assistance. The following is but a subset of those who I owe so much gratitude to. Anyone who I have not specifically listed is no less appreciated.
Firstly, I would like to thank Professor Gustaaf M. Hallegraeff for his academic supervision, ideas, support and encouragement. I would also like to thank the entire staff at the School of Plant Science, in particular Mrs Helen Bond and fellow aquatic botany postgraduate students Ben Mooney, Glenn Wallace, Miguel de Salas, Tae-Gyu Park, Suellen Cook, Kate Perkins and Joana Cubillos for their assistance, friendship and support throughout the entire process.
Heartfelt thanks to my mother Dianne who has made an invaluable contribution through the last years and a special thanks to my best mates, Dog and Zoe. Finally I would like to thank all of my family and friends who have provided so much support over the course of my studies and have had to deal with a focused and sometimes difficult person for the past 4 years.
Ab
stract
The worldwide transfer of non-indigenous invasive aquatic organisms via ships' ballast water and shellfish translocation has been widely shown to cause significant ecological, economic and human health impacts. In 2004 the International Maritime Organisation (IMO) adopted the International Convention for the Control and Management of Ships' Ballast Water and Sediments. This legislation (still to be ratified) requires all ships to introduce by 2016 approved systems capable of treating ballast water to strict microbial standards. The latter has reinvigorated interest in the application of chemical biocides, because mechanical separation and physical treatment are unable to kill bacteria. The present work examined the effectiveness of several proposed chemical ballast water treatment options using toxic dinoflagellate resting cysts, vegetative marine microalgae and bacteria as model organisms.
The chemicals tested included the ballast water biocides Peraclean® Ocean and SeaKleen®, the chlorine dioxide biocide Vibrex ® and the hull antifouling agent Econea®. All biocide tests were conducted using filtered seawater (28 %o) and natural estuarine water ranging in salinity from 23.7-28.6%o. Peraclean ® Ocean was biodegradable within 2-6 weeks, could effectively eliminate vegetative microalgae at
100 ppm, inactivated resting cysts of marine dinoflagellates (Gymnodinium catenatum, Alexandrium catenella, A. pseudogonyaulax, Protoceratium reticulatum) at 200-2000 ppm, and could control bacterial growth of Escherichia coli,
Staphylococcus aureus, Listeria innocua and Vibrio alginolyticus at 125-250 ppm.
required to infiltrate the walls of dinoflagellate cysts. The applicability of ballast water biocides is limited by factors such as cost, biological effectiveness, reduced efficacy in the presence of sediments and lower water temperatures (6°C compared to 17°C), and possible residual toxicity of the discharged ballast water.
Table of Contents
Page
Declaration i
Acknowledgements ii
Abstract
Contents v
Chapter 1. General Introduction
1.1
Introduction 21.2
Ships' ballast water as a vector for the introduction of aquatic species 31.3
Bivalve shellfish transfers as a vector for the introduction of invasiveaquatic organisms 7
1.4
References 10Chapter 2. Efficacy of three commercially available ballast water biocides
against vegetative microalgae, dinoflagellate cysts and bacteria
2.1
Abstract 162.2
Introduction 172.3
Methods and materials 192.4
Results 252.5
Discussion 442.6
References 51Chapter 3. Testing the effectiveness of ECONEA
®
Technical and suitable
co-biocides against vegetative microalgae and dinoflagellate cysts
3.1
Abstract 583.2
Introduction 593.3
Methods and materials 603.4
Results 653.5
Discussion 98Chapter 4. Decreased ability of two commercially available ballast water biocides to inactivate dinoflagellate cysts when buried in ballast tank sediments
4.1 Abstract 105
4.2 Introduction 106
4.3 Methods and materials 108
4.4 Results 112
4.5 Discussion 115
4.6 References 119
Chapter 5. Validation of Sytox® Green fluorescent staining for assessment of dinoflagellate cyst viability
5.1 Abstract 123
5.2 Introduction 124
5.3 Methods and materials 125
5.4 Results 128
5.5 Discussion 134
5.6 References 138
Chapter 6. Review of progress in the development of treatment options for reducing or eradicating phytoplankton, zooplankton and bacteria in ship's ballast water
6.1 Abstract 142
6.2 Introduction 144
6.3 Mechanical/Physical treatment options 145
6.4 Chemical treatment options 169
6.5 Multi-component treatment systems 195
6.6 The 'ballast-free ship' concept 207
6.7 Organism viability testing for full-scale ballast water treatment systems 208
6.8 Conclusions and recommendations 210
Chapter 7. Experimental assessment of translocation of adult bivalve shellfish
as a vector for harmful marine microalgal introductions
7.1
Abstract 2327.2
Introduction 2337.3
Methods and materials 2347.4
Results 2377.5
Discussion 2437.6
References 247Chapter 8. Potential treatment options to mitigate the risk of harmful
microalgal introductions from translocation of juvenile and adult
. Pacific oysters
8.1
Abstract 2528.2
Introduction 254•
8.3
Methods and materials 2568.4
Results 2608.5
Discussion 278Chapter 1
1.1 Introduction
The worldwide transfer and introduction of non-indigenous aquatic organisms can lead to dramatic alterations of marine and freshwater environments. Although some aquatic invasions result from natural dispersal mechanisms, the majority appear to be caused by human activities. Anthropogenic introductions of non-indigenous aquatic organisms have been occurring on a global scale for hundreds, if not thousands of years. Unfortunately, the rate of new invasions appears to be increasing and is now widely recognised as one of the main threats to the world's oceans and aquatic ecosystems. Evidence is accumulating that ecosystems disturbed by pollution or climate change are especially prone to biological invasions (Stachowicz et al., 2002).
There are several means by which species may become introduced. Ballast water transport and hull-fouling transfer by commercial ships have been suggested to be the two primary vectors for aquatic introductions (Minchin and Gollasch, 2002). Other mechanisms include aquaculture, seafood, bait and aquarium enterprises; recreational vessels; seaplanes; marine debris; migrating birds and ocean current movements (Carlton, 1985; Carlton and Geller, 1993; Darrigan, 2002; Barnes and Milner, 2005; Weigle et al., 2005). Of these non-shipping mechanisms, the aquaculture industry has played a substantial role in the global transfer of non-indigenous marine organisms, particularly with regard to the translocation of bivalve shellfish (Minchin and Gollasch, 2002).
This thesis focuses on the anthropogenic introduction of non-indigenous species via ships' ballast water and associated with the translocation of bivalve shellfish for aquaculture. The thesis is presented as a general introduction (Chapter 1), a series of stand-alone chapters on aspects of ballast water treatment (Chapters 2-5), a
comprehensive review on recent progress in the development of treatment options for reducing or eradicating phytoplankton, zooplankton and bacteria in ship's ballast . water (Chapter 6) and two chapters on the transfer of harmful microalgae via bivalve
1.2 Ships' ballast water as a vector for the introduction of aquatic species
Ballast water is routinely taken onboard ships to maintain safety and stability at sea. Correct ballasting reduces stresses on the hull of the ship, provides stability, aids propulsion and manoeuvrability, and compensates for weight lost from unloading cargo and from fuel consumption (National Research Council, 1996). Today, ballast water is gravity fed or pumped into specially designed ballast tanks or cargo holds. During this process, any organisms and sediment that are suspended in water column are also taken on board.
pinnaufida in Tasmania, Australia and the European Green crab Carcinus maenas in North America, Australia and Japan (Bax et al., 2003).
Ballast-mediated introductions can also lead to ecological problems that can adversely affect human health. For example, ballast water has been implicated in the global dissemination of pathogenic bacteria and viruses (including Vibrio cholerae and Escherichia coli) (McCarthy and Khambaty, 1994; Ruiz et al., 2000; Dobbs et al., 2003; Ivanov et al., 2003; Burkholder et al., 2007), and has been shown to transport viable phytoplankton species responsible for human illnesses such as paralytic shellfish poisoning, amnesic shellfish poisoning, diarrhetic poisoning and ciguatera fish poisoning (Hallegraeff and Bolch, 1992; Kelly, 1993; Hallegraeff,
1998; Forbes and Hallegraeff, 2001; Hamer et al., 2000, 2001).
In recognition of the potentially devastating effects from the introduction of invasive species in ships ballast water, the International Maritime Organisation (IMO) adopted the International Convention for the Control and Management of Ships' Ballast Water and Sediments on the 13th of February 2004. One of the main requirements of this legislation is the phased implementation of a ballast water discharge standard, whereby, depending on construction date and ballast water capacity, ships must conduct ballast water exchange as an interim strategy and eventually use an approved ballast water treatment system capable of treating ballast water to the following standard:
Regulation D-2 of the Convention specifies that ships meeting the requirements of the Convention must discharge:
• less than 10 viable organisms per cubic meter greater than or equal to 50 micrometers in minimum dimension, and
• less than 10 viable organisms per millilitre less than 50 micrometers in minimum dimension and greater than or equal to 10 micrometers in minimum dimension, and
• Toxigenic Vibrio cholerae (serotypes 01 and 0139) with less than 1 Colony Forming Unit (cfu) per 100 millilitres or less than 1 cfu per 1 gram (wet weight) of zooplankton samples,
• Escherichia coli less than 250 cfu per 100 millilitres, and • Intestinal Enterococci less than 100 cfu per 100 millilitres.
The convention will enter into force 12 months after ratification by 30 countries representing 35% of the world's commercial shipping tonnage (IMO, 2004). As of September 30, 2008, only 16 countries have signed the Convention. The implementation of the IMO Convention was originally set to begin in 2009, however due to pressure from the shipping industry and the refusal of some countries to ratify the convention due to the limited availability of effective treatment systems, the IMO has delayed the initial enforcement date by up to three years allowing for the further development of treatment technologies. The adoption of the new Convention coupled with the limited effectiveness and operational limitations of ballast water exchange has led to significant financial investment in the research and development of shipboard ballast water treatment technologies. Some estimates forecast that US$10- 15 billion will be spent on ballast water treatment research during the next decade. A wide variety of treatment options have been proposed for ballast water treatment but it is increasingly believed that the use of chemical biocides or active substances will be required to comply with the microbial component of the IMO ballast water discharge standard.
Diploid
lv
Gametes
Planomeiocyte
Planozygote 2 young
Hypnozygote
\,..,
old
young
[image:14.554.167.486.50.440.2]•■••■•■■■■••••
Fig. 1. Lifecycle of a typical cyst forming toxic dinoflagellate Gymnodinium catenatum illustrating the process of zygotic meiosis (after Blackburn et al. 1989).
was assessed as any potential chemical treatment must degrade to a non-toxic level prior to discharge to avoid negative impacts on the marine environment. Ballast tanks can also accumulate significant amounts of sediment providing an additional habitat for a variety of resistant organisms including resting stages of phytoplankton and zooplankton and microbial pathogens, therefore, a successful chemical treatment must also be able to eliminate organisms that reside in ballast tank sediments.
Chapter 4
assesses the ability of Peraclean® Ocean and SeaKleen® to inactivate dinoflagellate cysts buried in ballast tanks sediment.To date, the use of dinoflagellate cysts for assessing the efficacy of ballast water treatment options has been limited due to the time required to determine cyst viability following exposure to potential treatment options. Conventional methods for determining cyst viability require careful microscopic observations of cyst germination for a period of up to several months.
Chapter 5
examines the reliability of a more rapid technique for determining cyst germination using the vital stain Sytox® Green.Apart from chemical treatments, other technologies currently under commercial development include mechanical separation devices, heat treatment, UV irradiation, ultrasound, de-oxygenation and treatment systems that incorporate multiple technologies.
Chapter 6
provides a detailed up-to-date review of progress in the development of treatment options for reducing or eradicating phytoplankton, zooplankton and bacteria in ship's ballast water and sediments.1.3 Bivalve shellfish transfers as a vector for the introduction of invasive aquatic
organisms
considered to be the dominant source of non-indigenous species introductions, with estimates suggesting that 44% of the introductions may be attributed to shellfish movements (Wallentinus, 2002). In many instances, little has been done to avoid the transfer of non-indigenous organisms associated with the introduction and translocation of live shellfish. For example, an examination of oyster spat exported from France to Ireland in 1993 revealed the presence of a wide variety of organisms (Minchin et al., 1993) including 67 phytoplankton species and 15 types of dinoflagellate cysts, even though the shellfish were deemed to be free of other organisms (0'Mahony, 1993).
It is widely acknowledged that translocated shellfish are potential carriers of phytoplanIcton between aquaculture sites. Several researchers have shown that harmful phytoplankton species can remain intact in the digestive tracts of certain molluscs and may recover into viable populations once excreted in faecal material (e.g. Laabir and Gentien, 1999; Laabir et al., 2007; flegaret et al., 2008); however, studies of this kind have never been completed in Australia. In Chapter 7, we examined whether viable microalgal cells of the dinoflagellates Alexandrium catenella, Cryptoperidiniopsis brodyi, Gymnodinium catenatum, Karenia papilionacea, Krytoperidinium foliaceum, Pfiesteria shumwayae and resting cysts of
G. catenatum can pass intact through the digestive tract of two widely exploited bivalve species in Australia, the non-indigenous Pacific oyster (Crassostrea gigas) and the native blue mussel (Mytilus galloprovincialis), and whether intact cells excreted in the bivalve faeces can recover into viable populations.
exposure to toxins from microalgae through consumption of contaminated shellfish (Hallegraeff, 1992; Burkholder, 1998), it is surprising so little attention has been paid to eliminating, or minimising, phytoplankton associated with live shellfish transfers. Chapter 8 examines the effectiveness of several potential treatment options for eliminating ingested marine microalgae in the Pacific oyster as the extent to which the current treatment techniques used by shellfish farmers may reduce this risk is largely unknown.
1.4 References
Barnes, D.K.A. and Milner, P., 2005. Drifting plastic and its consequences for sessile organism dispersal in the Atlantic Ocean. Marine Biology 146:815-825.
Box, N., Williamson, A., Aguero, M., Gonzalez, E. and Geeves, W., 2003. Marine invasive alien species: a threat to global biodiversity. Marine Policy 27:313-323.
Bossenbroek, J.M., Johnson, L.E., Peters, B. and Lodge, D.M., 2007. Forecasting the Expansion of Zebra Mussels in the United States. Biological Conservation 21(3):800-810.
Burkholder, J.M., 1998. Implications of Hartnful Microalgae and Heterotrophic Dinoflagellates in Management of Sustainable Marine Fisheries. Ecological Applications 8(1):S37-S62.
Burkholder, J.M., Hallegraeff, G.M., Melia, G., Cohen, A., Bowers, H.A., Oldach, D.W., Parrow, M.W., Sullivan, M.J., Zimba, P.V., Allen, E.H., Kinder, C.A. and Mallin, M.A., 2007. Phytoplankton and bacterial assemblages in ballast water of U.S. military ships as a function of port of origin, voyage time, and ocean exchange practises. Harmful Algae 6:486-518.
Carlton, J., 1985. Transoceanic and interoceanic dispersal of coastal marine
organisms: the biology of ballast water. Oceanography and Marine Biology Annual Review 23:313-371.
Carlton, J.T., 1999. The scale and ecological consequences of biological invasions in the world's oceans. In: Sanduland, 0., Schei, P. and Viken, A. (eds), Invasive Species and Biodiversity Management. Kluwer Academic Publishers.
Netherlands, pp. 195-212.
Carlton, J. and Geller, J., 1993. Ecological roulette: biological invasions and the 'global transport of non-indigenous marine organisms. Science 261:78-82. Chew, K., 1990. Global Bivalve Shellfish Introductions. World Aquaculture 21(3):9-
22.
'Cohen, A.N. and Carlton, LT., 1998. Accelerating invasions rate in a highly invaded estuary. Science 279, 555-557.
Darrigan, G., 2002. Potential impact of filter feeding invaders on temperate inland freshwater environments. Biological Invasions 4:145-156.
G.M., 2003. Pathogens in ships ballast water and sediment residuals.
Proceedings of the 3'1 International Conference of Marine Bioinvasions. La Jolla, California, March 16-19.
Forbes, E. and Hallegraeff, G. M., 2001. Transport of potentially toxic
Pseudo-nitzschia diatom species via ballast water. In: John, J. (ed), Proceedings of the 15th Diatom Symposium. Ganter Verlag. pp. 509-520.
Grigorovich, I.A., Colautti, R.I., Mills, E.L., Holeck, K., Ballert, A.G. and MacIsaac, H.J., 2003. Ballast-mediated animal introductions in the Laurentian Great Lakes: retrospective and prospective analyses. Canadian Journal of Fisheries and Aquatic Sciences. 60(6):740-756.
Hallegraeff, G.M., 1992. Harmful Algal Blooms in the Australian Region. Marine Pollution Bulletin 25(5-8):186-190.
Hallegraeff, G.M., 1998. Transport of toxic dinoflagellates via ships' ballast water: bioeconomic risk assessment and efficacy of possible ballast water
management strategies. Marine Ecology Progress Series 168:297-309. Hallegraeff, G.M. and Bolch, C.J., 1992. Transport of diatom and dinoflagellate
resting spores in ships' ballast water: Implications for plankton biogeography and aquaculture. Journal of Plankton Research 14:1067-1084.
Hamer, J.P., McCollin, T.A. and Lucas, I.A.N., 2000. Dinoflagellate Cysts in Ballast Tank Sediments: Between Tank Variability. Marine Pollution Bulletin
40(9):731-733.
Hamer, J.P., Lucas, I.A.N. and McCollin, T.A., 2001. Harmful dinoflagellate resting cysts in ships' ballast tank sediment: potential for introduction into English and Welsh waters. Phycologia 40(3):246-255.
Hegaret, H., Shumway, S.E., Wikfors, G.H., Pate, S. and Burkholder, J.M., 2008. Potential transport of harmful algae via relocation of bivalve molluscs. Marine Ecology Progress Series 361:169-179.
Humphrey, J., 1988. Disease risks associated with translocation of shellfish, with special reference to the giant clam Tridacna gigas. In: Giant clams in Asia and the Pacific. ACIAR Monograph Series 98:241-244.
Ivanov, V., Tay, S.T.R., Joachimsthal, E. and Tay, J.H., 2003. Bacteriological monitoring of ships' ballast water in Singapore and its potential importance for the management of coastal ecosystems. The East Asia Seas Congress 2003. Theme B. Essential Cross-Sectoral Processes and Approaches to Achieving Sustainable Development. Workshop 2. Session 1.
Karatayev, A.Y., Boltovskoy, D., Padilla, D.K. and Burlakova, L.E., 2006. Could Limnoperna fortunei be worse than Dreissena polymorpha? Potential spread and ecosystem impacts. Journal of Shellfish Research 25(2):743-752
Karatayev, A.Y., Boltovskoy, D., Padilla, D.K. and Burlakova, L.E., 2007. The invasive bivalves Dreissena polymorpha and Limnoperna fortunei: parallels, contrasts, potential spread and invasion impacts. Journal of Shellfish
Research 26:205-213.
Kelly, J.M., 1993. Ballast water and sediments as mechanisms for unwanted species introductions into Washington State. Journal of Shellfish Research 12(2):405- 410.
L;aabir, M. and Gentien, P., 1999. Survival of toxic dinoflagellates after gut passage in the Pacific oyster Crassostrea gigas Thunberg. Journal of Shellfish Research 18(1):217-222.
Laabir, M., Amzil, Z., Lassus, P., Masseret, E., Tapilatu, Y., De Vargas, R. and Grzebyk, D., 2007. Viability, growth and toxicity of Alexandrium catenella and Alexandrium minutum (Dinophyceae) following ingestion and gut passage in the oyster Crassostrea gigas. Aquatic Living Resources 20:51-57.
Lewis, J., Harris, A.S.D., Jones, K.J. and Edmonds, R.L., 1999. Long-term survival of marine planktonic diatoms and dinoflagellates in stored sediment samples. Journal of Plankton Research 21(2):343-354.
McCarthy, S.A. and Khambaty, F.M., 1994. International dissemination of epidemic Vibrio cholerae by cargo ships and other nonpotable waters. Applied and Environmental Microbiology 60(7):2597-2601.
Minchin, D., 1996. Management of the introduction and transfer of marine molluscs. Aquatic Conservation: Marine and Freshwater Ecosystems 6:229-244.
Minchin, D. and Gollasch, S., 2002. Vectors-how exotics get around. In: Leppakoski, E., Gollasch, S., Olenin, S. (eds), Invasive Aquatic Species of Europe.
Distribution, Impacts and Management. Kluwer Academic Publishers. Netherlands, pp. 183-192.
Minuer, F., Belsher, T., Johnson, M., Maggs, C. and Verlaque, M., 2007. Experimental assessment of oyster transfers as a vector for macroalgal introductions. Biological Conservation 137:237-247.
National Research Council, 1996. Stemming the Tide: Controlling Introductions of Nonindigenous Species by Ships' Ballast Water. National Research Council. National Academic Press. Washington, DC.
O'Mahoney, J.H.T., 1993. Phytoplankton species associated with imports of the Pacific oyster Crassostrea gigas, from France to Ireland. ICES CM
1993/F:26.
Pimentel, D., 2005. Aquatic nuisance species in the New York State Canal and Hudson River Systems and the Great Lakes Basin: an economic and environmental assessment. Environmental Management 35:692-701. Richards, G.P., 1988. Microbial Purification of Shellfish: A Review of Depuration
and Relaying. Journal of Food Protection 51(3):218-251.
Ruiz, G.M., Carlton, J.T., Grosholz, E.D. and Hines, A.H., 1997. Global invasions of marine and estuarine habitats by non-indigenous species; mechanisms, extent and consequences. American Zoologist 37:621-632.
Ruiz, G.M., Rawlings, T.K., Dobbs, F.C., Drake, L.A., Mullady, T., Huq, A. and Colwell, R.R., 2000. Global spread of microorganisms by ships. Nature 408:49-50.
Stachowicz, J.J., Terwin, J.R., Whitlatch, R.B. and Osman, R.W., 2002. Linking climate change and biological invasions: ocean warming facilitates
non-indigenous species invasion. Proceedings of the National Academy of Science USA 99:15497-15500.
Weigle, S., Smith,
D.,Carlton, J. and Pederson, J., 2005. Assessing the Risk of
Introducing Exotic Species via the Live Marine Species Trade.
Conservation Biology19(1):213-223.
Chapter
2
Efficacy of three commercially available ballast water biocides
against vegetative microalgae, dinoflagellate cysts and bacteria
This chapter was published in the Elsevier scientific journal Harmful Algae. Gregg, M and Hallegraeff, GM (2007). Efficacy of three commercially available
This chapter has been removed
for copyright or proprietary
Chapter 3
Testing the effectiveness of ECONEA ® Technical and suitable
co-biocides against vegetative microalgae and dinoflagellate
3.1 Abstract
ECONEATm is a non-metal biocide initially developed for use as a ship hull antifouling agent. In addition to its application in marine antifouling coatings, current research is evaluating ECONEA Tm as a ballast water treatment option. Here, we examine the effectivessness of ECONEA Tm and 14 potential co-biocides against vegetative microalgae and dinoflagellate cysts, and assess the biodegradability of ECONEATm, as environmental concerns exist regarding the discharge of treated ballast water. The biocide ECONEA® Technical effectively killed vegetative cells of a broad range of both armoured (cellulose-walled) and unarmoured dinoflagellates and raphidophytes at a concentration of 0.5 ppm. ECONEA ® was not as effective at controlling the small haptophyte Prymnesium parvum (8 ppm required) and did not inactivate the small cellulose-walled green-flagellate Tetraselmis suecica even at 20 ppm. ECONEA® failed to inactivate the sexual resting cysts of the dinoflagellate Gymnodinium catenatum at a concentration of 1000 ppm, suggesting that the product lacks the penetrability required to infiltrate the resistant cell walls of dinoflagellate cysts. In order to inactivate dinoflagellate cysts in ships ballast water, ECONEA ® therefore would require a co-biocide. Out of the 14 potential co-biocides tested, Natrium PYRION® 40% and PYRION® Disulfide 40% Suspension required the lowest concentrations for the effective control of both vegetative microalgae and Gymnodinium catenatum cysts. ECONEA® Technical was biodegradable within 4-6 weeks (initial concentration of 1 ppm) under conditions of 12 h light/12 h dark. Degradation was accelerated in the presence of ballast tank sediments but was significantly reduced in the dark.
3.2 Introduction
Introductions of non-indigenous species are causing dramatic changes in marine communities and ecosystems worldwide. These introductions derive from a variety of vectors; however, due to the large volumes of water involved and the frequency of use, ships ballast water is widely recognised as a major vector for aquatic invasions. One solution to eliminate the threat of ballast-mediated invasive species involves treating ballast water to exclude, remove or kill these organisms.
The treatment of ships ballast water is one of the most significant challenges facing the maritime industry today. In 2004, a global requirement for ballast water treatment arose when the International Maritime Organisation (IMO) adopted the Convention for the Control and Management of Ships' Ballast Water and Sediments. One of the main requirements of the convention is the phased implementation of a ballast water discharge standard, whereby, depending on construction date and ballast water capacity, ships will be required to use an approved ballast water treatment system capable of treating ballast water to strict microbial standards. The implementation of the IMO convention was originally set to begin in 2009, however due to pressure from the shipping industry and the refusal of some countries to ratify the convention due to the limited availability of effective treatment systems, the IMO has delayed the initial enforcement date by up to three years allowing for the further development of treatment technologies.
chemical discharge into the environment. Many companies have already produced onboard treatment systems that make use of active substances or chemical biocides. To date, eight of these systems have received basic approval and two have been given final approval from the IMO. The two commercially available treatment systems that have received final approval from the IMO are the SEDNA ® Ballast Water Management System (Using Peraclean® Ocean) and the PureBallast System (GESAMP, 2008).
ECONEATm is a non-metal biocide developed by The Preservation and Material Protection Division of Janssen Pharmaceutica NV for use as a hull antifouling agent. In addition to its application in marine antifouling coatings, current research is evaluating ECONEArm as a ballast water treatment option. Janssen Pharmaceutica NV indicates several features of the compound that potentially make it an attractive ballast water biocide. It is suggested to be biologically effective at low concentrations; it is claimed to degrade rapidly and does not accumulate in the marine environment; and it is a non-oxidative compound therefore would not pose any corrosion problems. Preliminary investigations into its effectiveness as a ballast water biocide found that it was extremely effective against zooplankton species yet was ineffective against microalgae (Tony Kempen, Janssen Pharmaceutica NV, pers. comm.). The main objective of the present work was to test the effectiveness of ECONEATm and potential co-biocides against a range of vegetative microalgal species and dinoflagellate cysts of Gymnodinium catenatum; and to assess the degradability of ECONEATm, as any potential ballast water biocide must degrade to a concentration low enough to avoid ecological impacts following discharge into receiving waters.
3.3 Materials and methods
Vegetative microalgal cultures
the haptophyte Prymnesium parvum were grown in 250 ml culture flasks containing 150 ml of GSe medium (Blackburn et al., 1989). The cellulose-walled green flagellate Tetraselmis suecica was grown in 250 ml culture flasks containing 150 ml of f/2 medium (Guillard, 1975). Nutrient medium was made with ultra-filtered seawater collected from Bruny Island, Tasmania, Australia. Table 1 summarises isolation details including cell sizes of the microalgal strains used. All cultured microalgal species were obtained from the microalgal culture collection at the School of Plant Science, University of Tasmania. Alexandrium catenella and Gymnodinium catenatum are paralytic shellfish poison (PSP) producing toxic dinoflagellates, Karlodinium veneficum, Karenia papilionacea, Chattonella marina, Heterosigma akashiwo, Prymnesium parvum are all fish killers, while Protoceratium reticulatum, Scrippsiella trochoidea and Tetraselmis suecica are non-toxic. All cultures were maintained in a culture room at 17°C under 12 h dark/12 h light. Light was provided at an intensity of 100 gmol quanta ni2s-I by a bank of cool-white fluorescent tubes.
Table 1. Isolation details and characteristics of microalgal strains used
Species Algal group Cell size Culture Date of
(11m) code isolation Source Isolated by Status Sydney N/A Harbour (NSW) Derwent River (TAS) Alexandrium catenella Chattonella marina Gymnodinium catenatum Gymnodinium catenatum Heterosigma akashiwo Karenia papilionacea Karlodinium veneficum Protoceratium reticulatum Prymnesium parvum
Seri ppsiella trochoidea
Tetraselmis suecica Armoured dinoflagellate (PSP) Raphidophyte (fish-killer) Unarmoured dinoflagellate (PSP) Unarmoured .dinoflagellate (PSP) Raphidophyte (fish-killer) Unarmoured dinoflagellate (fish killer) Unarmoured dinoflagellate (fish killer) Armoured dinoflagellate Haptophyte (fish killer) Armoured dinoflagellate
Green flagellate 10-15 TSCS187
N/A N/A
N/A M. de Salas N/A
M. de Salas Unialgal
Triabunna
M. de Salas Clonal (TAS)
Hidaway Bay
N/A M. de Salas Clonal
(TAS)
Port Lincoln
M. de Salas Clonal (SA)
Sydney
Harbour M. de Salas Clonal (NSW)
Derwent
N. Parker Clonal
N/A J. Marshall N/A
M. de Salas Unialgal
N/A Brest, France A.Dodson N/A Derwent
River (TAS) 25-32 ACSHO2
30-70 CMDE01
27-36 GCDEll N/A
27-46 GCTRA01 24/05/2000
11-25 HAHBO2
18-32 KPPLO1 27/05/2003
8-14 KVSHO1 15/05/2002
28-53 PTRDEll 1999
River (TAS) Serpentine River (WA)
Adelaide 16-36 SCADO1 15/02/2000
Dinoflagellate cyst production
Two ml culture suspensions of compatible sexual mating strains of the dinoflagellate Gymnodinium catenatum (strain GCDEll x GCTRA01) were inoculated into 250 ml screw top beakers containing 200 ml of filtered seawater (28%0 salinity) with 10 ml of GSe medium. The screw top beakers were incubated at 17°C under 12 h dark/12 h light with a light intensity of 100iimol quanta 111-2S-1 and were examined at regular
intervals for cyst formation. This procedure produced approximately 1500 cysts per beaker within 28 days. Prior to treatment, cysts were stored at 4°C in the dark to prevent premature germination.
Chemical biocides
All chemical biocides were supplied by Janssen PMP, Belgium. For ECONEATm, the stock solution was prepared from a newly opened container of ECONEA ® Technical in the form of a wettable powder (Batch no. ZR107894EXA037; Active content: 98.4 wt. %; Janssen PMP, Belgium). Product and company information on the 14 possible co-biocides is summarised in Table 2. All treatment solutions were prepared in filtered seawater (28%0 salinity).
Chemical treatment of vegetative microalgae
One ml of vegetative microalgal cultures (Gymnodinium catenatum, Alexandrium catenella, Protoceratium reticulatum, Scrippsiella trochoidea, Karlodinium veneficum, Karenia papilionacea, Chattonella marina, Heterosigma akashiwo, Ptymnesium parvum, Tetraselmis suecica) were placed into 24-well flat bottom
light intensity of 100 gmol quanta M-2S-1 at 17°C with a 12 h dark/12 h light
photoperiod. Cell viability was assessed after 48 h by calculating the percentage of non-viable cells for each of the various biocide concentrations and control treatments. Percentage cell viability was determined by counting the number of non-viable cells out of 100 total cells. Motility, flagellar movement, and cell wall and organelle integrity were used as indicators of viability. Viability observations were conducted on a Zeiss inverted microscope (Zeiss Axiovert 25).
Chemical treatment of dinoflagellate cysts
The reliable assessment of dinoflagellate cyst viability was essential to determine lethal concentrations of the chemical biocides tested. The present study used the existence of a healthy swimming planomeiocyte and the incidence of an empty cyst wall as criteria for cyst germination and survival (e.g. Ichikawa et al., 1992; Bolch and Hallegraeff, 1993; Hallegraeff et al., 1997). For the chemical treatments, dino flagellate cysts were placed into 12-well flat bottom microplates containing 4 ml of GSe medium and various concentrations of the biocides were subsequently applied. Each concentration and control was replicated 3 times. After the application of the biocide, the culture plates were sealed with parafilm, wrapped in aluminium foil and placed under culture conditions at 17°C. After 2 weeks exposure, cysts were removed, washed in sterile GSe medium, and transferred to new 12-well culture plates containing fresh GSe media. The treated cysts were then placed back under culture conditions with a light intensity of 100 pinol quanta M-2S-1 at 17°C with a 12h
Table 2. Product and Company Information of the 15 biocides tested.
Product name Product form Batch number Composition/Information on ingredients Active content Manufacturer
ARQUAD MCB-50 ECONEA® Technical Hydrogen peroxide 30% Intercide OIT
Isoxaflutol PESTANAL® KATHONTm 886F Biocide LAg 2006 041
LAg 2007 030
Natrium PYRION® 40% Oxy-PYRION® 98% PROTECTNOL BN
PYRION® Disulfide 40% Suspension Ritnsulfuron PESTANAL® R090026 4, 5-dichloro-N-octy1-4-isothiazolin-3- one Liquid Solid Liquid Liquid Solid Liquid Liquid Liquid Liquid Solid Solid Liquid Solid Solid Solid 654S6005 ZR107894EXA037 612809028 Z10192 46437 1735729 SID3865 SID4076 AA270488EXA002 A6010010 7044R1 A6061810 46097 2001 014/SID1012 51226
C12-C16 allcylbennzyldimethylammonium chloride —50%. Water-48%. Ethylene glycol-2%
2-(p-chloropheny1)-3-cyano-4-bromo-5-trifluoromethyl pyrrole
Hydrogen peroxide
2-n-Octy1-4-Isothiazolin-3-one CI5H12F3NO4S
Magnesium nitrate. Mixture of: 5-chloro-2-methly-2H-isothiazol-3-one and 2-methyl-2H-5-chloro-2-methly-2H-isothiazol-3-one (3:1) confidential
confidential
Pyridine-2-thiol 1-oxide, sodium salt 2(1H)-Pyridione, 1-hydroxy- bronopol 2,2'Dithiobis(pyridine-l-oxide) CI4H17N507S2 confidential 4, 5-dichloro-N-octy1-4-isothiazolin-3-one
50 wt. % 98.4 wt. % 30 wt. % >96 wt. % n/a 14.0 wt. % 11.34 wt. % 0.05 wt. % 40.7 wt. % 99.4 wt. % >99 wt. % 41.3 wt. % n/a 80 wt. % 98.5 wt. %
Akno Nobel, Sweden
Janssen Phannaceutica N.V, Belgium Mallinckrodt Baker B.V., The Netherlands
Alcros Chemicals, England Sigma-Aldrich, Belgium Rohm and Haas Company, United Kingdom
Janssen Pharmaceutica N.V, Belgium Janssen Pharmaceutica NV, Belgium Janssen Phannaceutica N.V, Belgium Janssen Phannaceutica N.V, Belgium BTC Chemical Distribution Ltd, United Kingdom
Janssen Pharmaceutica NV, Belgium Sigma-Aldrich, Belgium
ECONEATM degradation
The degradability of the ECONEA Tm was examined indirectly by testing the effectiveness of the biocide against vegetative microalgae in different seawaters and light conditions over time. Two concentrations of ECONEA ® Technical (1 ppm, 10 ppm) were prepared in 200 ml of filtered seawater (28%0 salinity), 200 ml of filtered seawater (28%0 salinity) containing 0.1, 0.5 and 1 g of ballast tank sediment, and 200 ml of natural estuarine water collected from the Derwent (27.9%0) and Huon (25.9%0) Rivers in Southern Tasmania. Ballast tank sediment was collected from the MV Princess Betty (No. 3 Port topside tank) in Geelong, Australia on 26-11-1989 and stored at 4°C in the dark until use. Replicates of each biocide concentration were prepared allowing samples to be stored in the dark and under 12h light/12h dark at 17°C. Trials were conducted in triplicates and the degradability of the biocides was assessed weekly by applying the various ageing concentrations to four separate vegetative microalgal cultures (G. catenatum, A. catenella, P. reticulatum, C. marina). This method allowed a comparison of the sensitivity of the individual microalgal species to the ageing biocide concentrations. One ml of each culture was placed into individual wells of 24-well flat bottom microplates and the aging biocide samples were applied. This procedure was repeated weekly for up to 16 weeks. Cell viability was assessed following an exposure period of 48 h by calculating the percentage of non-viable cells for each of the various biocide concentrations and control treatments. Percentage cell viability was determined by counting the number of non-viable cells out of 100 total cells. Viability observations were conducted on a Zeiss inverted microscope (Zeiss Axiovert 25).
3.4 Results
Chemical treatment of vegetative microalgae
100 100
7
75 e 75>. >
V. 50 1-- 50
to os
3 25 3 25
0.025 0.05 0.1 0.25 0.5 1 0.025 0.05 0.1 0.25 0.5 1
concentration (ppm) concentration (ppm)
(C) (D)
100
75
_ 50
3 25
0.01 0.025 0.05 0.1 0.25 0.5 0.025 0.05 0.1 0.25 0.5 1
concentration (ppm) concentration (ppm)
(E) (F)
0.025 0.05 0.1 0.25 0.5 1 0.025 0.05 0.1 0.25 0.5 1
[image:34.557.60.511.64.558.2]concentration (ppm) concentration (ppm)
Fig. 1. Effect of varying concentrations of the biocide ECONEA® Technical on the viability of different vegetative microalgal species (48 h exposure). (A) Gymnodinium catenatum; (B) Chattonella marina; (C) Alexandrium catenella; (D) Karenia papilionacea; (E) Protoceratium reticulatum; (F) Scrippsiella trochoidea. Bars
100
F 75
'5 25 >. :LI 50 -12 es
(G)
F
—
:Et ea >
100 100
75
50
25
=
I.
I
(H)
.1.e
_ ' ".5 ea
>
loo
75
50
25
0.025 0.05 0.1 0.25 0.5 1 0.025 0.05 0.1 0.25 0.5 1
concentration (ppm) concentration (ppm)
(I)
100
. 75
>. -4= 50
0.025 0.05 0.1 0.25 0.5 1 2 4 6 8 10
concentration (ppm)
(J)
0.025 0.05 0.1 0.25 0.5 1 2 4 6 8 10 20
[image:35.557.70.513.72.552.2]concentration (ppm)
Fig. 1 cont.. Effect of varying concentrations of the biocide ECONEA® Technical on the viability of different vegetative microalgal species (48 h exposure). (G)
A. B.
Fig. 2. Morphological changes of vegetative Gymnodinium catenatum cells exposed to ECONEA® Technical. (A) Control treatment. (B) 48 h exposure to 0.5 ppm ECONEAC Technical.
100 -
....
e
z.
3 co
3
75 -
50 -
25 -
700 800 900 1000
concentration (ppm)
o 100
:I3 co 3 25
o
100 200 400 800 1000
concentration (ppm)
-es, 75
>. = 50 a ea > 25 100 o
(1)
100
75
e
k 50 ii co
> 25
0 (E)
(A) (B)
100 100
E
75 7 75>. ez: 50
-.13 C3 5 25
0
0.005 0.01 0.025 0.05 0.005 0.01 0.025 0.05 0.1 0.25
concentration (ppm) concentration (ppm)
(C) (D)
>. = 50 :13 ea
5 25
0
1000 2000 3000 4000 5000 0.05 0.1 0.025 0.5 1
[image:37.557.63.515.64.570.2]concentration (plan) concentration (ppm)
100 -
a
i 75
.1
503 25
1 2 3 4
concentration (ppm)
(G)
100
it; 75
k.
50co
-5 25
0
100
75
50 co 5 25
Iii
0.5 1 1.5 2I I
concentration (ppm)
(I)
0.5 1 2 3 4 5
concentration (ppm)
0.5 1 2 3 concentration (ppm)
100
a
l- 75
50
"rO
5 25
2 3 4 5 6 5 25 50 60 70
concentration (ppm) concentration (ppm)
(M)
F
. ; .. . - 3 7a c 0 3
100
75
50
25
(N)
e
a . . e x 3 o s 3100
75
50
25
25 50 75 100 50 100 150 200
concentration (ppm) concentration (ppm)
Fig. 3. cont. Effect of varying concentrations of the chemical biocides on the viability of vegetative cells of the dinoflagellate Alexandrium catenella (48 h exposure). (M) Hydrogen peroxide 30% treatment; (N) Oxy-PYRION® 98% treatment. Bars indicate standard error.
100
75
LI 50
5 25
1000 2500 5000 7500
concentration (ppm)
(E)
100
7 75
-4= 50 - :5
*5 25-
0
0.1 0.5 1 2
concentration (ppm)
(F) (A)
100
( 3)
100
079: 75 . 75
50 P: 50
.0
5 25 5 25
0 I 0
0.01 0.05 0.1 0.5 0.01 0.05 0.1 0.5
concentration (ppm) concentration (ppm)
(C) (D)
0.5 1 2 5 0.5 1 2 5
concentration (ppm) concentration (ppm)
25 50 100 200
concentration (ppm)
(G)
(1)
100 100
e 75 ow%
75
50 -= 50
5 25 3 25
0.5 1 5
concentration (ppm) 10
(3)
100 100
....
0 75 e 75
>.
1= 50 B co
1.
.. - = 50
5 25
0
5 25
1 2 5
concentration (ppm)
10
(K)
(1-4)
100 100
.
75 75*
. 50 50
as
3 25 '5 25
I ,
1 2 5 10
concentration (ppm)
25 50 75 100 50 100 200 500 1 000
concentration (ppm) concentration (ppm)
(C)
= 50
5
•
25 100
75 -
(D)
loo
zx, 75:t 50 :172 co
> 25
(A)
7
100
75
(B)
100
75
.2'
50 ft: 50ea
5 25 5 25
0 I 0
0.01 0.05 0.1 0.5 0.01 0.05 0.1 0.5
concentration (ppm) concentration (ppm)
1000 2500 5000 7500 0.1 0.5 1 2
concentration (ppm) concentration (ppm)
(E) (F)
100 100 -
F
75 - 50 - .35
•
25
7
75 ▪ 50 - :a5 25
0.5 1 2 5 2 5 10 20
concentration (ppm) concentration (ppm)
0.5 1 5 10
(G)
100
i.
,.:
-
.-
75 50 Aco 5 25
0E0
1 2 5 10 20
concentration (ppm)
(J)
100 00
100
irt 75
k
5016-31 5 25
0
concentration (ppm)
1 2 5 10 25 50 100 200
concentration (ppm) concentration (ppm)
100 100
at
ii
75—
50 1->. = 50
21 co 72 la
"5 25 5" 25
,
25 50 75
concentration (ppm)
100 50 100 200 500
concentration (ppm)
Table 3. Comparison of half maximal effective concentrations (EC50) of ECONEA® Technical and the 15 co-biocides against vegetative cells of Alexandrium catenella, Karenia papilionacea and Tetraselmis suecica (48 h exposure).
Product name
Alexandrium catenella
EC50 (ppm)
Karenia papdionacea Tetraselmis suecica
ARQUAD MCB-50 1.5 0.85 0.95
ECONEA® Technical 0.08 0.75 NA
Hydrogen peroxide 30% 27 8 39
Intercide OIT 3.1 3.1 3.1
Isoxaflutol PESTANAL® NA NA NA
ICATHONTm 886F Biocide 0.24 0.28 0.92
LAg 2006 041 1.65 5.3 6.1
LAg 2007 030 3100 2800 2950
Natrium PYRIONtil 40% 0.005 0.005 0.005
Oxy-PYRION® 98% 135 140 143
PROTECTNOL BN 1.22 0.72 NA
PYRION® Disulfide 40% Suspension 0.04 0.04 0.04
Rimsulfuron PESTANAL® NA NA NA
R090026 1.3 0.95 2.15
4, 5-dichloro-N-octy1-4-isothiazolin-3-one 5 13 40
Chemical treatment of dinoflagellate cysts
98%, LAg 2006 041), 1000 ppm (R090026) and 2500 ppm (Hydrogen peroxide 30%) to completely inactivate the dinoflagellate cysts (Tables 4.11 to 4.15).
Table 4.1. Germination success of resting cysts of the dinoflagellate G. catenatum after 2 weeks exposure to different concentrations of ECONEA® Technical.
Concentration (ppm)
Trial 1
Viable cysts (viable/total) Trial 2 Trial 3 Total
Total cyst germination (%)
0 (control) 19/22 31/37 32/35 82/94 87.2 ± 1.4
0.1 16/22 39/44 32/39 87/105 82.9 ± 2.7
0.5 32/36 19/26 22/27 73/89 82 + 2.6
2.5 27/32 21/34 33/44 81/110 73.6 ± 3.8
10 20/41 39/51 27/42 86/134 64.2 ± 4.6
50 23/44 27/43 72/109 122/196 62.2 ± 2.4
250 19/67 50/109 32/55 101/231 43.7 ± 5
1000 22/59 47/99 16/52 85/210 40.5 ± 2.8
Table 4.2. Germination success of resting cysts of the dinoflagellate
G.catenatum
after 2 weeks exposure to different concentrations of LAg 2007 030.
Concentration (ppm)
Trial 1
Viable cysts (viable/total) Trial 2 Trial 3 Total
Total cyst germination (%)
0 (control) 31/33 39/42 22/27 92/102 90.2 ± 2.3
100 40/52 44/52 32/37 116/141 82.3 ± 1.7
500 36/42 30/40 53/60 119/142 83.8 ±2.5
2500. 32/50 41/49 51/58 124/157 79 ± 4.3
10000 29/39 22/29 39/47 90/115 78.3 ±1.5
Table 4.3. Germination success of resting cysts of the dinoflagellate
G.catenatum
after 2 weeks exposure to different concentrations of Isoxaflutol PESTANAL®.
Concentration (ppm)
Trial 1
Viable cysts (viable/total) Trial 2 Trial 3 Total
Total cyst germination (%)
0 (control) 20/20 29/32 28/31 77/83 92.8 ± 1.8
100 28/29 38/42 30/35 96/106 90.6 ± 1.8
500 19/21 31/34 36/43 86/98 87.8 ±
2500 22/28 25/38 21/25 68/91 74.7 ± 3.1
10000 9/16 28/36 37/45 74/97 76.3 ±4.6
Table 4.4. Germination success of resting cysts of the dinoflagellate
G.catenatum
after 2 weeks exposure to different concentrations of Rimsulfuron PESTANAL®.
Concentration (ppm)
Trial 1
Viable cysts (viable/total) Trial 2 Trial 3 Total
Total cyst germination (%)
0 (control) 29/36 31/41 35/37 95/114 83.3 ± 3.3
100 35/50 27/42 31/48 93/140 66.4 ± 1.1
500 19/39 21/48 12/41 52/128 40.6 ± 3.4
2500 12/29 24/37 21/39 57/105 54.3 ± 3.9
Table 4.5. Germination success of resting cysts of the dinoflagellate G. catenatum
after 2 weeks exposure to different concentrations of 4, 5-dichloro-N-octy1-4-
isothiazolin-3-one.
Concentration (ppm)
Trial 1
Viable cysts (viable/total) Trial 2 Trial 3 Total
Total cyst germination (%)
0 (control) 29/32 39/44 41/45 109/121 90.1 ±0.4
100 71/86 38/46 29/39 138/171 80.7 ± 1.6
500 62/79 39/52 40/59 141/190 74.2 ± 1.8
2500 39/60 22/51 19/50 80/161 49.7 ±4.8
10000 0/29 0/52 0/44 0/125 0
Table 4.6. Germination success of resting cysts of the dinoflagellate G. catenatum
after 2 weeks exposure to different concentrations of Natrium PYRION® 40%.
Concentration (ppm)
Trial 1
Viable cysts (viable/total) Trial 2 Trial 3 Total
Total cyst germination (%)
0 (control) 37/42 26/28 29/42 92/112 82.1 ±4.2
0.1 28/34 20/27 22/27 70/88 79.5 ± 1.5
0.5 14/27 22/40 13/25 49/92 53.3 ±0.6
2.5 16/30 12/22 12/29 40/81 49.4 ±2.4
10 0/16 0/18 0/40 0/74 0
50 0/62 0/41 0/44 0/147 0
Table 4.7. Germination success of resting cysts of the dinoflagellate G. catenatum
after 2 weeks exposure to different concentrations of PYRION® Disulfide 40%
Suspension.
Concentration (ppm)
Trial 1
Viable cysts (viable/total) Trial 2 Trial 3 Total
Total cyst germination (%)
0 (control) 22/24 32/37 16/23 70/84 83.3 ± 3.9
0.1 36/43 29/33 27/35 92/111 82.9 ± 1.8
0.5 17/37 19/29 22/42 58/108 53.7 ± 3.3
2.5 33/49 23/40 19/32 75/121 62 ± 1.7
Table 4.8. Germination success of resting cysts of the dinoflagellate G. catenatum
after 2 weeks exposure to different concentrations of PROTECTNOL BN.
Concentration (ppm)
Trial 1
Viable cysts (viable/total) Trial 2 Trial 3 Total
Total cyst germination (%)
0 (control) 32/37 30/40 41/47 103/124 83.1 ± 2.3
1 49/55 51/57 42/56 142/168 84.5 ± 2.8
5 19/50 16/42 12/40 47/132 35.6 ± 1.5
25 0/60 0/39 0/47 0/146 0
100 0/52 0/51 0/38 0/141 0
Table 4.9. Germination success of resting cysts of the dinoflagellate G. catenatum
after 2 weeks exposure to different concentrations of ARQUAD MCB-50.
Concentration (ppm)
Trial 1
Viable cysts (viable/total) Trial 2 Trial 3 Total
Total cyst germination (%)
0 (control) 51/54 32/36 40/43 123/133 92.5 ± 1
1 30/39 22/28 13/41 65/108 60.2 ± 8.9
2.5 29/38 21/31 36/52 86/121 71.1 ± 1.5
25 7/51 13/59 6/32 26/142 18.3 ± 1.4
100 0/44 0/60 0/29 0/133 0
Table 4.10. Germination success of resting cysts of the dinoflagellate G. catenatum
after 2 weeks exposure to different concentrations of Intercide OIT.
Concentration (ppm)
Trial 1
Viable cysts (viable/total) Trial 2 Trial 3 Total
Total cyst germination (%)
0 (control) 31/33 42/49 22/27 95/109 87.2 ±2.1
5 12/19 22/39 20/40 54/98 55.1 ±2.2
25 20/27 9/19 12/22 41/68 60.3 ±4.6
100 0/37 0/41 0/45 0/123 0
Table 4.11. Germination success of resting cysts of the dinoflagellate
G. catenatumafter 2 weeks exposure to different concentrations of KATHONTm 886F Biocide.
Concentration (ppm)
Trial 1
Viable cysts (viable/total) Trial 2 Trial 3 Total
Total cyst germination (%)
0 (control) 31/38 47/51 39/45 117/134 87.3 ± 1.8
1 49/51 39/42 29/31 117/124 94.4 ±0.6
5 30/40 32/46 29/41 91/127 71.7 ± 1
25 21/41 37/45 22/48 80/134 59.7 ± 6.5
100 4/58 0/37 4/49 8/144 5.6± 1.5
500 0/71 0/50 0/31 0/152 0
Table 4.12. Germination success of resting cysts of the dinoflagellate
G. catenatumafter 2 weeks exposure to different concentrations of Oxy-PYRION® 98%.
Concentration (ppm)
Trial 1
Viable cysts (viable/total) Trial 2 Trial 3 Total
Total cyst germination (%)
0 (control) 51/60 37/41 32/42 120/143 83.9 ± 2.4
100 30/40 29/43 37/50 96/133 72.2 ± 1.4
500 0/77 0/41 0/35 0/153 0
2500 0/40 0/39 0/71 0/150 0
10000 0/42 0/60 0/57 0/159 0
Table 4.13. Germination success of resting cysts of the dinoflagellate
G. catenatumafter 2 weeks exposure to different concentrations of LAg 2006 041.
Concentration (ppm)
Trial 1
Viable cysts (viable/total) Trial 2 Trial 3 Total
Total cyst germination (%)
0 (control) 32/42 26/31 19/26 77/99 77.8 ± 1.9
5 31/58 22/40 24/39 77/137 56.2 ± 1.4
25 9/28 19/40 13/46 41/114 36 ± 3.7
100 4/41 3/49 5/42 12/132 9.1 ± 1
Table 4.14. Germination success of resting cysts of the dinoflagellate
G. catenatumafter 2 weeks exposure to different concentrations of R090026.
Concentration (ppm)
Trial 1
Viable cysts (viable/total) Trial 2 Trial 3 Total
Total cyst germination (%)
0 (control) 41/47 52/55 33/38 126/140 90 ± 1.4
1 27/30 22/26 27/32 76/88 86.4 ± 1.1
5 33/40 37/41 12/19 82/100 82 ± 4.6
25 18/26 22/31 17/22 57/79 72.2 ± 1.4
100 6/37 7/25 12/39 25/101 24.8 ±2.6
500 3/51 4/58 2/45 9/154 5.8 ± 0.4
1000 0/61 0/92 0/47 0/200 0
Table 4.15. Germination success of resting cysts of the dinoflagellate
G. catenatumafter 2 weeks exposure to different concentrations of Hydrogen peroxide 30%.
Concentration (ppm)
Trial 1
Viable cysts (viable/total) Trial 2 Trial 3 Total
Total cyst germination (%)
0 (control) 41/49 42/44 37/41 120/134 89.6 ±2
100 59/62 50/54 29/33 138/149 92.6 ± 1.2
500 31/42 29/41 33/40 93/123 75.6 ± 2
1000 9/44 7/51 9/34 25/129 19.4 ± 2.1
2500 0/27 0/41 0/67 0/135 0
ECONEA
Tm
degradation—X— Filtered seawater (L)
—4— Filtered seawater (D) 100 ▪ 80 :73 g 60 g ■ Tit 20 0
--X--- 1 g sediment (L) —a— 1 g sediment (D) 100
—X— 0.59 sediment (L) —4— 0.5 g sediment (D)
0
100
• 80
:73
CD 03 60
g •:/ 40
0 ▪ 20
0
— X-- Derwent River (L) — 4— Derwent River (D) loo • 80 ro
•
60 0, 3 g 40 • 20 0. 0 100—X— Huon River (L) —4— Huon River (D) 80
11.
• 6° S c ao 0 :E. 20 a 0
(A) (B)
100
• 80
CD re
▪
60 co .5 S c
40
2c1. 0 20 0.
0
7
—X— 0.1 g sediment (L) —6— 0.1 g sediment (D)
O 1 2 3 4 5 6 7 8 9 10
lime (weeks)
O 1 2 3 4 5 6 7 8 9 10
Time (weeks)
(C) (D)
O 1 2 3 4 5 6 7 8 9 10
Time (weeks)
O 1 2 3 4 5 6 7 8 9 10
Time (weeks)
(E) (F)
O 1 2 3 45 6 7 8 9
lime (weeks)
10 1 2 3 4 5 6 7 8 9 10 11 12
Time (weeks)
—X— Altered seawder (L) —2— Filtered seawder (D)
Pty
tcp
lai
kto
n v
iablity (%) 100 80 60 40 20
—X-- 0.1 g sediment (L) 0.1 g sediment (D) 100 ao -11 60 40 0 20 a 0
(C) (D)
100 -
a -1 80 - :8 g 40 I- I. 20 a.
—X— 1 g sediment (L) —e— 1 g sediment (D)
100
80
60
40
20
—X--- 0.59 sediment (L)
—0.59 sediment (D)
Phy top la nkton v ia bility ( %) 0 (A)
O 1 2 3 4 5 6 7 8 9 10
Trne (weeks)
(B)
0 1 2 3 4 5 6 7 8 9 10
Time (weeks)
O 1 2 3 4 5 6 7 8 9 10 0 1 2 3 4 5 6 7 8 9 10
Time (weeks) Time (weeks)
(E) (F)
Phy top la nkton v ia bility ( %) 100 80 so 40 20
—X-- Derwent River (L) Derwent River (D)
Phy
top
la
n
kto
n v
ia b ility ( %) 100 80 so 40 20
—X-- Huon River (L) — e— Huon River (D)
0
1 2 3 4 5 6 7 8 9 10 0 1 2 3 4 5 6 7 8 9 10
Time (weeks) Time (weeks)
Fig. 8. Sensitivity of Alexandrium catenella to the ageing 1 ppm ECONEA ® Technical • samples. Assessed weekly by applying the ageing 1 ppm biocide concentrations to
vegetative cells of the dinoflagellate Alexandrium catenella. (A) in filtered seawater.
100
F 80
6° 8 • 40 is 0 2, 20 0
(A) (B)
--X— Filtered seawater (L) Filtered seawater (D)
100
—X-0.1 g sediment (L) g sediment (D)
Phy top la nkton v ia bil ity ( %) 80 so ao 20 0 (D) (C) 10 10 0 1 2 3 4 5 6 7 8 9
Time (weeks)
O 1 2 3 4 5 6 7 8 9
Time (weeks)
—X— 1 g sediment (L) —1 g sediment (D) 100
F 80
g 40 0. 0 20 a- 0
—X— 0.59 sediment (L) 0.59 sediment (D)
100 80 so ao 20 Phy top lan kton v ia bil ity ( %) 0 100
7-e- 80
A
6040 - —X— Huon River (L)
Huon River (0) 20 -
a-
0 100
—X-- Derwent River (L) —a— Denvent River (D) • 80 g
▪
60 ao is 20 a. 0O 1 2 3 4 5 6 7 8 9 10 0 1 2 3 4 5 6 7 8 9 10
Time (weeks) Time (weeks)
(E) (F)
O 1 2 3 4 5 6 7 8 9 10 0 1 2 3 4 5 6 7 8 9 10
Time (weeks) Time (weeks)
O 1 2 3 4 5 6 7 8 9 10 Time (weeks) 100 Phy top lan kton v ia bility (
%) 80
so
ao
20
10 1 2 3 4 5 6
Time (weeks)
7 8 9 100
— X— 0.1 gsedirrent (L) — N— 0.1 gsaiirrent (D)
0
Phy
top
lEn
ktc
n v
ia
bility
(%) 80
60
40
20 —X-- Filtered seawater (L)
—N— Filtered seawater (D)
(C) (D)
—X— 1 g sediment (L) —•-- 1 g sediment (D)
Phy
top
la
nkto
n v
ia bility ( %) 100 so so 40 20 Phy top lan kton v ia bility ( %) 100 so so 40 20 0 —X— 0.5 g sediment (L)
—N— 0.5 g sediment (D)
(E) (F)
—X— Huon River (L) --N-- Huon River (D) 100 8 60 40 20 Phy top lan kton v ia bility ( %) 100 80 60
—X— Derwent River (L) —N--- Denvent River (D) 40 Phy top lan kton v ia bility ( %) 20 0
(A) (B)
O 1 2 3 4 5 6 7 8 9 10 0 1 2 3 4 5 6 7 8 9 10
Time (weeks) Time (weeks)
O 1 2 3 4 5 6 7 8 9 10 0 1 2 3 4 5 6 7 8 9 10
Time (weeks) Time (weeks)
(C) (D)
--*— 1 g sediment (L) --w-- 1 g sediment (D)
Phy
top
la
nkto
n v
ia bility ( %) 100 80 so 40 20 100
—X— 0.5 g sediment (L) —0.59 g sediment (D)
Phy top lan kton v ia bility (
%) so
so 40 20 100 so so 40 20 0
2 3 4 5 6 Time (weeks)
0
7 8 9 10 0 1 2 3 4 5 6 7 8 9 10 11 12 lime (weeks)
—X— Huon River (L) Huon River (D)
(A) (B)
100 100
Phy
top
la
nkto
n v
ia bility ( %) Phy top la nkto
n v
ia bil ity ( %) 40
—X— Altered seawater (L) —w— Filtered seawater (D)
—X— 0.1 g sediment (L) —w— 0.1 g sediment (D)
20 20
0 1 2 3 4 5 6 7 8 9 10 0 1 2 3 4 5 6 7 8 9 10
Time (weeks) lime (weeks)
0 1 2 3 4 5 6 7 8 9 10 0 1 2 3 4 5 6 7 8 9 10
Time (weeks) lime (weeks)
[image:57.557.66.508.60.576.2](E) (F)
Fig. 11. Sensitivity of Chattonella marina to the ageing 1 ppm ECONEA® Technical samples. Assessed weekly by applying the ageing 1 ppm biocide concentrations to vegetative cells of the raphidophyte Chattonella marina. (A) in filtered seawater. (B)
in filtered seawater containing 0.1 g of ballast sediment. (C) in filtered seawater containing 0.5 g of ballast sediment. (D) in filtered seawater containing 1 g of ballast sediment. (E) in seawater collected from the Derwent River. (F) in seawater collected from the Huon River. Samples were stored under both 12 light/12 h dark (L) and complete darkness (D).
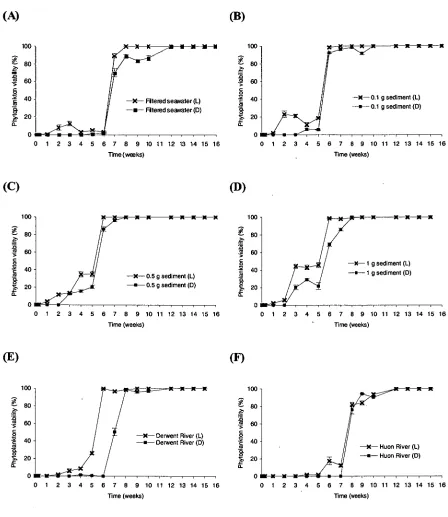
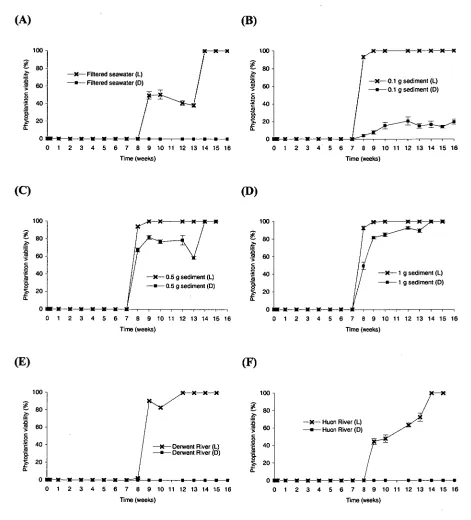
Figure 12 displays the degradation of the 10 ppm ECONEA® Technical samples. The influence of sediment load, water type and light conditions was much more pronounced in the 10 ppm trials compared to the 1 ppm experiments. The biocide degraded considerably faster when exposed to light compared to dark-stored samples, and the presence of sediment reduced biocide toxicity when stored under 12 h light/ 12 h dark (Fig. 12). One hundred percent viability of all microalgal species was only achieved in the sediment samples stored under 12 h light/ 12 h dark (Fig. 12B-D). All other biocide samples still impacted on the phytoplankton cell viability of one or more of the test species following a period of 16 weeks. The biocide remained the most toxic when prepared in filtered seawater and the natural estuarine waters of the Huon and Derwent Rivers (Fig. 12.A, E, F)
—X-0.1 g sediment (L) —w— 0.1 g sediment (D)
0 —X— Filtered seawater (L)
--w— Filtered seawater (D) 100
80 :-z-
.0
g. 60 40 • 20 o.
0
—XL-- 0.59 sediment (L)
—0.59 g sediment (D)
100 —X—X—X—X 100
8
g 60 fr>
40 20
0. —X— 1 g sediment (L) 1 g sediment (D)
100
F 8 Denvent River (L) --w-- Derwent River (D) 60 CA "5 40 is 0. :g, 20 0. 0
100 -
F 80-
:a —x— Huon River (L)
g 60- Huon River (D)
Sc • 40 is 20 - o. 0
(A) (B)
O 1 2 3 4 5 6 7 8 9 10 11 12 13 14 15 16
Time (weeks)
O 1 2 3 4 5 6 7 8 9 10 11 12 13 14 15 16
Time (weeks)
(C) (D)
0 1 2 3 4 5 6 7 8 9 10 11 12 13 14 15 16 Time (weeks)
O 1 2 3 4 5 6 7 8 9 10 11 12 13 14 15 16
Time (weeks)
(E) (F)
O 1 2 3 4 5 6 7 8 9 10 11 12 13 14 15 16
Time (weeks)
O 1 2 3 4 5 6 7 8 9 10 11 12 13 14 15 16
[image:59.557.63.508.65.570.2]Time (weeks)