1
Title: Pan-tropical climate interactions
1
Authors: Wenju Cai1,2, Lixin Wu*,1, Matthieu Lengaigne3,4 , Tim Li5, Shayne McGregor6,7,
Jong-2
Seong Kug8, Jin-Yi Yu9, Malte F. Stuecker10,11, Agus Santoso2,12, Xichen Li13, Yoo-Geun Ham14,
3
Yoshimitsu Chikamoto15, Benjamin Ng2, Michael J. McPhaden16, Yan Du17,18, Dietmar
4
Dommenget19, Fan Jia20, Jules B. Kajtar21, Noel Keenlyside22,23, Xiaopei Lin1, Jing-Jia Luo24,
5
Marta Martín-Rey25,26, Yohan Ruprich-Robert27, Guojian Wang1,2, Shang-Ping Xie28, Yun Yang29,
6
Sarah M. Kang30, Jun-Young Choi14, Bolan Gan1, Geon-Il Kim8, Chang-Eun Kim8, Sunyoung
7
Kim8, Jeong-Hwan Kim14, Ping Chang31
8
Affiliations:
9
1. Physical Oceanography Laboratory/CIMST, Ocean University of China and Qingdao National Laboratory for
10
Marine Science and Technology, Yushan Road, Qingdao 266003, China
11
2. Centre for Southern Hemisphere Oceans Research (CSHOR), CSIRO Oceans and Atmosphere, Hobart 7004,
12
Australia
13
3. Sorbonne Universités (UPMC, Univ Paris 06)-CNRS-IRD-MNHN, LOCEAN Laboratory, IPSL,
14
75005 Paris, France
15
4. Indo-French Cell for Water Sciences, IISc-NIO-IITM-IRD Joint International Laboratory, National Institute of
16
Oceanography, 403004 Dona Paula, India
17
5. Department of Atmospheric Sciences, University of Hawaii at Manoa, 2525 Correa Road, Honolulu, HI 96825,
18
USA
19
6. School of Earth Atmosphere and Environment, Monash University, Australia
20
7. ARC Centre of Excellence for Climate Extremes, Monash University, Australia
21
8. Division of Environmental Science & Engineering, Pohang University of Science and Technology (POSTECH), 77
22
Cheonam-Ro Nam-Gu Pohang 37673, South Korea
23
9. Department of Earth System Science, University of California at Irvine, 3315 Croul Hall, Irvine, CA 92697-3100,
24
USA
25
10. Center for Climate Physics, Institute for Basic Science (IBS), Busan 46241, Republic of Korea
26
11. Pusan National University, Busan 46241, Republic of Korea
27
12. Australian Research Council (ARC) Centre of Excellence for Climate Extremes, Level 4 Mathews Building, The
28
University of New South Wales, Sydney 2052, Australia
29
13. Institute of Atmospheric Physics, Chinese Academy of Sciences, China
30
14. Department of Oceanography, Chonnam National University, 77, Yongbong-ro, But-gu, Gwangju, 61186, South
31
Korea
32
15. Department of Plants, Soils and Climate, Utah State University, 4820 Old Main Hill, Logan, UT 84322, USA
33
16. NOAA/Pacific Marine Environmental Laboratory, Seattle, WA 98115, USA
34
17. State Key Laboratory of Tropical Oceanography, South China Sea Institute of Oceanology, Chinese Academy of
35
Sciences, Guangzhou, 510301, China.
36
18. University of Chinese Academy of Sciences, Beijing, 100049, China
37
19. ARC Centre of Excellence for Climate Extremes, School of Earth, Atmosphere and Environment, Monash
38
University, Rainforest Walk 9, Clayton, VIC 3800, Australia
39
20. Key Laboratory of Ocean Circulation and Waves, Institute of Oceanology, Chinese Academy of Sciences, Qingdao
40
266071, China
41
21. College of Engineering, Mathematics, and Physical Sciences, University of Exeter, North Park Road, Exeter, EX4
42
4QE, UK
43
22. Geophysical Institute, University of Bergen and Bjerknes Centre for Climate Research, Allegaten 70, 5007 Bergen,
44
Norway
45
23. Nansen Environmental and Remote Sensing Center and Bjerknes Centre for Climate Research, Bergen
46
24. Key Laboratory of Meteorological Disaster, Ministry of Education (KLME)/Joint International Research
47
Laboratory of Climate and Environmental Change (ILCEC)/Collaborative Innovation Center on Forecast and
48
Evaluation of Meteorological Disasters (CIC-FEMD), Nanjing University of Information Science and
49
Technology, Nanjing, 210044, People’s Republic of China.
50
25. UMR5318 CECI CNRS-CERFACS, Toulouse, Toulouse, France
51
26. Departamento de Física de la Tierra y Astrofísica, Universidad Complutense de Madrid (UCM), Madrid, Spain
52
27. Barcelona Supercomputing Center, Barcelona, Spain
53
28. Scripps Institution of Oceanography, University of California, San Diego, 9500 Gilman Drive, La Jolla, CA 92093,
54
USA
55
29. College of Global Change and Earth System Science, Beijing Normal University, Beijing 100875, China
56
30. School of Urban and Environmental Engineering, Ulsan National Institute of Science and Technology, Ulsan
57
44919, Republic of Korea
58
31. Department of Oceanography, 3146 TAMU, Texas A&M University, College Station, TX 77843, USA
59
*Correspondence to: Lixin Wu, Physical Oceanography Laboratory/CIMST, Ocean University
60
of China and Qingdao National Laboratory for Marine Science and Technology, Yushan Road,
61
Qingdao 266003, China (E-mail: [email protected])
2
One sentence summary: A complete understanding of how the tropics affect global climate
63
requires a unified perspective of inter-basin interactions.
64
Abstract: The El Niño-Southern Oscillation (ENSO), which originates in the Pacific, is the
65
strongest and most well-known mode of tropical climate variability. Its reach is global and it can
66
force climate variations of the tropical Atlantic and Indian Oceans by perturbing the global
67
atmospheric circulation. Less appreciated is how the tropical Atlantic and Indian Oceans affect the
68
Pacific. Especially noteworthy is the multi-decadal Atlantic warming that began in the late 1990s,
69
as recent research suggests that it has influenced Indo-Pacific climate, the character of the ENSO
70
cycle, and the hiatus in global surface warming. Discovery of these pan-tropical interactions
71
provides a pathway forward for improving predictions of climate variability in the current climate,
72
and for refining projections of future climate under different anthropogenic forcing scenarios.
73
Main text: Tropical ocean-atmosphere interactions significantly affect the global climate system
74
with socio-economic impacts that are felt worldwide. The El Niño-Southern Oscillation (ENSO)
75
(see Box 1 for key concepts) in the Pacific is the most prominent and consequential climate
76
variation on the planet, but there are other patterns of climate variability in the tropical Indian
77
and Atlantic Oceans that also have societal impacts. How these various patterns of climate
78
variability interact with one another is an ongoing matter of debate. In particular, the prevailing
79
view for many years was that variability in the Pacific had major impacts on the other two tropical
80
ocean basins, which in turn had only limited influence on the evolution of climate variability in the
81
Pacific. Multiple lines of new evidence now suggest that this view is incomplete and inaccurate.
82
Discovery of the Indian Ocean Dipole (IOD) (1, 2), for example, highlighted a climate scale
83
fluctuation in the Indian Ocean that arises through ocean-atmosphere interactions somewhat
84
similar to those that generate Pacific ENSO events. The consensus view originally was that ENSO
85
was largely responsible for energizing the IOD through changes in the Walker circulation, but we
86
now realize that year-to-year variations in Indian Ocean sea surface temperature (SST), related to
87
the IOD and particularly the Indian Ocean Basin (IOB) mode, can significantly feed back onto the
88
evolution of ENSO (3, 4). Similarly, in the past decade, we have come to appreciate how important
89
3
ENSO events because of how sensitive ENSO climate impacts are to the details of SST structure
91
and evolution (5, 6). We have also begun to recognize that the dynamics that govern this diversity
92
involve two-way interactions between the Atlantic and Pacific Oceans (7-10). In addition, the
93
hiatus in global surface warming during the late 1990s was associated with an unprecedented
94
intensification of the Pacific trade wind system and cooling of the tropical eastern Pacific (11, 12).
95
Although some studies highlight the role of Pacific only ocean-atmosphere feedbacks in forcing the
96
intensified trade winds (13, 14), and there is the possibility that changes in external forcing (e.g.,
97
aerosols) might have contributed to this intensification (15), other studies suggest that a complete
98
explanation may need to invoke forcing from decadal warming trends over the tropical Atlantic (16,
99
17) and Indian Oceans (17, 18) since the late 1990s.
100
The idea of pan-tropical interactions is not new (19) and such interactions should be expected
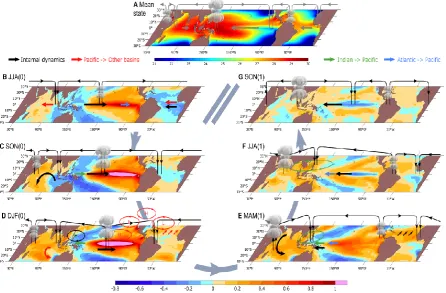
101
because the three tropical basins are connected via the atmospheric circulation. Recent evidence
102
suggests that these interactions are vigorous, and that the three tropical oceans are more tightly
103
connected than previously thought (16, 17). There is emerging evidence, for example, that in the
104
post-2000 period, the Atlantic Ocean exerted considerable influence on the Pacific and Indian
105
Oceans (7, 8, 10, 16, 17), impacting variability on interannual to decadal timescales. Specifically,
106
this Atlantic influence contributed to decadal changes in ENSO properties and to the hiatus in
107
surface global warming. However, fully-coupled climate models do not generate the observed
108
warming hiatus and the associated changes in tropical variability, in part due to severe systematic
109
biases in the Atlantic (20-22).
110
Interactions with higher latitudes can also influence the character of seasonal to decadal timescale
111
variability in the tropics and there is extensive literature on this topic (23, 24). Our purpose here
112
though is to review recent advances in our understanding of the dynamics of pan-tropical
113
interactions, including their decadal fluctuations, implications for seasonal and multi-year
114
predictions, and future climate projections. We show that the linkages between the Indian, Pacific,
115
and Atlantic Oceans can be exploited for improved seasonal to decadal climate predictions. To fully
116
realize the potential for improved prediction, climate model systematic errors, especially in the
117
tropical Atlantic, must be significantly reduced. Reducing these errors would also greatly increase
118
4
Indo-Pacific interactions120
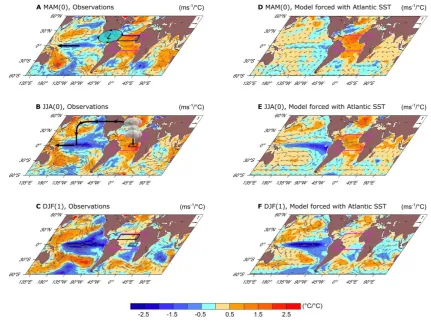
The Pacific Ocean and the Indian Ocean are connected through the atmosphere, via the Walker
121
circulation (19) (Fig. 1A), and through the ocean via the passages of the Indonesian Archipelago
122
(25). ENSO-induced changes in the Walker circulation often lead to an SST dipole pattern called
123
the IOD (1, 2), followed by a basin-scale warming (26) named the IOB mode (27). This canonical
124
evolution contributed to the perception that the Indian Ocean is slave to the Pacific, but new
125
research revealed a more dynamic Indian Ocean and its active role in shaping Pacific climate.
126
Along with reduced summer monsoon rainfall over the Indian subcontinent (28) a developing El
127
Niño can trigger a positive IOD by inducing easterlies over the equatorial Indian Ocean in boreal
128
summer (29) (Fig. 1B), but the IOD can occur independently of (30), and impact on (4), ENSO. An
129
IOD event usually develops in boreal summer, peaks in fall, and decays rapidly in the beginning
130
of winter. A positive Bjerknes feedback (Box 1) fosters the IOD development (1, 2). At its positive
131
phase, cold anomalies in the eastern Indian Ocean and warm anomalies in the western Indian
132
Ocean drive equatorial easterly wind anomalies in the central Indian Ocean that enhance the
133
anomalous temperature difference in a positive feedback (Fig. 1C), that can occur without ENSO.
134
Because the IOD is accompanied by a zonal dipole in atmospheric convection (Fig. 1C), its net
135
effect on the Western Pacific winds, and consequently on ENSO, is uncertain (31). However, strong
136
positive IODs may induce anomalous westerly winds in the western Pacific, contributing to El Niño
137
development (31, 32) (Fig. 1D). Thus although the observed statistical ENSO-IOD relationship
138
appears consistent with the IOD being a response to ENSO (33), the IOD is in part independent of
139
ENSO and has the potential to increase ENSO prediction lead times (3, 4).
140
The IOB, which is the dominant mode of interannual Indian Ocean SST variability, and stronger
141
in variance than the IOD, commences its development in boreal winter. An IOB warming is largely
142
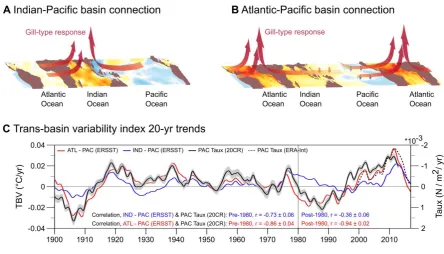
driven by reduced surface evaporation and increased downward shortwave radiation in response
143
to El Niño remote forcing (26). It usually reaches its maximum amplitude in boreal spring (26),
144
about one season after the mature phase of ENSO (Fig. 1E). However, the IOB is not simply a
145
passive response to ENSO either. ENSO excites the IOB like a battery charging a capacitor, but
146
5
capacitor (27, 34). In the southwest Indian Ocean where the thermocline is shallow (35, 36),
148
westward propagating downwelling Rossby waves in response to the weakened Walker circulation
149
induce SST warming beginning in boreal fall (35). This warming strengthens atmospheric
150
convection and triggers an asymmetric wind anomaly pattern across the equatorial Indian Ocean
151
in boreal spring (36) (Fig. 1E). The anomalous wind pattern contributes to a subsequent warming
152
in the north Indian Ocean through summer, which is in turn strengthened by a positive feedback
153
with the northwest Pacific anomalous anticyclone by radiating an atmospheric Kelvin wave (34)
154
(Fig. 1F). This coupled inter-basin mode leads to a strengthened Asian summer monsoon in the
155
post-El Niño summer (28, 37).
156
In contrast to the reinforcing role of a positive IOD, an IOB warming, though forced by El Niño,
157
hastens El Niño’s demise. As an El Niño matures, IOB warming induces enhanced convection over
158
the Indian Ocean which in turn enhances the northwest Pacific anomalous anticyclone and
159
easterly anomalies over the equatorial western Pacific (3) (Fig. 1, D and E). The advent of easterly
160
surface wind anomalies from boreal winter to the following summer expedites the El Niño demise
161
(3, 38). The IOB hence damps ENSO variability and contributes to its biennial timescale, as
162
corroborated by climate model experiments where the Indian Ocean is decoupled from the Pacific
163
(39-42). Despite their contrasting roles, a long-lasting IOB warming after a strong positive IOD
164
may lead to a fast phase transition of El Niño to La Niña (43). This is because an abrupt wind
165
change is fostered by the sequence of events that starts with a positive IOD contributing to an El
166
Niño, which in turn drives a strong IOB warming that then enhances central Pacific cooling (43,
167
44).
168
The relationship between variability of the two oceans is time-varying and asymmetric about their
169
positive and negative phases. ENSO exhibits a variety of spatial SST patterns, which have
170
different consequences on the Walker circulation response (45). The frequent occurrence of central
171
Pacific (CP) El Niño events in recent decades (46), which tend to have smaller amplitudes than
172
corresponding eastern Pacific (EP) El Niño events, might explain a recent weakening of the
ENSO-173
IOD relationship (45, 47). Because SST and atmospheric deep convection anomalies over the
Indo-174
Pacific are larger during El Niño compared to La Niña, an IOB warming is more efficient at
175
6
is more efficient in contributing to the demise of El Niño than an IOB cooling to the demise of La
177
Niña (38, 48). This asymmetric response contributes to ENSO duration asymmetry, with La Niña
178
typically lasting longer than El Niño (48).
179
Although changes in the atmospheric Walker circulation dominate ENSO interactions with both
180
the IOB and the IOD, the oceanic pathway across the Indonesian Seas has a prominent role in
181
Indo-Pacific exchanges. This flow, termed the Indonesian Throughflow, is a major component of
182
the global ocean circulation and plays a key role in the transport of mass, heat, and salt from the
183
Pacific to the Indian Ocean (25). Decadal changes in the Throughflow affect the background
184
thermal structure of the Indian Ocean, which can in turn modulate IOD characteristics (49).
185
During the recent hiatus in global surface warming, increased heat uptake in the Pacific was
186
shown to be partly transported to the Indian Ocean via the Throughflow (50). However, recent
187
studies suggest that the dynamics of the hiatus per se may involve interactions between the
188
Atlantic and Indo-Pacific (12, 16, 17).
189
Atlantic and Indo-Pacific interactions
190
Modeling and observational evidence suggests that two-way interactions between the tropical
191
Atlantic and Pacific operate on interannual timescales (10, 51). Tropical Atlantic variability, in
192
part forced by ENSO, feeds back onto ENSO. For example, decoupling the Atlantic Ocean in
193
otherwise fully coupled models generally leads to a stronger ocean-atmosphere coupling strength
194
in the equatorial Pacific, a shift to a lower ENSO frequency, and an increase in ENSO variance
195
(10, 19, 39, 41, 42, 52, 53).
196
El Niño-induced atmospheric heating forces the tropical Atlantic through two distinct pathways,
197
one of which is tropical and the other of which is extratropical. The tropical pathway involves a
198
weakening of the Walker circulation that in turn generates anomalous descending motion over the
199
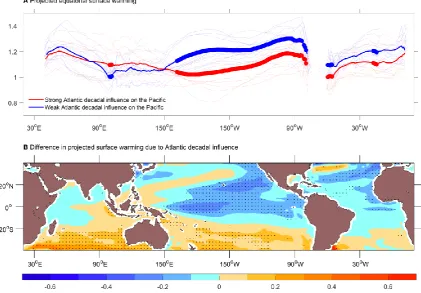
tropical Atlantic (24, 52). The extratropical pathway involves excitation of the Pacific–North
200
American (PNA) pattern with an anomalously low surface pressure center over the western
201
subtropical Atlantic (54) (red circles, Fig. 1D). As a result, the north tropical Atlantic (NTA; 10°
N-202
20°N) (northern black box, Fig. 2A) warms significantly, peaking in boreal spring 3-5 months after
203
7
latent heat flux due to a weakening of north-easterly trades, associated with a PNA low pressure
205
anomaly to the north, an anomalous descent to the south, and a sustained wind-evaporative-SST
206
(WES) effect (26) (Box 1; Fig. 1D). Models appear able to capture this Atlantic response (56, 57),
207
but there is uncertainty as to the relative role of the tropical and extratropical processes. This is
208
because the weakened northeasterly trades can be caused by the anomalous Walker and local
209
Hadley cells (58), a Gill-type response to Amazonian heating (59) (Box 1), or a tropospheric
210
temperature warming in response to El Niño (24, 60).
211
In turn, NTA anomalous warming has been suggested to impact ENSO. An NTA warming in boreal
212
spring excites an atmospheric Rossby wave that propagates westward, causing northeasterly wind
213
anomalies over the subtropical north-eastern Pacific (8) (Fig. 2A). This can generate cold SST and
214
low rainfall anomalies in subsequent seasons, inducing a low-level anticyclone further to the west
215
(Fig. 2B). The associated easterly wind anomalies in the western equatorial Pacific might in turn
216
initiate a La Niña (Fig. 2C). An atmospheric Kelvin wave response to the NTA warming can also
217
induce easterly anomalies through the Indian Ocean (61) (Fig. 2, A and B). This NTA forcing
218
tends to favor the CP type of ENSO (8, 10), consistent with an extratropical Pacific forcing of CP
219
ENSO events (62).
220
Another center of inter-basin interactions is the equatorial Atlantic (southern black box, Fig. 2B),
221
where the Atlantic Niño dominates (63). ENSO’s influence on the equatorial Atlantic is not robust
222
however, with only a weak concurrent correlation between ENSO and the equatorial Atlantic SST
223
(55, 64). During El Niño, a weakening Walker circulation and the associated easterly wind
224
anomalies along the equator in the Atlantic (Fig. 1B) tend to generate cold anomalies through the
225
Bjerknes positive feedback (65). However, this cooling may be offset by either tropospheric
226
warming in response to El Niño (66) and/or by oceanic downwelling Kelvin waves induced by a
227
meridional SST gradient due to warming in the NTA, propagating into the region (67). These
228
competing effects may contribute a weak influence of ENSO on equatorial Atlantic SST and to the
229
concurrent weak relationship between ENSO in the Pacific and the equatorial Atlantic SST.
230
By contrast, influence of the equatorial Atlantic on ENSO is robust since the 1970s, as reflected in
231
8
Pacific La Niña/El Niño by two seasons (64, 68-70). For example, an Atlantic Niño, which peaks in
233
boreal summer, induces anomalous ascending motion over the Atlantic and anomalous subsidence
234
over the central Pacific (Fig. 2B). The associated easterly wind anomalies over the central and
235
western equatorial Pacific excite an oceanic upwelling Kelvin wave that triggers the Pacific
236
Bjerknes feedback, conducive to development of a La Niña event six months later (71) (Fig. 2C).
237
The role of the tropical Atlantic on ENSO variability is corroborated by pacemaker climate model
238
experiments. When observed historical SST is prescribed over the tropical Atlantic, models are
239
able to reproduce the observed impact on ENSO (Fig. 2, D to F) (69-71). Figure 2 is based on the
240
ensemble average of a five-member ensemble pacemaker experiment over the period of 1980-2005,
241
in which full coupling is permitted everywhere except in the tropical Atlantic (30°S-30°N), where
242
SSTs are nudged to observations. This, along with other pacemaker experiments, shows that the
243
tropical Atlantic contributes to approximately 25% of Indo-Pacific SST variance (69-71). However,
244
as ENSO’s impact on Atlantic Niño is not as robust as on the NTA, the two-way interaction of the
245
Pacific with the NTA is stronger than with the equatorial Atlantic. An El Niño event during boreal
246
winter can induce NTA warming in the ensuing spring (Fig. 1E), in turn contributing to the
247
transition to a La Niña (Fig. 2, C and F) (10). This interaction constitutes a delayed negative
248
feedback for ENSO, shortening ENSO periodicity (42) as the IOB does (3, 38).
249
This two-way interaction between NTA variability and Pacific ENSO has been reported to have
250
strengthened since the late 1990s, coincident with the Atlantic Multi-decadal Variability (AMV,
251
see Box 1) switch to a positive phase and an increasing tendency for biennial CP ENSO events (8,
252
10). The positive phase of the AMV provides a warmer background NTA SST, which favors deep
253
convection and a strengthening of the NTA influence on the Pacific. Such a feedback appears to be
254
less active during a negative AMV phase, when the impact of the equatorial Atlantic tends to be
255
stronger (72) because of a southward shift of the Inter-Tropical Convergence Zone (ITCZ). This
256
shift leads to a stronger and wider westward extension of equatorial Atlantic interannual
257
variability, facilitating a strong influence on the central and eastern Pacific (73, 74). In addition,
258
winds associated with a negative AMV phase may cause the tropical Pacific mean thermocline to
259
9
The impact of the tropical Atlantic extends to the Indian Ocean and the Western Pacific, affecting
261
monsoons over these regions. An Atlantic Niño forces a Gill-type quadrupole response with a
low-262
level anticyclone located over India and the western North Pacific suppressing the monsoon
263
circulation (76, 77). The competing impacts of the Atlantic and ENSO on the monsoons may explain
264
the post-mid 1970s collapse of the ENSO-Indian monsoon relationship, in which a drier than
265
normal monsoon typically precedes an El Niño peak (76, 77). An alternative hypothesis is that
266
observed decadal changes in the ENSO-Indian monsoon relationship are explained by the noise in
267
the system (78).
268
Rise of the tropical Atlantic influence
269
As discussed in Sections 2 and 3, ENSO characteristics can be significantly influenced by SST
270
anomalies in the Indian and Atlantic Oceans. In this section, we describe similar inter-basin
271
interactions that operate on decadal timescales, highlighting how interaction between the Atlantic
272
and Indian Oceans with the Pacific Ocean changed in the 1990s. The Atlantic-Pacific connection
273
now appears as the most prominent inter-basin interaction.
274
The IPO phase transition that occurred in the late 1990s has led to an unprecedented acceleration
275
of the Walker circulation and contributed to the recent hiatus in global mean surface temperature
276
(11, 16, 17, 79), but what caused the IPO itself to change phase is not clear. The associated change
277
in wind stress curl increases ocean heat uptake (12, 80, 81) and the strengthened Walker
278
circulation intensifies the ITF, distributing the heat through the upper eastern Indian Ocean and
279
the Indonesian Seas (25, 80). Evidence suggests that the dynamics of these Pacific changes are not
280
entirely internal to the Pacific, and forcing from the Indian and Atlantic Oceans needs to be
281
considered (12, 16, 82).
282
On decadal and multi-decadal timescales, the Indian Ocean also influences the Pacific through the
283
tropical atmospheric bridge (3, 38). Surface warming in the Indian Ocean, relative to the Pacific
284
basin, leads to overlying deep convection and associated Walker circulation changes across the
285
Indo-Pacific region that increase the surface easterlies in the western and central Pacific (18) (Fig.
286
3A). Because the temperature threshold for deep convection increases with the mean tropical
287
10
basin SST gradient to remove the mean tropical warming (blue curve, Fig. 3C). The
trans-289
basin gradient displays a good relationship with the Pacific winds (black curve, Fig. 3C), which
290
eventually drives a La Niña-like state through the Pacific Bjerknes feedback. But this relationship
291
has weakened in recent decades (82, 84), as indicated by reduced coherence between trends of
292
Indian-minus-Pacific inter-basin SST gradients and equatorial central Pacific zonal wind stress
293
(blue and black curves, Fig. 3C), but whether stochastic forcing plays a role is not clear (78).
294
Relative to the Indian Ocean, the Atlantic Ocean appears to have a greater influence on Pacific
295
decadal variability in recent decades, and this can be conducted via extratropical and tropical
296
pathways. One proposed extratropical pathway is that a warm North Atlantic SST anomaly
297
weakens storm tracks over the North Atlantic and the North Pacific mid-latitudes, generating an
298
anomalous North Pacific high pressure and a PNA pattern over the North Pacific (85). Another
299
proposed extratropical connection is that warming in the North Atlantic enhances local convection
300
but increases subsidence in the North Pacific, contributing to the high pressure over the
301
subtropical North Pacific, which decreases the wind speed of the subtropical North Pacific
302
westerlies and induces a north-western subtropical Pacific warming through the WES effect and
303
other processes (86). However, recent research suggests that these extratropical pathways play a
304
minor role compared to the tropical pathway (87). Tropical Atlantic warming drives a convective
305
response and an associated diabatic atmospheric heating anomaly, the magnitude of which is
306
dependent on the magnitude of Atlantic SST anomalies relative to the tropical mean SSTs. This
307
difference can be represented by a tropical Atlantic-minus-Pacific trans-basin SST gradient (red
308
curve, Fig. 3C), also called Trans-Basin Variability (TBV) (16, 88). The tropical Atlantic diabatic
309
heating leads to a Gill-type (Box 1) response that results in an anomalous rising Walker circulation
310
branch over the tropical North Atlantic and an anomalous sinking branch over the tropical central
311
and eastern Pacific (16, 17, 75, 87, 89, 90) (Fig. 3B). The associated surface circulation anomalies
312
lead to WES-induced surface cooling in the eastern/central Pacific and warming in the
off-313
equatorial western Pacific. These processes intensify the Pacific Walker circulation through the
314
Bjerknes feedback and lead to a La Niña–like state within the Pacific (16, 17), mechanisms similar
315
11
Tropical Atlantic forcing of the Pacific can also be enhanced through the Indian Ocean, whereby
317
the Atlantic Ocean-forced Indo-Pacific easterly wind anomalies of the Gill-type response generate
318
the Indo-Pacific warming via the WES effect (17). This Indo-western Pacific warming in turn
319
intensifies the La Niña-like response by enhancing the Pacific trade winds through a mechanism
320
similar to the IOB’s role in the transition from El Niño to La Niña (3, 38) (Fig. 3D).
321
The Atlantic influence in recent decades can be reproduced in coupled simulations forced with SST
322
anomalies only in the tropical Atlantic (16, 17). This includes a La Niña-like state that is shown to
323
lead to a higher frequency of La Niña than El Niño events (87), which is consistent with
324
observations since 2000. Similar coupled simulations forced with Indian Ocean SST anomalies find
325
only a limited role for the recent observed Indian Ocean warming alone (16, 17). Thus, since the
326
late 1990s, the tropical Atlantic warming appears to have affected the entire tropics, while the
327
induced Pacific response has contributed to the global temperature hiatus and its many regional
328
impacts (11). However, it is not clear whether, or to what extent, the rise of the Atlantic influence
329
is related to the loss of connectivity between the Indian and Pacific Oceans. It remains an open
330
question as to what caused the recent (1992–2011) decadal warming trend in the tropical Atlantic
331
or what is the relative importance of internal variability and external forcing (92).
332
Implications of pan-tropical interactions
333
Classical prediction frameworks rely only on internal Pacific precursors such as the equatorial
334
Pacific warm water volume (93, 94), which leads the ENSO SST signal by 6-9 months. The fact
335
that ENSO properties and the Pacific decadal changes are affected by the Indian and Atlantic
336
Oceans offers additional precursors (green and purple boxes, Fig. 4, A to C). However, these
337
precursors are not well simulated by the majority of climate models (Fig. 4, D to F).
338
Knowledge of Indian Ocean conditions has been shown to improve ENSO forecasts (4, 32).
339
Incorporating information from an extreme positive IOD leads to improved prediction of the
340
1994/95 CP El Niño and of the intensity of the extreme El Niño in 1997/98; incorporating
341
information of the IOD and the IOB combined improves the predicted ENSO evolution (32),
342
particularly the phase transition from an El Niño to La Niña (4). In a similar vein, knowledge of
343
12
96). Hindcast experiments with additional equatorial Atlantic SST information increases
345
predictability of the major 1982/1983 and 1997/1998 El Niño events (95). Further, NTA SST offers
346
an independent precursor for ENSO. For example, since 1980, three out of the four cases of boreal
347
spring NTA cooling (i.e. 1986, 1994, and 2009) were followed by a CP El Niño in winter, and all
348
cases of boreal spring NTA warming (i.e., 1980, 1988, 1998, and 2010) were followed by a Pacific
349
La Niña (91). Since the NTA and the equatorial Atlantic contribute to predictive skill over the
350
central and eastern Pacific, respectively (91), these Atlantic precursors may offer potential for
351
prediction of ENSO diversity.
352
Combining Indian and Atlantic Ocean precursors (Fig. 4, A to C) with those internal to the Pacific
353
may considerably increase ENSO prediction skill (53) (Fig. 4G), particularly in recent decades
354
(Fig. 4H). Enhanced ENSO prediction as a result of incorporating inter-basin precursors, in turn,
355
could contribute to Atlantic and Indian Ocean climate prediction. Dynamical prediction
356
experiments show that incorporating tropical Pacific information greatly enhances the predictive
357
skill of the IOD and the IOB (97) and the tropical Atlantic climate (98). Understanding pan-tropical
358
interactions is therefore crucial for improving prediction of interannual tropical climate, its
359
atmospheric teleconnections, and its global impacts.
360
The Atlantic contribution to Indo-Pacific climate predictability extends to multi-year timescales.
361
Although internally generated decadal climate variability in the extratropical North Atlantic and
362
North Pacific is predictable by up to half a decade in advance (99, 100), such skill is still elusive
363
for tropical climate. The influence of tropical Atlantic SST variability associated with the AMV can
364
be utilized for Pacific decadal prediction (87, 101). Such prediction skill is achieved via a global
365
reorganization of the Walker circulation, which can be represented by a TBV index measuring the
366
tropical SST gradient between the Pacific and the other two oceans (101). The index displays
367
predictability at multi-year lead times with contributions from the Atlantic and Indian Oceans. In
368
particular, the Atlantic influence considerably increases decadal predictability in the central
369
Pacific SST (88).
370
Most state-of-the-art climate models fail to reproduce the observed pan-tropical interactions. In
371
13
variability (22), and the IOD (103) (Fig. 4, D to F), the majority of models produce too weak of a
373
relationship between decadal trends of the TBV and Pacific trade winds (21). In fact, the
374
relationship between trends of tropical Atlantic SST and equatorial Pacific trade winds is opposite
375
to that observed in most models (21). This unrealistic relationship is partially associated with a
376
bias in the tropical Atlantic mean state (20, 21), which features a weaker than observed, or even
377
reversed, west-minus-east equatorial SST gradient. This bias leads to a weak convective response
378
to Atlantic SST anomalies and a weaker Walker circulation response that is shifted to the east, the
379
consequence of which is an unrealistic relationship between the Atlantic and Pacific (20).
380
Systematic model errors in pan-tropical interactions may be in part responsible for the inability of
381
models to simulate the recent global warming hiatus (20, 103), in which greenhouse warming was
382
offset by a cooling trend in the tropical Pacific (11, 12). Further, faster warming in the Indian
383
Ocean than the Pacific, as observed over the past decades, is conducive to easterlies in the western
384
Pacific (18, 84), through mechanisms similar to those operating on interannual timescales
385
associated with an IOB warming (3). Given that Indian Ocean warming is at least in part driven
386
by Atlantic warming in recent decades (17), systematic errors in the Atlantic-Pacific relationship
387
might have suppressed important processes. The suppression of these processes may be responsible
388
for the projected greater warming in the equatorial eastern Pacific under greenhouse warming.
389
Therefore, correcting the biases in the Atlantic-Pacific relationship may lead to reduced eastern
390
equatorial Pacific warming in climate projections.
391
Without properly accounting for Atlantic-Pacific and Atlantic-Indian Ocean interactions, the
392
potential for an Atlantic warming-induced Pacific cooling is muted. Thus, this bias may have far
393
reaching implications for projections of future climate, particularly in Pacific mean state change.
394
For example, models exhibiting a stronger correlation between decadal trends of the TBV index
395
and equatorial Pacific trade winds tend to project a weakened future warming in the tropical
396
Pacific compared to those with a weaker decadal coupling (Fig. 5, A and B), supporting the notion
397
that a realistic representation of pan-tropical interactions in climate models may substantially
398
modify the projected Pacific mean state change (22).
399
14
Pan-tropical interactions are more vigorous than previously thought and the three ocean basins
401
are more tightly interconnected than previously realized. In addition to well-known Pacific Ocean
402
influences on the Indian and the Atlantic Oceans, there are highly consequential feedbacks from
403
these two basins on the Pacific on interannual to decadal timescales. For example, a positive NTA
404
SST anomaly in boreal spring can trigger a central Pacific La Niña (8, 10), whereas an equatorial
405
Atlantic Niña in boreal summer can force an EP El Niño (64), thereby contributing to ENSO
406
diversity. Similarly, a positive IOD can favor the onset of El Niño and an El Niño-forced IOB can
407
accelerate the demise of an El Niño and its transition to La Niña (3, 4, 32). Modeling studies
408
suggest that the net impact of the Indian and Atlantic Oceans on the ENSO cycle damps its
409
amplitude and increases its frequency (3, 38, 41, 42).
410
These tropical inter-basin linkages vary significantly on decadal timescales. In particular, tropical
411
warming associated with the positive phase of the AMV over the past two decades represents a
412
major forcing on the Pacific and Indian Oceans (16, 17). This tropical Atlantic warming contributed
413
to an extraordinary intensification of the Pacific trade winds accompanied by surface cooling in the
414
eastern tropical Pacific, an increased ITF heat transport from the Pacific to the Indian Ocean, and
415
an increased sequestration of heat in the Indian Ocean. A warmer Indian Ocean in turn also
416
favored further intensification of the Pacific trade winds through changes in the Walker circulation
417
(17, 84). In this scenario, the tropical Atlantic emerges as pivotal in driving the recent hiatus in
418
global surface warming.
419
Our knowledge of the pan-tropical inter-basin interactions is still in its infancy and many
420
uncertainties exist. Given the relatively short observational record that dates back only to the
421
second half of the 19th century, our ability to clearly define and understand inter-basin
422
interactions across the full range of interannual to decadal and longer timescales is limited. For
423
instance, available observations suggest that the sign of the AMV determines whether the
424
equatorial Atlantic Niño (for negative AMV) or the NTA (for positive AMV) is the most active
425
pathway of influence on the Pacific (74). However, the relative importance of these two Atlantic
426
SST modes in exciting inter-basin teleconnections is largely unknown. Whether these AMV
427
influences are robust and what causes this multi-decadal modulation in inter-basin teleconnections
428
15
Much of the new insight about the tropical Atlantic’s role in tropical inter-basin interactions
430
emerges from observations since 2000, when the AMV turned positive and reached its highest
431
value in the instrumental record. It is unclear however what the relative importance of natural
432
climate variability and anthropogenic forcing is in driving this Atlantic warming, whether the
433
recent Atlantic influence on pan-tropical climate is reinforced by anthropogenic forcing, or how
434
inter-basin interactions may affect the climate of the topics in the future. Climate modeling studies
435
to address these issues are unfortunately compromised by pronounced systematic errors in the
436
tropical Atlantic that severely suppress interactions with the Indian and Pacific Oceans (20-22).
437
These model biases in particular could have a substantial impact on the simulated ENSO
438
characteristics and the Pacific mean state. As a result, there could be considerable uncertainty in
439
future projections of Indo-Pacific climate variability and the background conditions in which it is
440
embedded. Projections based on the current generation of climate models suggest that Indo-Pacific
441
mean state changes will involve slower warming in the eastern than in the western Indian Ocean
442
and a faster warming in the east equatorial Pacific than the surrounding regions (104). Given the
443
presumed strength of the Atlantic influence on the pan-tropics, projections of future climate change
444
could be substantially different if model systematic errors in the Atlantic were corrected.
445
Nevertheless, recent advances in our understanding of the pan-tropical interactions provide
446
valuable guidance for setting research priorities. Among these is the urgent need to reduce model
447
systematic errors in the Atlantic as one key ingredient to enable further progress and there have
448
been efforts to solve this (105). It has been extraordinarily difficult to remedy such errors as we
449
have learned from the Pacific cold tongue and double ITCZ biases, problems for which there has
450
been no solution for decades. Thus, it is essential that we understand the fundamental processes
451
that govern the Atlantic mean state, including interactions between tropical winds, SST, the upper
452
ocean, atmospheric convection, and the role of equatorial ocean mixing. Given the shortness of the
453
instrumental record, studies that take advantage of much longer paleo proxy records can be a
454
valuable source of information on inter-basin interactions in the past. There is also potential for a
455
substantial improvement in ENSO and multi-year predictions, by exploiting the dynamical
456
linkages outside the Pacific basin (88). Success on this front requires a deeper understanding of
457
16
Coordinated modeling studies, including pacemaker experiments, can be used to examine the
459
mechanisms that underpin these tropical inter-basin interactions and their importance relative to
460
extra-tropical influences. Given that the mean state errors in the tropical Atlantic are systematic,
461
flux adjustments in climate models can also be a useful approach for exploring inter-basin
462
interactions in the current climate and potentially in the future as well under differing climate
463
change forcing scenarios. Ultimately, making progress in this enterprise will depend critically on
464
sustained global climate observations, climate model improvements, and theoretical developments
465
that help us to better understand the underlying dynamics of pan-tropical interactions and their
466
climatic impacts.
467
References and Notes:
468
1. N. H. Saji, B. N. Goswami, P. H. Vinayachandran, T. Yamagata, A dipole mode in the
469
tropical Indian Ocean. Nature 401, 360-363 (1999).
470
2. P. J. Webster, M. D. Moore, J. P. Loschnigg, R. R. Lebel, Coupled ocean-atmosphere
471
dynamics in the Indian Ocean during 1997-98. Nature 401, 356-360 (1999).
472
3. J.-S. Kug, I.-S. Kang, Interactive feedback between ENSO and the Indian Ocean. J. Clim.
473
19, 1784–1801 (2006).
474
4. T. Izumo, J. Vialard, M. Lengaigne, C. de Boyer Montegut, S. K. Behera, J.-J. Luo, S.
475
Cravatte, S. Masson, T. Yamagata, Influence of the state of the Indian Ocean Dipole on the
476
following year's El Nino. Nat. Geo. 3, 168–172 (2010).
477
5. K. Ashok, S. K. Behera, S. A. Rao, H. Weng, T. Yamagata, El Niño Modoki and its possible
478
teleconnection. J. Geophys. Res. 112, C11007 (2007).
479
6. Capotondi, A. T. Wittenberg, M. Newman, E. D. Lorenzo, J.-Y. Yu, P. Braconnot, J. Cole,
480
B. Dewitte, B. Giese, E. Guilyardi, F.-F. Jin, K. Karnauskas, B. Kirtman, T. Lee, N.
481
Schneider, Y. Xue, S.-W. Yeh, Understanding ENSO diversity. Bull. Am. Meteorol. Soc. 96,
482
921–938 (2015).
483
7. L. Wu, F. He, Z. Liu, Coupled ocean-atmosphere response to north tropical Atlantic SST:
484
Tropical Atlantic Dipole and ENSO. Geophys. Res. Lett. 32, L21712 (2005).
485
8. Y.-G. Ham, J.-S. Kug, J.-Y. Park, F.-F. Jin, Sea surface temperature in the north tropical
486
17
9. F. Jia, L. Wu, B. Gan, W. Cai, Global warming attenuates the tropical Atlantic-Pacific
488
teleconnection. Sci. Rep. 6, 20078 (2016).
489
10. L. Wang, J.-Y. Yu, H. Paek, Enhanced biennial variability in the Pacific due to Atlantic
490
capacitor effect. Nat. Commun. 8, 14887 (2017).
491
11. Y. Kosaka, S.-P. Xie, Recent global-warming hiatus tied to equatorial Pacific surface
492
cooling. Nature 501, 403-407 (2013).
493
12. M. H. England, S. McGregor, P. Spence, G. A. Meehl, A. Timmermann, W. Cai, A. Sen
494
Gupta, M. J. McPhaden, A. Purich, A. Santoso, Recent intensification of wind-driven
495
circulation in the Pacific and the ongoing warming hiatus. Nat. Clim. Change 4, 222-227
496
(2014).
497
13. G. A. Meehl, A. Hu, Megadroughts in the Indian Monsoon Region and Southwest North
498
America and a Mechanism for Associated Multidecadal Pacific Sea Surface Temperature
499
Anomalies. J. Clim. 19, 1605-1623 (2016).
500
14. R. Farneti, F. Molteni, F. Kucharski, Pacific interdecadal variability driven by tropical–
501
extratropical Interactions. Clim. Dyn. 42, 3337–3355 (2014).
502
15. C. Takahashi, M. Watanabe, Pacific trade winds accelerated by aerosol forcing over the
503
past two decades. Nat. Clim. Change 6, 768-772 (2016).
504
16. S. McGregor, A. Timmermann, M. F. Stuecker, M. H. England, M. Merrifield, F.-F. Jin, Y.
505
Chikamoto, Recent Walker Circulation strengthening and Pacific cooling amplified by
506
Atlantic warming, Nat. Clim. Change 4, 888-892 (2014).
507
17. X. Li, S.-P. Xie, S. T. Gille, C. Yoo, Atlantic induced pan-tropical climate change over the
508
past three decades, Nat. Clim. Change. 6, 275-279 (2016).
509
18. J.-J. Luo, W. Sasaki, Y. Masumoto, Indian Ocean warming modulates Pacific climate
510
change. Proc. Nat. Acad. Sci. 46,18701-18706 (2012).
511
19. M. Latif, T. Barnett, Interactions of the tropical oceans. J. Clim. 8, 952–964 (1995).
512
20. S. McGregor, M. F. Stuecker, J. B. Kajtar, M. H. England, M. Collins, Model tropical
513
Atlantic biases underpin diminished Pacific decadal variability. Nat. Clim. Change 8,
493-514
18
21. J. B. Kajtar, A. Santoso, S. McGregor, M. H. England, Z. Baillie, Model
under-516
representation of decadal Pacific trade wind trends and its link to tropical Atlantic bias.
517
Clim. Dyn. 50, 1471-1484 (2018).
518
22. F. Kucharski, F. S. Syed, A. Burhan, I. Farah, A. Gohar, Tropical Atlantic influence on
519
Pacific variability and mean state in the twentieth century in observations and CMIP5.
520
Clim. Dyn. 44, 881-896 (2015).
521
23. Timmermann, S.-I. An, J.-S. Kug, F.-F. Jin, W. Cai, A. Capotondi, K. Cobb, M. Lengaigne,
522
M. J. McPhaden, M. F. Stuecker, K. Stein, A. T. Wittenberg, K.-S. Yun, T. Bayr, H.-C.
523
Chen, Y. Chikamoto, B. Dewitte, D. Dommenget, P. Grothe, E. Guilyardi, Y.-G. Ham, M.
524
Hayashi, S. Ineson, D. Kang, S. Kim, W. Kim, J.-Y. Lee, T. Li, J.-J. Luo, S. McGregor, Y.
525
Planton, S. Power, H. Rashid, H.-L. Ren, A. Santoso, K. Takahashi, A. Todd, G.-M.Wang,
526
G. Wang, R. Xie, W.-H. Yang, S.-W. Yeh, J. Yoon, E. Zeller, X. Zhang, El Niño–Southern
527
Oscillation complexity. Nature 559, 535–545 (2018).
528
24. P. Chang, T. Yamagata, P. Schopf, S. K. Behera, J. Carton, W. S. Kessler, G. Meyers, T.
529
Qu, F. Schott, S. Shetye, S.-P. Xie, Climate fluctuations of tropical coupled systems—the
530
role of ocean dynamics. J. Clim. 19, 5122-5174 (2006).
531
25. J. Sprintall, A. L. Gordon, A. Koch-Larrouy, T. Lee, J. T. Potemra, K. Pujiana, S. E. Wijffels,
532
The Indonesian seas and their role in the coupled ocean–climate system. Nat. Geo. 7, 487–
533
492 (2014).
534
26. S. A. Klein, B. J. Soden, N. C. Lao, Remote sea surface temperature variations during
535
ENSO: Evidence for a tropical atmospheric bridge. J. Clim. 12, 917–932 (1999).
536
27. J. Yang, Q. Liu, S.-P. Xie, Z. Liu, L. Wu, Impact of the Indian Ocean SST basin mode on
537
the Asian summer monsoon. Geophys. Res. Lett. 34, L02708 (2007).
538
28. V. Mishra, B. V. Smoliak, D. P. Lettenmaier, J. M. Wallace, A prominent pattern of
year-539
to-year variability in Indian Summer Monsoon Rainfall. Proc. Nat. Acad. Sci. 109, 7213–
540
7217 (2012).
541
29. H. Annamalai, R. Murtugudde, J. Potemra, S.-P. Xie, P. Liu, B. Wang, Coupled dynamics
542
over the Indian Ocean: spring initiation of the Zonal Mode. Deep Sea Res. 50, 2305–2330
543
19
30. S. Fischer, P. Terray, E. Guilyardi, S. Gualdi, P. Delecluse, Two independent triggers for
545
the Indian Ocean Dipole/Zonal Mode in a coupled GCM. J. Clim. 18, 3428–3449 (2005).
546
31. H. Annamalai, S. Kida, J. Hafner, Potential impact of the tropical Indian Ocean–
547
Indonesian Seas on El Niño characteristics. J. Clim. 23, 3933–3952 (2010).
548
32. J.-J. Luo, R. Zhang, S. K. Behera, Y. Masumoto, Interaction between El Niño and extreme
549
Indian Ocean Dipole. J. Clim. 23, 726–742 (2010).
550
33. M. F. Stuecker, A. Timmermann, F.-F. Jin, Y. Chikamoto, W. Zhang, A. T. Wittenberg, E.
551
Widiasih, S. Zhao, Revisiting ENSO/Indian Ocean Dipole phase relationships. Geophys.
552
Res. Lett. 44, 2481–2492 (2017).
553
34. S.-P. Xie, K. Hu, J. Hafner, H. Tokinaga, Y. Du, G. Huang, T. Sampe, Indian Ocean
554
capacitor effect on Indo–Western Pacific climate during the summer following El Niño. J.
555
Clim. 22, 730–747 (2009).
556
35. S.-P. Xie, H. Annamalai, F. A. Schott, Structure and mechanisms of south Indian Ocean
557
climate variability. J. Clim. 15, 864–878 (2002).
558
36. Y. Du, S.-P. Xie, G. Huang, K. Hu, Role of air–sea interaction in the long persistence of El
559
Niño–induced north Indian Ocean warming. J. Clim. 22, 2023–2038 (2009).
560
37. S.-P. Xie, Y. Kosaka, Y. Du, K. Hu, J. S. Chowdary, G. Huang, Indo-Western Pacific Ocean
561
capacitor and coherent climate anomalies in post-ENSO summer: a review. Adv. Atmos.
562
Sci. 33, 411-432 (2016).
563
38. M. Ohba, H. Ueda, An impact of SST anomalies in the Indian Ocean in acceleration of the
564
El Niño to La Niña transition. J. Meteor. Soc. Jap. 85, 335–348 (2007).
565
39. D. Dommenget, V. Semenov, M. Latif, Impacts of the tropical Indian and Atlantic Oceans
566
on ENSO. Geophys. Res. Lett. 33, L11701 (2006).
567
40. Santoso, M. H. England, W. Cai, Impact of Indo-Pacific feedback interactions on ENSO
568
dynamics diagnosed using ensemble climate simulations. J. Clim. 25, 7743–7763 (2012).
569
41. J. S. Kug, T. Li, S. I. An, I.S. Kang, J. J. Luo, S. Masson, T. Yamagata, Role of the ENSO–
570
Indian Ocean coupling on ENSO variability in a coupled GCM. Geophys. Res. Lett. 33,
571
20
42. D. Dommenget, Y. Yu, The effects of remote SST forcings on ENSO dynamics, variability
573
and diversity. Clim. Dyn. 49, 2605-2624 (2017).
574
43. T. Izumo, J. Vialard, H. Dayan, M. Lengaigne, I. Suresh, A simple estimation of equatorial
575
Pacific response from windstress to untangle Indian Ocean Dipole and Basin influences on
576
El Niño. Clim Dyn. 46, 2247–2268 (2016).
577
44. K.-J. Ha, J.-E. Chu, J.-Y. Lee, K.-S. Yun, Interbasin coupling between the tropical Indian
578
and Pacific Ocean on interannual timescale: observation and CMIP5 reproduction. Clim
579
Dyn. 48, 459–475 (2017).
580
45. W. Zhang, Y. Wang, F.-F. Jin, M. F. Stuecker, A. G. Turner, Impact of different El Niño
581
types on the El Niño/IOD relationship. Geophys. Res. Lett. 42, 8570–8576 (2015).
582
46. T. Lee, M. J. McPhaden, Increasing intensity of El Niño in the central-equatorial Pacific.
583
Geophys. Res. Lett. 37, L14603 (2010).
584
47. Y.-G. Ham, J.-Y. Choi, J.-S. Kug, The weakening of the ENSO–Indian Ocean Dipole (IOD)
585
coupling strength in recent decades. Clim. Dyn. 49, 249–261 (2016).
586
48. Y. M. Okumura, C. Deser, Asymmetry in the duration of El Niño and La Niña. J. Clim. 23,
587
5826–5843 (2010).
588
49. H. Annamalai, J. Potemra, R. Murtugudde, J. P. McCreary, Effect of Preconditioning on
589
the Extreme Climate Events in the Tropical Indian Ocean*. J. Clim. 18, 3450–3469 (2005).
590
50. S.-K. Lee, W. Park, M. O. Baringer, A. L. Gordon, B. Huber, Y. Liu, Pacific origin of the
591
abrupt increase in Indian Ocean heat content during the warming hiatus. Nat. Geo. 8, 445–
592
449 (2015).
593
51. M. F. Jansen, D. Dommenget, N. Keenlyside, Tropical atmosphere–ocean interactions in a
594
conceptual framework. J. Clim. 22, 550-567 (2009).
595
52. C.Wang, F.Kucharski, R. Barimalala, A. Bracco, Teleconnections of the tropical Atlantic to
596
the tropical Indian and Pacific Oceans: A review of recent findings. Special Issue of
597
Meteorologische Zeitschrift 18, 445-454 (2009).
598
53. C. Frauen, D. Dommenget, Influences of the tropical Indian and Atlantic Oceans on the
599
21
54. J. M. Wallace, D. S. Gutzler, Teleconnections in the geopotential height field during the
601
northern hemisphere winter. Mon. Wea. Rev. 109, 784-812 (1981).
602
55. D. B. Enfield, D. A. Mayer, Tropical Atlantic sea surface temperature variability and its
603
relation to El Niño-Southern Oscillation. J. Geophys. Res. 102, 929-945 (1997).
604
56. M. A. Alexander, I. Blade, M. Newman, J. R. Lanzante, N.-C. Lau, J. D. Scott, The
605
Atmospheric Bridge: The influence of ENSO teleconnections on air-sea interaction over the
606
global oceans. J. Clim. 15, 2205-2231 (2002).
607
57. B. Huang, Remotely forced variability in the tropical Atlantic Ocean. Clim. Dyn. 23,
133-608
152 (2004).
609
58. C. Wang, "ENSO, Atlantic climate variability, and the Walker and Hadley circulations." in
610
The Hadley Circulation: Present, Past and Future, H. F. Diaz, R. S. Bradley, Eds. (vol. 21
611
of Advances in Global Change Research Series, Springer, Dordrecht, 2004), pp. 173-202.
612
59. J. Garcia-Serrano, C. Frankignoul, M. P. King, A. Arribas, Y. Gao, V. Guemas, D. Matei,
613
R. Msadek, W. Park, E. Sanchez-Gomez, Multi-model assessment of linkages between
614
eastern Arctic sea-ice variability and the Euro-Atlantic atmospheric circulation in current
615
climate. Clim. Dyn. 49, 2407-2429 (2017).
616
60. J. C. H. Chiang, A. H. Sobel, Tropical tropospheric temperature variations caused by ENSO
617
and their influence on the remote tropical climate. J. Clim. 15, 2616-2631 (2002).
618
61. J.-H. Yu, T. Li, Z. Tan, Z. Zhu, Effects of tropical North Atlantic SST on tropical cyclone
619
genesis in the western North Pacific. Clim. Dyn. 46, 865-877 (2016).
620
62. J.-Y. Yu, S. T. Kim, Relationships between extratropical sea level pressure variations and
621
the central Pacific and eastern Pacific types of ENSO. J. Clim. 24, 708–720 (2011).
622
63. S. E. Zebiak, Air-Sea interaction in the equatorial Atlantic region. J. Clim. 6, 1567-1586
623
(1993).
624
64. N. S. Keenlyside, M. Latif, Understanding equatorial Atlantic interannual variability. J.
625
Clim. 20, 131-142 (2007).
626
65. M. Latif, A. Grötzner, The equatorial Atlantic oscillation and its response to ENSO. Clim.
627
22
66. P. Chang, Y. Fang, R. Saravanan, L. Ji, H. Seidel, The cause of the fragile relationship
629
between the Pacific El Niño and the Atlantic Niño. Nature 443, 324-328 (2006).
630
67. J. F. Lübbecke, M. J. McPhaden, On the inconsistent relationship between Pacific and
631
Atlantic Niños. J. Clim. 25, 4294-4303 (2012).
632
68. Polo, B. Rodríguez-Fonseca, T. Losada, J. Garcia-Serrano, Tropical Atlantic variability
633
modes (1979-2002). Part I: Time-evolving SST modes related to West African rainfall. J.
634
Clim. 21, 6457-6475 (2008).
635
69. B. Rodríguez-Fonseca, I. Polo, J. García-Serrano, T. Losada, E. Mohino, C. R. Mechoso, F.
636
Kucharski, Are Atlantic Niños enhancing Pacific ENSO events in recent decades? Geophys.
637
Res. Lett. 36, L20705 (2009).
638
70. H. Ding, N. S. Keenlyside, M. Latif, Impact of the equatorial Atlantic on the El Niño
639
Southern Oscillation. Clim. Dyn. 38, 1965-1972 (2012).
640
71. Polo, M. Martín-Rey, B. Rodríguez-Fonseca, F. Kucharski, C. R. Mechoso, Processes in the
641
Pacific La Niña onset triggered by the Atlantic Niño. Clim. Dyn. 44, 115-131 (2015).
642
72. M. Martín-Rey, B. Rodríguez-Fonseca, I. Polo, F. Kucharski, On the Atlantic–Pacific Niños
643
connection: a multidecadal modulated mode. Clim. Dyn. 43, 3163-3178 (2014).
644
73. T. Losada, B. Rodriguez-Fonseca, Tropical atmospheric response to decadal changes in the
645
Atlantic equatorial mode. Clim. Dyn. 47, 1211-1224 (2016).
646
74. M. Martín-Rey, I. Polo, B. Rodríguez-Fonseca, T. Losada, A. Lazar, Is there evidence of
647
changes in tropical Atlantic variability modes under AMO phases in the observational
648
record? J. Clim. 31, 515-536 (2018).
649
75. B. Dong, R. T. Sutton, A. A. Scaife, Multidecadal modulation of El Niño-Southern
650
Oscillation (ENSO) variance by Atlantic Ocean sea surface temperatures. Geophys. Res.
651
Lett. 33, L08705 (2006).
652
76. F. Kucharski, A. Bracco, J. H. Yoo, F. Molteni, Low-frequency variability of the Indian
653
monsoon–ENSO relationship and the tropical Atlantic: The “weakening” of the 1980s and
654
1990s. J. Clim. 20, 4255-4266 (2007).
655
77. X. Rong, R. Zhang, T. Li, Impacts of Atlantic SST anomalies on the Indo-East Asian
656
23
78. A. Gershunov, N. Schneider, T. Barnett, Low-Frequency Modulation of the ENSO–Indian
658
Monsoon Rainfall Relationship: Signal or Noise?. J. Clim. 14, 2486–2492 (2001).
659
79. G. A. Meehl, J. M. Arblaster, J. T. Fasullo, A. Hu, K. E. Trenberth, Model-based evidence
660
of deep-ocean heat uptake during surface-temperature hiatus periods. Nat. Clim.
661
Change 1, 360-364 (2011).
662
80. N. Maher, M. H. England, A. S. Gupta, P. Spence, Role of Pacific trade winds in driving
663
ocean temperatures during the recent slowdown and projections under a wind trend
664
reversal. Clim. Dyn. 51, 321-336 (2018).
665
81. T. L. Delworth, F. Zeng, A. Rosati, G. A. Vecchi, A. T. Wittenberg, A link between the hiatus
666
in global warming and North American drought. J. Clim. 28, 3834-3845 (2015).
667
82. W. Han, G. A. Meehl, A. Hu, M. Alexander, T. Yamagata, D. Yuan, M. Ishii, P. Pegion, J.
668
Zheng, B. Hamlington, X.-W. Quan, and R. Leben, Intensification of decadal and
multi-669
decadal sea level variability in the western tropical Pacific during recent decades. Clim.
670
Dyn. 43, 1357-1379 (2014).
671
83. N. C. Johnson, S.-P. Xie, Changes in the sea surface temperature threshold for tropical
672
convection. Nat. Geo. 3, 842-845 (2010).
673
84. L. Dong, M. J. McPhaden, Why has the relationship between Indian and Pacific Ocean
674
decadal variability changed in recent decades? J. Clim. 30, 1971-1983 (2017).
675
85. R. Zhang, T. L. Delworth, Impact of the Atlantic multidecadal oscillation on North Pacific
676
climate variability. Geophys. Res. Lett. 34, L23708 (2007).
677
86. C. Sun, F. Kucharski, J. Li, F.-F. Jin, I.-S. Kang, R. Ding, Western tropical Pacific
678
multidecadal variability forced by the Atlantic multidecadal oscillation. Nat. Commun. 8,
679
15998 (2017).
680
87. Y. Ruprich-Robert, R. Msadek, F. Castruccio, S. Yeager, T. Delworth, G. Danabasoglu,
681
Assessing the climate impacts of the observed Atlantic multidecadal variability using the
682
GFDL CM2.1 and NCAR CESM1 global coupled models. J. Clim. 30, 2785-2810 (2017).
683
88. Y. Chikamoto, A. Timmermann, J.-J. Luo, T. Mochizuki, M. Kimoto, M. Watanabe, M. Ishii,
684
S.-P. Xie, F.-F. Jin. Skillful multi-year predictions of tropical trans-basin climate