Int. J. Electrochem. Sci., 14 (2019) 11391 – 11405, doi: 10.20964/2019.12.07
International Journal of
ELECTROCHEMICAL
SCIENCE
www.electrochemsci.org
Effects of Zn Doping Amount on the Electrochemical Properties
of LiNi
0.5Mn
1.5O
4Lithium-Ion Cathode Materials
Hongyan Sun 1,2, Xin Kong 1,2, Shaoping Feng 1,2, Guiyang Liu 1,2,*
1 Department of Chemistry, College of Science, Honghe University, Mengzi, 661199, Yunnan, China 2 Local Characteristic Resource Utilization and New Materials Key Laboratory of Universities in
Yunnan, Honghe University, Mengzi 661199, Yunnan, China.
*E-mail: [email protected]
Received: 27 June 2019 / Accepted: 2 September 2019 / Published: 29 October 2019
The effects of Zn doping for Mn site on the electrochemical properties of LiNi0.5Mn1.5-xZnxO4 (x=0,
0.01, 0.03, 0.05, 0.08, 0.10) have been systematically investigated. The LiNi0.5Mn1.5-xZnxO4 samples,
which were synthesized by a modified low temperature solution combustion synthesis method, were characterized by X-ray diffraction(XRD), infrared spectroscopy(FT-IR), scanning electron microscopy(SEM), galvanostatic charge-discharge testing, cyclic voltammetry(CV) and electrochemical impedance spectroscopy(EIS). All samples have perfect cubic spinel structures with a combination of ordered and disordered space groups. The microstructure is almost not affected by the amount of Zn doping obtained from the SEM results. The electrochemical performances are obviously improved by Zn doping, which are shown from cycle stability, rate capability and high temperature cycling performance. The cycle performance is promoted with the increasing of Zn doping content both at 25 oC and at elevated temperature of 55 oC. The first charge-discharge efficiency and rate
capability first increase and then decrease with the increase of Zn doping content, which is best when the Zn doping content is 0.05. Meanwhile, the impedance of products significantly decreases after Zn doping.
Keywords: Electrochemical performance, LiNi0.5Mn1.5O4, lithium-ion batteries, Mn site, Zn doping
1. INTRODUCTION
voltage, high rate capability, etc.[3-5], making it a promising LIBs’ positive material in practical use. However, numerous works report that the LNMO usually shows obvious capacity degradation at high temperature(≈55 oC)[6]. So researchers have made a lot of efforts to overcome this problem, such as by
modifying synthetic route, by controlling special morphologies, by surface coating, and so on. According to related reports, the performance of LNMO cathode materials can be effectively improved by doping cations or anions. The doping elements mainly including Na[6], Zn, Cu[7], Mg[8], Fe[9], Al[8], Cr[9], Zr[10], V[11], W[12], F[13] and S[14], etc., which can indeed enhance the electrochemical performance of the LNMO materials.
Zn-doping can indeed increase the cyclic stability of the LNMO which first reported by Manthiram et al.[15]. A series of LiZnxNi0.5-xMn1.5O4((x=0, 0.02, 0.04, 0.08, 0.25 and 0.5) spinel
materials were successfully synthesized using the sol-gel method by Yang et al. [16]. The results showed that the LiZn0.08Ni0.42Mn1.5O4 delivered improved cycle-life and C-rate performance both at
home temperature and at elevated temperature, attributing to forming a thick interphase film between the positive electrode and the electrolyte. Encouraged by these results, our group have successfully synthesized the LiNi0.5Mn1.45Zn0.05O4 with a novel solution combustion synthesis method[17]. The
result showed that it indeed could improve the cyclic stability and the rate capability significantly. Here what needs to be emphasized is that the substitution of Zn is not on Ni site but on Mn site in our study. For further systematically study the effects of Zn doping amount on the electrochemical properties of LNMO, LiNi0.5Mn1.5-xZnxO4 (x=0, 0.01, 0.03, 0.05, 0.08, 0.10) spinel samples were prepared in the
paper.
2. EXPERIMENTAL
2.1 Synthesis
The modified low temperature solution combustion synthesis method were used to synthesize the LiNi0.5Mn1.5-xZnxO4 (x=0, 0.01, 0.03, 0.05, 0.08, 0.10) spinel samples. The lithium nitrate, lithium
acetate, nickel nitrate, nickel acetate, manganese nitrate, manganese acetate and zinc acetate were working as raw materials and the molar ratio of nitrate and acetate for all metals was 1:1. The synthesis process of materials was described in detail in our other studies[7, 17].
2.2 Characterization
The Powder X-ray diffraction (XRD, PANalytical X’pert pro, Cu-Ká radiation) and the Fourier transformed infrared spectroscopy(FTIR, PerkinElmer, with KBr pellets) were employed to characterize the phase structure and crystal structure of the samples. The field emission scanning electron microscopy(SEM, FEI Quanta FEG 250) was used to observe the morphologies of products.
The electrochemical properties of each sample were measured using a CR2025-type coin cell, which composed of cathode, lithium anode, Celgard polyethylene separator, and LiPF6 in 1:1 ethylene
electrodes and coin cells were described in our previous research[17]. The cells were galvanostatically cycled on a muti-channel battery cycler(LANHE CT2001A instrument, Wuhan, China) in the voltage window for 3.5 to 5.0V. The cells were also cycled at 55 oC by putting them in an oven. Cyclic voltammogram(CV) of the cells was measured on a CHI 660 electrochemical workstation from 3.5-5.0V at different scan rates from 0.1 to 0.5mV/s. Electrochemical impedance spectroscopy (EIS) is collected at charging state of fully lithiation with an ac amplitude voltage of 5mV in the frequency range of 100 kHz to 0.1 Hz, using the CHI 660 electrochemical workstation.
3. RESULTS AND DISCUSSION
3.1 Structure
10 20 30 40 50 60 70
LiNi0.5Mn1.5O4
x=0.00 x=0.01 x=0.03 x=0.05 x=0.08
Inten
si
ty
(a.u
.)
2Theta (degree)
(a)
x=0.10
0.00 0.02 0.04 0.06 0.08 0.10
8.175 8.180 8.185 8.190 8.195 8.200
(b)
La
tt
ice
para
meter( A
)
Zn content
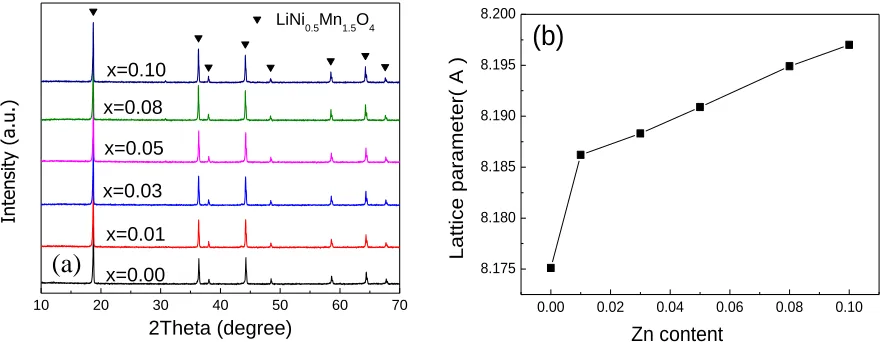
Figure 1. (a) XRD patterns and (b) lattice parameters of LiNi0.5Mn1.5-xZnxO4 (x=0, 0.01, 0.03, 0.05,
0.08, 0.10)
The X-ray diffraction patterns of the spinel powders are shown in Fig. 1(a). All of the diffraction peaks are assigned to the spinel compound LiNi0.5Mn1.5O4 and no impurity peak is found in
the products. The lattice parameter obviously increases after Zn doping, which is shown in Fig. 1(b). To our knowledge, the ionic radius of Zn is 0.074nm, which is larger than those of Mn3+(0.058nm) and
[image:3.596.77.520.291.462.2]
650 600 550 500 450
558 581
Wavenumber(cm-1) 621
[image:4.596.171.429.78.284.2]Zn=0.10 Zn=0.08 Zn=0.05 Zn=0.03 Zn=0.01 Zn=0.00
Figure 2. FT-IR spectra of LiNi0.5Mn1.5-xZnxO4 (x=0, 0.01, 0.03, 0.05, 0.08, 0.10)
FT-IR spectroscopy has been proved to be an effective technique in identification of the P4332
and Fd-3m spinel of the LNMO[19]. As shown in Fig. 2, the obvious bands at 558cm-1, which is the
characteristic peak reported by Wang[20], show the existence of ordered phase in the products. Meanwhile, all samples show lower band intensity at 581cm-1 than that at 621cm-1, suggesting that the
products have disorder space group Fd-3m[21]. Therefore, the conclusion can be drawn that all the samples contain two phases of ordered and disordered. In fact, Patoux et al. have also reported the same phenomenon in their study[22]. According to Kim and Zheng[23, 24], the LNMO with some disordered crystallographic structure usually has higher electronic conductivity, because of the existence of some Mn3+.
3.2 Morphology
Figure 3. SEM images of LiNi0.5Mn1.5-xZnxO4:(a) x=0.00, (b) x=0.01, (c) x=0.03,(d) x=0.05, (e)
x=0.08 and (f) x=0.10
Fig. 3 shows the SEM images of the products. The micro morphologies of all samples are similar. It is obvious that the microstructure of samples is not affected by Zn doping. In the meantime, Fig. 3 illustrates that the products exhibit perfect octahedral spinel structure with homogeneous particles.
3.3 Electrochemical performance
0 40 80 120 160
3.5 4.0 4.5 5.0
25oC, 3.5-5.0V
vs. Li+/Li
Disharge
Vol
tage
(V)
Specific Capacity (mAh/g)
Charge
At 0.2C
(a) x=0.00
Initial Coulombic Efficiency = 83.0%
0 40 80 120 160
3.5 4.0 4.5 5.0
25oC, 3.5-5.0V
vs. Li+/Li
Disharge
Vol
tage
(V)
Specific Capacity (mAh/g)
Charge
At 0.2C
(b) x=0.01
[image:5.596.97.502.67.416.2] [image:5.596.70.531.599.757.2]
0 40 80 120 160
3.5 4.0 4.5 5.0
25oC, 3.5-5.0V
vs. Li+/Li
Disharge
Vol
tage
(V)
Specific Capacity (mAh/g)
Charge
At 0.2C
(c) x=0.03
Initial Coulombic Efficiency = 90.7%
0 40 80 120 160
3.5 4.0 4.5 5.0
25oC, 3.5-5.0V
vs. Li+/Li
Disharge
Vol
tage
(V)
Specific Capacity (mAh/g)
Charge
At 0.2C
(d) x=0.05
Initial Coulombic Efficiency = 88.6%
0 20 40 60 80 100 120 140
3.5 4.0 4.5 5.0
25oC, 3.5-5.0V
vs. Li+/Li
Disharge
Vol
tage
(V)
Specific Capacity (mAh/g)
Charge
At 0.2C
(e) x=0.08
Initial Coulombic Efficiency = 88.2%
0 20 40 60 80 100 120 140
3.5 4.0 4.5 5.0
25oC, 3.5-5.0V
vs. Li+/Li
Disharge
Vol
tage
(V)
Specific Capacity (mAh/g)
Charge
At 0.2C
(f) x=0.10
[image:6.596.68.533.73.392.2]Initial Coulombic Efficiency = 88.0%
Figure 4. Initial charge/discharge curves of LiNi0.5Mn1.5-xZnxO4: (a) x=0.00, (b) x=0.01, (c) x=0.03, (d)
x=0.05, (e) x=0.08 and (f) x=0.10 between the 3.5 and 5V regions(vs. Li+/Li) at 0.2C rate at 25oC
Fig. 4 gives the initial consecutive charge and discharge profiles for the LiNi0.5Mn1.5-xZnxO4
(x=0, 0.01, 0.03, 0.05, 0.08, 0.10) samples. All charge and discharge curves exhibit two potential plateaus at around 4.7V and 4.0V, which corresponding to the reduction/oxidation peaks of Ni2+/Ni4+
and Mn3+/ Mn4+ redox, respectively. This conclusion is in consistent with the FT-IR results above. Their initial discharge specific capacities are 140, 141.4, 140.7, 140.9, 128 and 122.5mAh/g, respectively. Obviously, the initial discharge capacity is higher than LiNi0.5Mn1.5-xCuxO4(x=0, 0.03,
0.05, 0.10, 0.15) samples in our other research [7]. As shown in Fig. 4, the specific capacities decrease gradually with the increasing of Zn doping amount, especially when the Zn doping amount is more than 0.05. The initial coulombic efficiency of LiNi0.5Mn1.5-xZnxO4 (x=0, 0.01, 0.03, 0.05, 0.08, 0.10)
0 50 100 150 200
80 90 100 110 120 130 140 LiNi
0.5Mn1.5-xZnxO4
x=0.00(77.9%) x=0.01 (94.7%) x=0.03(97.2%) x=0.05 (97.3%) x=0.08(98.0%) x=0.10 (99.8%)
Cycle Number Spe cific Ca pa city (mAh/g)
1C, 25oC vs. Li+/Li, 3.5-5.0V
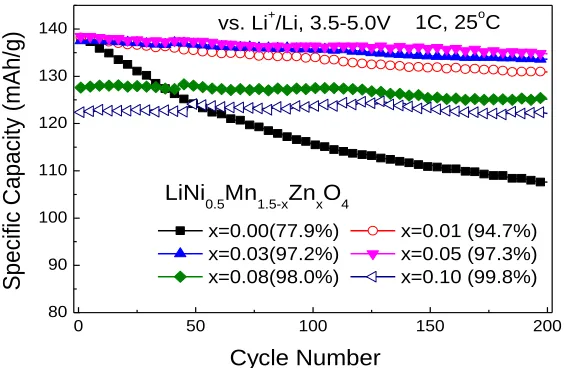
Figure 5. Cycling performance of LiNi0.5Mn1.5-xZnxO4 (x=0, 0.01, 0.03, 0.05, 0.08, 0.10) in the
potential range of 3.5-5V(vs. Li+/Li)at 1C rate at 25oC
The cycling performance profiles of the products at 1C rate and 25oC are given in Fig. 5. It is
observed that Zn-doping can significantly improve the cycling performances of the LNMO spinel. The cycling performances are gradually promoted with the increasing of Zn doping amount. The capacity has almost no attenuation after 200 cycles when the Zn doping content is 0.10. The cycle stability of the products of LiNi0.5Mn1.5-xZnxO4 (x=0, 0.01, 0.03, 0.05, 0.08, 0.10) are better, comparing with the
LiZnxNi0.5-xMn1.5O4 (x=0, 0.02, 0.04, 0.08, 0.25, 0.5) materials prepared by Yang et al.[16]. The results
reveal that doped zinc on Mn site in LNMO is more favorable for the reversible intercalation and deintercalation of Li+ than that of on Ni site.
0 20 40 60 80 100 120 140
3.6 3.8 4.0 4.2 4.4 4.6
4.8 vs. Li+/Li, 3.5-5.0V, 25oC
Vol
tage
(V)
Specific Capacity (mAh/g) 0.00-1st
0.00-200th
(a)
0 20 40 60 80 100 120 140
3.6 3.8 4.0 4.2 4.4 4.6
4.8 vs. Li+/Li, 3.5-5.0V, 25oC
Vol
tage
(V)
Specific Capacity (mAh/g) 0.01-1st
0.01-200th
(b)
0 20 40 60 80 100 120 140
3.6 3.8 4.0 4.2 4.4 4.6
4.8 vs. Li+
/Li, 3.5-5.0V, 25o
C
Vol
tage
(V)
Specific Capacity (mAh/g) 0.03-1st
0.03-200th
(c)
0 20 40 60 80 100 120 140
3.6 3.8 4.0 4.2 4.4 4.6
4.8 vs. Li+
/Li, 3.5-5.0V, 25o
C
Vol
tage
(V)
Specific Capacity (mAh/g) 0.05-1st
0.05-200th
(d)
[image:7.596.162.445.76.260.2]
0 20 40 60 80 100 120
3.6 3.8 4.0 4.2 4.4 4.6
4.8 vs. Li+/Li, 3.5-5.0V, 25oC
Vol
tage
(V)
Specific Capacity (mAh/g) 0.08-1st
0.08-200th
(e)
0 20 40 60 80 100 120
3.6 3.8 4.0 4.2 4.4 4.6
4.8 vs. Li+/Li, 3.5-5.0V, 25oC
Vol
tage
(V)
Specific Capacity (mAh/g) 0.10-1st
0.10-200th
[image:8.596.104.499.71.207.2](f)
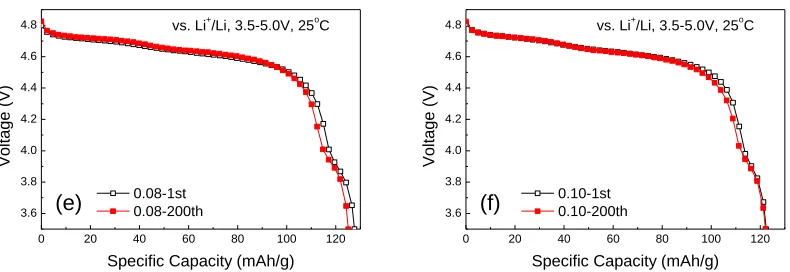
Figure 6. The discharge curves of the first and the 200th cycles at 1C and 25oC of LiNi
0.5Mn1.5-xZnxO4
(a) x=0.00, (b) x=0.01, (c) x=0.03, (d) x=0.05, (e) x=0.08 and (f) x=0.10
In Fig. 6, the discharge curves of the first and the 200th cycles at 1C and 25oC of the products (a) Zn=0.00, (b) Zn=0.01, (c) Zn=0.03, (d) Zn=0.05, (e) Zn=0.08 and (f) Zn=0.10 are shown. From Fig. 6, it can be seen that the stability of voltage platform increases with the increase of Zn doping content under cyclic loading. There was almost no change in the voltage platform after 200 cycles when the Zn doping amount is more than 0.03, indicating that the products have good cyclic stability.
0 5 10 15 20 25 30
80 100 120 140
LiNi0.5Mn1.5-xZnxO4
Spe
cific Ca
pa
city (mAh/g)
Cycle Number
x=0.00 x=0.01
x=0.03 x=0.05
x=0.08 x=0.10
0.5C 1C 2C 5C 10C 1C
25oC, 3.5-5.0V
vs. Li+/Li
0.5C 1C 2C 5C 10C
70 80 90 100
LiNi0.5Mn1.5-xZnxO4
x=0.00 x=0.01
x=0.03 x=0.05
x=0.08 x=0.10
(b)
Current Density (C)
Ca
pa
city retentio
[image:8.596.74.523.378.534.2]n (%)
Figure 7. Rate capabilities and capacity retentions of LiNi0.5Mn1.5-xZnxO4 (x=0, 0.01, 0.03, 0.05, 0.08,
0.10) at different rates ranged from 0.5 to 10C at 25oC
Fig. 7 depicts the rate capabilities and capacity retentions of the products at different rates. As shown in Fig. 7, after Zn doping, the rate capability of all products gets a significant enhancement. And the best rate capability is obtained when the Zn doping content is 0.03 and 0.05. Meanwhile, the specific capacity of LiNi0.5Mn1.45Zn0.05O4 is still high to 126mAh/g at high rate of 10C, which is higher
0 20 40 60 80 100 120 140 3.6
4.0 4.4 4.8
(a) x=0.00
Specific Capacity (mAh/g)
Vol
tage
(V)
10C 5C 2C1C 0.5C
vs. Li+/Li 25oC, 3.5-5.0V
0 30 60 90 120
3.6 4.0 4.4 4.8
(b) x=0.01
Specific Capacity (mAh/g)
Vol
tage
(V)
10C 5C 2C 1C 0.5C
vs. Li+/Li 25oC, 3.5-5.0V
0 20 40 60 80 100 120 140 3.6
4.0 4.4 4.8
(c) x=0.03
Specific Capacity (mAh/g)
Vol
tage
(V)
10C 5C 2C1C 0.5C
vs. Li+/Li 25oC, 3.5-5.0V
0 20 40 60 80 100 120 140 3.6
4.0 4.4 4.8
(d) x=0.05
Specific Capacity (mAh/g)
Vol
tage
(V)
25oC, 3.5-5.0V
vs. Li+/Li
10C 5C 2C1C 0.5C
0 20 40 60 80 100 120 140 3.6
4.0 4.4 4.8
(e) x=0.08
Specific Capacity (mAh/g)
Vol
tage
(V)
10C 5C 2C1C 0.5C
vs. Li+/Li 25oC, 3.5-5.0V
0 20 40 60 80 100 120 3.6
4.0 4.4 4.8
(f) x=0.10
Specific Capacity (mAh/g)
Vol
tage
(V)
10C 5C 2C1C 0.5C
[image:9.596.91.502.74.569.2]vs. Li+/Li 25oC, 3.5-5.0V
Figure 8. The discharge curves at different C-rates of LiNi0.5Mn1.5-xZnxO4 (x=0, 0.01, 0.03, 0.05, 0.08,
0.10) at 25oC in the potential range of 3.5-5V(vs. Li+/Li)
The discharge voltage profiles of the LiNi0.5Mn1.5-xZnxO4 (x=0, 0.01, 0.03, 0.05, 0.08, 0.10)
0 40 80 120 160 200
40 60 80 100 120 140
LiNi0.5Mn1.5-xZnxO4
x=0.00 76.1% x=0.01 94.5% x=0.03 96.3% x=0.05 94.1% x=0.08 95.6% x=0.10 95.1%
Spe
cific Ca
pa
city
(mAh/g)
Cycle Number
vs. Li+/Li, 3.5-5.0V, 25oC,10C
Figure 9. The cycling performance of LiNi0.5Mn1.5-xZnxO4 (x=0, 0.01, 0.03, 0.05, 0.08, 0.10) at 10 C
rate and 25oC in the potential range of 3.5-5V(vs. Li+/Li)
The cycling performance of the products at a high rate of 10 C and 25oC is shown in Fig. 9. The
capacity retentions of LiNi0.5Mn1.5-xZnxO4 (x=0, 0.01, 0.03, 0.05, 0.08, 0.10) samples are 76.1%,
94.5%, 96.3%, 94.1%, 95.6% and 95.1% after 200 cycles, respectively. Clearly, the cycling stability of the products at a high rate of 10C is significantly improved after Zn doping.
0 40 80 120 160 200
40 60 80 100 120 140
LiNi
0.5Mn1.5-xZnxO4
x=0.00 61.6% x=0.01 85.6% x=0.03 87.4% x=0.05 85.7% x=0.08 92.2% x=0.10 93.9%
Cycle Number
Spe
cific Ca
pa
city (mAh/g)
vs. Li+/Li, 3.5-5.0V At 1C, 55oC
Figure 10. The cycling performances of LiNi0.5Mn1.5-xZnxO4 (x=0, 0.01, 0.03, 0.05, 0.08, 0.10) at 1C
rate and 55 oC in the potential range of 3.5-5V(vs. Li+/Li)
[image:10.596.160.447.78.290.2] [image:10.596.158.454.453.664.2]
LiNi0.5Mn1.5-xZnxO4 (x=0, 0.01, 0.03, 0.05, 0.08, 0.10) samples after 200 cycles. Obviously, the cyclic
stability of samples at elevated temperature is greatly improved after Zn doping. The capacity retention rate of LiNi0.5Mn1.40Zn0.10O4 is still 93.9% after 200 cycles at 55oC, which is better than some Refs [26,
27]. It is likely may be that Zn-doping on Mn site can make the samples have more stable structure.
3.8 4.0 4.2 4.4 4.6 4.8 5.0 1.5 1.0 0.5 0.0 -0.5 -1.0 -1.5
(a) LiNi0.5Mn1.5O4
0.1 mV/s 0.2 mV/s 0.3 mV/s 0.4 mV/s 0.5 mV/s Potential (V) Cu rren t (mA)
3.8 4.0 4.2 4.4 4.6 4.8 5.0 -1.5 -1.0 -0.5 0.0 0.5 1.0 1.5 (b) x=0.01 0.1 mV/s 0.2 mV/s 0.3 mV/s 0.4 mV/s 0.5 mV/s Potential (V) Cu rren t (mA)
3.8 4.0 4.2 4.4 4.6 4.8 5.0 -1.5 -1.0 -0.5 0.0 0.5 1.0 1.5 (c) x=0.03 0.1 mV/s 0.2 mV/s 0.3 mV/s 0.4 mV/s 0.5 mV/s Potential (V) Cu rren t (mA)
3.8 4.0 4.2 4.4 4.6 4.8 5.0 1.5 1.0 0.5 0.0 -0.5 -1.0 -1.5 Cu rren t (mA) Potential (V) 0.1 mV/s 0.2 mV/s 0.3 mV/s 0.4 mV/s 0.5 mV/s (d) x=0.05
3.8 4.0 4.2 4.4 4.6 4.8 5.0 -1.0 -0.5 0.0 0.5 1.0 (e) x=0.08 0.1 mV/s 0.2 mV/s 0.3 mV/s 0.4 mV/s 0.5 mV/s Potential (V) Cu rren t (mA)
3.8 4.0 4.2 4.4 4.6 4.8 5.0 -0.8 -0.6 -0.4 -0.2 0.0 0.2 0.4 0.6 0.8 (f) x=0.10 0.1 mV/s 0.2 mV/s 0.3 mV/s 0.4 mV/s 0.5 mV/s Potential (V) Cu rren t (mA)
Figure 11. The CV curves of LiNi0.5Mn1.5-xZnxO4 (x=0, 0.01, 0.03, 0.05, 0.08, 0.10) at different
scanning rates ranged from 0.1 to 0.5mV/s at 25 oC in the potential range of 3.5-5V(vs. Li+/Li)
[image:11.596.98.498.154.648.2]
around 4.7V responds to Ni2+/4+ redox couple no splitting two separate peaks, which is generally accepted in P4332 ordered space group, while the minor peak at around 4.0V corresponds to Mn4+/3+
redox couple due to the oxygen deficiencies in the disordered spinel. The results indicate that the products have a mixture structure of ordered and disordered, consistent with the FT-IR analysis.
In order to study the diffusion kinetics and the diffusion coefficients of Li+, the linear
relationship between the peak current (ip) and the square root of the scan rates (v1/2) of LiNi0.5Mn 1.5-xZnxO4 (x=0, 0.01, 0.03, 0.05, 0.08, 0.10) samples is plotted in Fig. 12 with the formula as follows[28]:
2 / 1 2 / 1 2
/ 3 5 10 69 .
2 n AC D v
ip = Li Li
Here, n=1, A=2cm2, C
Li= 0.02378 mol/cm3.
0.009 0.012 0.015 0.018 0.021 0.024 -0.2
-0.4 -0.6 -0.8 -1.0 -1.2 -1.4 -1.6 -1.8
Cu
rren
t
(mA)
Square root of the scan rate (V/s)1/2 0.00
0.01 0.03 0.05 0.08 0.10
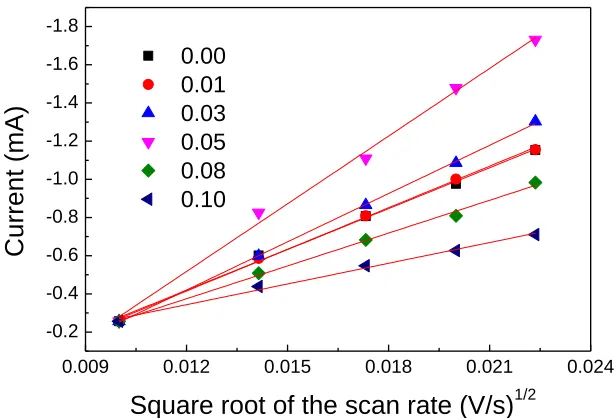
Figure 12. The ip vs. the square root of the scan rates (v1/2) of LiNi0.5Mn1.5-xZnxO4 (x=0, 0.01, 0.03,
0.05, 0.08, 0.10)
As shown in Fig. 12, the slope of the LiNi0.5Mn1.5-xZnxO4 (x=0, 0.01, 0.03, 0.05, 0.08, 0.10)
samples are -71.32,-72.68, -84.26, -118.21, -57.3 and -36.1, respectively. Meanwhile, the chemical diffusion coefficient of Li+(DLi) of the as-prepared samples are calculated as shown in Table 1.
Obviously, the slope first increases and then decreases with the increasing of Zn doping amount. The slope reaches the maximum value when the Zn doping amount is 0.05, and at this time the Li ion conductivity is 8.52E-11. Maybe it is because that the Li-ion diffusion path will be blocked by the excess doped Zn ions and resulting in the decreasing of DLi, which was also reported in our other study
[image:12.596.147.455.264.473.2]
Table 1. The DLi of prepared LiNi0.5Mn1.5-xZnxO4(x=0, 0.01, 0.03, 0.05, 0.08, 0.10)
LiNi0.5Mn1.5-xZnxO4 DLi/(cm2﹒s-1)
x=0.00 3.10E-11
x=0.01 3.22E-11
x=0.03 4.33E-11
x=0.05 8.52E-11
x=0.08 2.00E-11
x=0.10 7.95E-12
0 100 200 300 400 500 600 0
100 200 300 400 500 600
0 40 80 120
0 40 80 120
0.00 0.01
0.03 0.05
0.08 0.10
Z' (ohm)
Z'
'
(oh
m)
(a)
(b)
Figure 13. The electrochemical impedance spectral(EIS) and a possible equivalent circuit of LiNi0.5Mn1.5-xZnxO4 (x=0, 0.01, 0.03, 0.05, 0.08, 0.10) in the frequency range from 0.1Hz to
100kHz.
To further understand the reasons for the excellent electrochemical properties of LNMO-Zn samples, the electrochemical impedance spectroscopy (EIS) studies are carried out in the frequency range from 0.1Hz to 100kHz. All the samples are cycled 3 cycles and then charged to 5.0V. The EIS spectra are shown in Fig. 13(a). And the possible equivalent circuit for the samples is also proposed in Fig. 13(b). All the EIS spectra have similar profiles which are consist of a semi-circle at high-to-middle frequency region is assigned to the charge transfer resistance (Rct+ Rf) and an inclined line in
the low frequency region is resulted from the lithium ion diffusion resistance in the spinel(W). And the Rs is attributing to the ohimic resistance of the electrolyte. As shown, the Rct and Rf values of
4. CONCLUSIONS
In summary, the Zn-doped LiNi0.5Mn1.5-xZnxO4 (x=0, 0.01, 0.03, 0.05, 0.08, 0.10) are
synthesized via the modified low temperature solution combustion synthesis method. The obtained powders have a combination structure of ordered and disordered space group and exhibit perfect cubic spinel structures. The microstructure of samples will not affected by Zn doping. The cyclic stability of Zn-doping samples at 55oC and room temperature have significantly enhanced at 1C rate comparing with the LNMO spinel. The capacity has almost no attenuation after 200 cycles when the Zn doping amount is 0.10 at room temperature. Even at 55℃, the capacity retention of LiNi0.5Mn1.40Zn0.10O4 is
high to 93.9% after 200 cycles. Meanwhile, the Zn-doping samples show better rate capability and improved cyclic performance at high rate of 10C at room temperature. The LiNi0.5Mn1.47Zn0.03O4
sample can keep a capacity retention of 96.3% at 10C after 200 cycles. ACKNOWLEDGEMENT
The authors thank the financial supports from the National Natural Science Foundation of China(No. 51362012, No. 51662007 and U1602273), the Yunnan Local Colleges (part) Applied Basic Projects Joint Special Foundation (2017FH001-120) and the Yunnan Applied Basic Research Project (No.2017FD157).
References
1. S. Patoux, L. Sannier, H, Lignier, Y. Reynier, C. Bourbon, S. Jouanneau, F.L. Cras and S. Martinet, Electrochim. Acta, 53 (2008) 4137.
2. T.F. Yi, J. Mei and Y.R. Zhu, J. Power Sources, 316 (2016) 85.
3. G.Q. Liu, J.Y. Zhang, X.H. Zhang, Y.L. Du, K. Zhang, G.C. Li, H. Yu, C.W. Li, Z.Y. Li, Q. Sun and L. Wen, J. Alloys Compd., 725 (2017) 580.
4. W. Wu, J.L. Guo, X. Qin, C.B Bi, J.F Wang, L. Wang and G.C. Liang, J. Alloys Compd., 721 (2017) 721.
5. Y. Luo, H.Y. Li, T.L. Lu, Y.X. Zhang, S.S. Mao, Z. Liu, W. Wen, J.Y. Xie and L.Q. Yan, Electrochim. Acta, 238 (2017) 237.
6. J. Wang, W.Q. Lin, B.H Wu and J.B Zhao, Electrochim. Acta, 145 (2014) 245. 7. H.Y. Sun, X. Kong, B.S. Wang, T.B. Luo and G.Y. Liu, Ceram. Int., 44 (2018) 4603.
8. G.Y. Liu, H.Y. Sun, X. Kong, Y.N. Li and B.S. Wang, Int. J. Electrochem. Sci., 10 (2015) 6651. 9. D.W. Shin, C.A. Bridges, A. Huq, M.P. Paranthaman and A. Manthiram, Chem. Mater., 24 (2012)
3720.
10.S.P. Feng, X. Kong, H.Y. Sun, B.S. Wang, T.B. Luo and G.Y. Liu, J. Alloys Compd., 749 (2018) 1009.
11.M.C. Kim,K.W. Nam,E. Hu, X.Q. Yang, H.Kim, K. Kang, V. Aravindan, W.S. Kim and Y.S. Lee, ChemSusChem 7 (2014) 829.
12.S.J. R. Prabakar, S.C.Han, S.P. Singh, D.K.Lee, K.S.Sohn and M. Pyo, J. Power Sources, 209 (2012) 57.
13.Y.H. Xu, S.X. Zhao,Y.F. Deng, H. Deng and C.W. Nan, J. Materiomics, 2 (2016) 265. 14.14.Y.K. Sun, S.W. Oh, C.S. Yoon, H.J. Bang and J. Prakash, J. Power Sources, 161 (2006) 19. 15.T.A. Arunkumar and A. Manthiram, Electrochem. Solid-State Lett., 8 (2005) A403.
Technology, (2003) New York, the United States.
19.G.B. Zhong, Y.Y. Wang, X.J. Zhao, Q.S. Wang, Y. Yu and C.H. Chen, J. Power Sources, 216 (2012) 368.
20.L.P Wang, H. Li, X.J. Huang and E. Baudrin, Solid State Ionics, 193 (2011) 32. 21.J. Liu and A. Manthiram, J. Phys. Chem. C, 113 (2009) 15073.
22.S. Patoux, L. Daniel, C. Bourbon, H. Lignier, C. Pagano, F.C. Le, S. Jouanneau and S. Martinet, J. Power Sources, 189 (2009) 344.
23.J.H. Kim, S.T. Myung, C.S. Yoon, S.G. Kang and Y.K. Sun, Chem. Mater., 16 (2004) 906.
24.J.M. Zheng, J. Xiao, X.Q. Yu, L. Kovarik, M. Gu, F. Omenya, X.L. Chen, X.Q. Yang, J. Liu, G.L. Graff, M.S. Whittingham and J.G. Zhang, Phys. Chem. Chem. Phys., 14 (2012) 13515.
25.J. Guo, Y.J. Li, Y.X. Chen, S.Y. Deng, J. Zhu, S.L. Wang, J.P. Zhang, S.H. Chang, D.W. Zhang, X.M. Xi, J. Alloy. Compd., in press. https://doi.org/10.1016/j.jallcom.2019.152031.
26.Q. Chang, A.J. Wei, W. Li, X. Bai, L.H. Zhang, R. He and Z.F. Liu, Ceram. Int., 45 (2019) 5100. 27.Q. Wu, K. Xue, X.H. Zhang, X.S. Xie, H.Q. Wang, J.J. Zhang and Q.Y. Li, Ceram. Int., 45 (2019)
5072.
28.X.H. Rui, N. Ding, J. Liu, C. Li and C.H. Chen, Electrochim. Acta, 55 (2010) 2384.