~::~;-,,~r, ~:-,,• '-•) ~ 0 .~.-~ ' : - -~-:r'7~~~:::~·~\~~;.·"'"!~,:·.:·~~
•
~.~-~.;.;~·;~.. ,
r,
STATI$TISCHES AMT
OFFICE ST ATISTIQUE
·," · . Del EUR.OPXISCHEN G&MEINS(!HAPTEN
DES COMMUNAUT~ EUR.oHINNIS. MAt
1959
'
~-«
·'-~1
..:';·~,,·.,. ;~:~-~~.~
-.STATISTISCHE SCHNELLMELDUNGEN
NOTES STATISTIQUES RAPIDES
N25
· t l · '
,~
,: ' ' ' ~.~L
MAl 1959
:.
.
'' . ' .
.
'
•
. '• '''
_,'
)Die vom Statistischen Amt der Europciischen Gemeinschaf-ten herausgegebenen "Statistischen Schnellmeldungen11 sollen
mo-natlich die neuesten Zahlen zur kurzfristigen wirtschaftlichen Entwicklung in den sechs La.ndern der Europaischen Wirtschafts-gemeinschaft liefern.
Die Daten stammen zum grOssten Teil von den Statlstischen Aemtern der MitgliedsHinder; sie sind so weit wie mOghch mitein-ander in Einklang gebracht. Alle lndex-Ziffern wurden einheitlich auf die Basis 1953 = 100 umgerechnet. Die Form der statistischen Tabellen soll den Vergleich der Ziffern von Jahr zu Jahr erleich-tern.
Es sei besonders darauf h1ngewiesen, dass die meisten An-gaben der letzten Monate nur vorlciufige Werte darstellen und des-halb vielfach Aenderungen 1n spateren A us gab en unterworfen sind.
STATISTISCHES AMT DER EUROPAEISCHEN GEMEINSCHAFTEN Luxemburg und Brussel
Anschriften
Europ~ische Wirtschaftsgemeinschaft Brussel, Rue du Marais 56 - Tel. 188100
Europ~ische Gemeinschaft fur Atomenergie Brussel, Rue Belliard 51 - Tel. 134090
Europ~ische Gemeinschaft fur Koble und Stahl Luxemburg, Hotel Star - Tel. 40841
Zuschriften betreffend diese Statistische Schnellmeldung erbeten an :
Statistisches Amt
der Europ~ischen Gemeinschaften Direktion Allgemeine Statistik Rue du Marais 56
Brussel
Les "Notes Statlstiques Rapides11 publiees par l10ff1ce Sta-tistique des Communautes Europeennes, ant pour but de fournir mcnsuellement les chlffres les plus recents concernant 11 evolu-tion econom1que
a
court terme dans les Six Pays de la Communau-te Economique "Europt?enne.Les donnees sent commun1quees pour la plupart par les Ins-htuts de Statistique des pays-membres; elles ont t?te harmonisees dans la mes.ure du pos s1ble. Pour des ra1sons d1homogeneite,
taus les 1ndices ont ete recalcules sur la base 1953 = 100. Les tableaux statistlques sent _tJresentes de man1ere
a
faciliter la com-paraison des chiffres d1une anneea
l1autre.L'attention du lecteur est attiree sur le fait que les donnees des derniers mois sont en grande majorite! proviso1res et done susceptibles de modlficahons dans les editions ulterieures.
OFFICE STATISTIQUE DES COMMUNAUTES EUROPEENNES Luxembourg et Bruxelles
A dresses
Communaute Economique Europeenne
Bruxelles, 56, rue du Marais - tel. 188100 Communaute Europeenne de 11Energie Atomique
Bruxelles, 51, rue Belliard - tel. 134090 Communaute Europeenne du Charbon et de 11Acier
Luxembourg, Hotel Star - tel. 40841
Adresser la correspondance relative
a
cette publication "Notes Statistiques Rapides" : Office Statistique desCommunautes Europeennes
Direction de la Statistique Generale 56, rue du Marais
I
TABELLENVERZEICHNIS
I Industrielle Produktion
1. Gesamtindex der industriellen Produktlon 2. Produktionsindex der metallverarbeitenden
Industr1e
3. Produktionstndex der chemtschen Industrie 4. Produktionstndex der Texhlindustrte
5. Steinkohlenfarderung
6. Rohstahlerzeugung
7. Stronnerzeugung
II Binnenhandel und Verkehr
8. Index der Einzelhandelsumstitze 9. Eisenbahngaterverkehr
III Beschl!ftigung und Arbeitslosigkeit
10. Index der besch~ftigten Arbeiter tn der Industrte 11. Index der geleisteten Arbeiterstunden tn der Industrie 12. Index der Arbeitslosenzahl
IV Preise und L6hne
13. Index der Verbraucherprei s e 14. Index der Grosshandelspreise
15. Index der Erzeugerpretse landwirtschaftlicher Produkte 16. Index der Bruttostundenlahne in der lndustrie
V Aussenhandel
17. Aussenhandel der Gemeinschaft 8. Wert der Einfuhr
9. Wert der Ausfuhr
20. Index des Einfuhrvolumens 21. Index des Ausfuhrvolumens
22. Index der Einfuhrdurchschnittswerte 23. Index der Ausfuhrdurchschn1ttswerte 24. Index der "terms of trade"
VI Oeffenthche Finanzen und Kreditwesen
25. Steuere1nnahmen des Staates 26. Bestand an Spareinlagen
27. Sicht- und Term1ne1nlagen be1 Kreditinstituten 28. Volumen der Kred1te an W1rtschaft und Private
LISTE DES TABLEAUX
I Production 1ndustrielle
1. Indice general de la productlon industrielle
2. Indice de 1a production des industries transformatr1ces des rnetaux
3. Indice de 1a p-roductlon des 1ndustries ch1m1ques 4. Ind!ce de 1a pi"oduction des industries textiles 5. Production de houille
6. Production d' acier brut 7. Production d I e1ectr1Clte
II Commerce interieur et transports
8. Ind1ce du chiffre d'affaires du commerce de detail 9. Traf1c ferroviaire marchandise
Ill Emploi et ch6mage
10. Ind!ce des effectifs ouvners dans 1'1ndustr1e 11. lnd1ce des heures-ouvr1ers dans l11ndustr1e 12. lnd1ce du nombre de chdmeurs
IV Prix et salair es
13. Indice des pr1x a Ia consommabon 14. Indice des prix de gros
15. Indice des pr1x agricoles ala productlon
16. Indice des sala1res horaires bruts dans l'industrie
V Commerce exterieur
17. Commerce exteneur de la Communaute 18. Valeur des importations
19. Valeur des exportations
20. Ind1ce du volume des importations 21. Ind1ce du volume des exportations
22. Ind1ce de Ia valeur moyenne des importations 23. Ind1ce de la valeur moyenne des exportations 24. Ind1ce des termes de l'Ekhange
VI Finances pubhques et credit
25. Recettes fiscales de 1' etat 26. Situatlon des depots d'epargne
1
1
1
1
1
1
1
1
1
1
1
1
' 1
1
1
1
1
1
1
1
1
1
1
1
1
1
1
1
1
1
1
1
1
1
1
1
1
1
1
1
1
1
1
1
1
1
I. Gesamtindex der ondustriellen Produktion
(ohne Baugewerbe und Nahrungs- und Genussmittelmdustrie) 1a1
1953 = 100
Johr Januar Februar Marz Aprtl Mao Land - Pays
Ann8• Janv;er Fevrrer Mars Avrd Ma1
Deutschland - AJ/emagne 1957 141 147 146 152 154
(BRl (RF) 58 148 149 151 156 153
59 146 152 158
!
Saarland - Sorre 1957 127 33 128 133 136
58 135 131 136 134 136
59 125
Belgien - Belgique 1957 124 130 131 133 133
58 121 122 120 117 115
59 114 114
Frankreich - France- 1957 144 148 146 148 151
58 160 163 161 162 164
59 155 160 157
ltali•n - /toll• 1957 131 137 140 145 146
58 139 139 141 143 146
59 l<t2 151 155
Luxemburg - L uxembOUt'!IJ 1957 128 126 128 129 131
58 124 124 122 125 125
59 120 117 124
Niec:lerlande - Pays-Bas 1957 133 135 135 133 137
58 125 127 129 130 134
59 133 139 141
Gemeinschaft - Communautci 1957 138 144 143 147 150
58 146 148 148 151 15'
59 145 151 153
(a) Arbeitstag1ich berechnet
I. lnd1ce general de Ia production ~ndustrielle
(non compris battment, mdustnes alimental res, botssons et tabacs) (a 1
Jun1 Jul1 August Septembe Oktober November Dezember
Jum Juillet A oUt Septembre Octobre Novembre Decembre
149 140 139 154 154 161 151
156 147 143 157 161 167 154
136 130 129 129 126 141 135
144 129 125 129 131 137 125
122 90 117 127 128 126 124
113 99 106 118 118 117 115
152 134 100 148 150 159 162
161 147 102 149 156 161 158
147 143 113 147 139 144 139
151 145 114 149 148 1<> 1 145
130 12~ 121 121 125 124 121
122 116 115 119 120 122 119
139 123 119 130 126 126 125
135 120 124 132 134 133 128
147 135 121 148 147 153 148
152 1<12
123
I
149 152 157 149(a) Ind>ce corrige de 1'inega1ite du nombre
de ]Ours ouVra.blcs
2. Produktionsindex der metallverarbeitenden lndustrie (a)
1953=100
April
Jahr Januar F ebruar Marz. Mai Juni
Land - Pays
AnnO• Janvier F8vr~er Mars Avril Mai Juin
Deutschland - Alloma,?J"" 1957 153 164 160 170 173 172
(BR\ (R ) 58 164 170 173 179 177 185
59 167 177 182
Saarland .. Sarre 1957 136 156 151 160 174 166
58 153 159 166 166 167 208 59 139
Belg1en - Belgique 1957 133 144 144 150 147 135
58 129 136 134 131 132 125 59 121 127
Frankreich - France 1957 152 159 156 159 171 169
58 177 182 178 180 186 180 59 170 180 172
Ita lien - ltallo 1957 128 141 144 148 151 152 58 141 143 148 152 153 161 59 137 148 159
Niederlande - Pays-Bas 1957 141 145 142 145 149 150
58 130 133 139 137 148 150 59 141 152
Gemeinschaft - Communout8 1957 147 156 154 160 166 164 58 161 165 166 170 172 174 59 159 169
(a) Arbeitstng11ch berechnet
2. lndice de Ia production des industries
transformatrices des metaux (a)
Juli August Septembe Oktober November Oezember
Jui /let A oUt SeptemDre Octo.bre Novombre 08cembre
152 148 171 167 178 173 166 160 182 185 194 184
176 151 153 146 163 157 160 138 152 151 168 148
93 126 140 139 136 138 109 114 130 125 132 119
148 89 160 163 175 184 163 92 158 170 176 175
147 86 147 136 140 138 150 86 150 146 151 140
138 126 137 127 129 126 137 137 141 144 138 131
146 116 160 157 166 166 158 122 164 168 174 167
-- ---
t- Monota-durch·
schnltt
Moyenne
mensuelle
165 177
157 161
135 126
156 168
138 143
137 139
154 163
(a) Iodice corr1ge de 1•inega1ite du nombre
3. Produktionsindex der chemischen lndustne (a)
Januor Februar Mdrz
Land - Pays Jahr
Amt8e Janv•er Fevr~er Mars
Deutschland - A//ema,?:ne 1957 147 153 153
{BR) (R ) 58 161 166 165
59 170 176 184
Saarland - Sorre 1957 132 129 129 58(b) 132 116 107 59 132
Belgien - Belgique 1957 146 132 143
58 142 132 139 59 150
FrankNich ... Fronce 1957 162 173 172 58 190 198 195 59 197 207 207
Ita lien - /tali• 1957 147 145 150 58 154 153 157 59 179 182 186
Luxemburt - LWiembO<JI"g 1957 149 142 147
58 137 136 131
59 109 103 112
Niederlonde - Poys·Bos 1957 142 138 135 58 136 136 140 59 139 143 145
Gemeinachoft - CommunouM 1957 151 155 156
58 165 168 168 59 177 182 186
(a) Arbeitst~glich berecknet ausser fur Belgien (b) Neuer Index, dessen Reihen mit denen fruherer
Jahre nicht voll vergleichbar sind
1953 = 100
April Mao
Avril Mao
159 161 171 168
138 136 116 143
147 139 135 135
166 174 206 204
158 156 157 169
144 145 128 139
134 133 138 138
158 160 173 175
3. lndice de Ia production des industries ch1miques (a)
Monotl·
Junt Jul1 August Septembe Oktober November Dezember scM durch· itt
Jum JuHiet Aoiit Septem&re Octobre Novembre Dficembre Moyenne
mensuelle
159 152 152 160 163 166 155 157 172 165 161 168 172 180 169 168
149 139 142 145 125 140 141 137 150 138 132 138 133 127 llO 129
136 134 139 140 150 136 139 140 142 128 129 140 140 127 147 136
169 156 147 175 186 189 193 172 205 185 164 191 206 206 206 196
160 156 155 156 150 158 156 154 171 165 163 167 171 180 172 165
144 132 131 136 137 134 135 140 133 128 126 128 124 128 119 130
140 125 122 131 132 134 140 133 143 129 131 133 140 140 134 136
160 152 149 160 163 167 164 158 178 166 159 170 177 182 176 172
(a) Ind1ce corrige de l•1nega1ite du nombre de
jours ouvrables~ sauf pour la Belg1que.
4. Produktionsindex der Textilindustrie (a)
1953 = 100
Mi:irz April Mai Juni
Land - Pays Jahr Januar Februor
AnMe Janv1er F8vr1er Mars Avrj/ Mai Jum
Deutschfancl - A//emogne 1957 132 134 127 129 132 115
(BRl (RF) 58 132 123 120 123 115 115
59 ll5 118 119
Belg1en - Belgique 1957 128 132 130 131 134 127 58 108 101 95 95 93 97 59 109 109
Frankreich - France 1957 124 129 124 130 135 131
58 132 134 129 130 129 128 59 98 102 103
Italian - ltolio 1957 108 113 113 115 117 119
58 104 107 107 106 107 110
'"
105 109 112Luxemburg - Luxembourg 1957 87 88 88 87 80 76
58 89 82 86 84 64 65
59 68 66 72
Niederlande - Pays-Bas 1957 117 119 120 112 116 113
58 110 112 109 106 105 109 59 113 112
Geme 1n schaft - C ommunaute 1957 124 128 123 126 129 121 58 123 120 116 117 114 115 59 108 111
(a) Arbeitst~glich berechnet
4. lndice de Ia production des industries textiles (a)
Monats~
Jul1 August Septembe Oktober November Oezember schnitt
durch-Juillet A oUt Septembre Octobre Novembre D8cembre Moyenne
mensuelle
120 118 135 134 140 124 128 117 108 124 127 130 114 121
100 110 125 123 120 110 123 85 90 107 113 112 111 101
99 81 128 126 132 132 122 113 57 117 115 115 105 117
113 73 120 108 114 105 110 109 66 Hl 113 115 IU7
lOs-51 69 80 88 83 82 80
55 66 70 76 73 69 73
99 112 111 110 110 110 112 93 104 111 116 114 111 108
110 99 128 124 129 120 121 109 85 117 119 120 110 114
(a) Indice corrige de l'inega1ite du nombre de jours ouvrab1es
-5. Steinkohlenforderung (in 1000 t) 5. Production de houille (en 1000 t)
Monats.
Mdrz Aprd Jul1 Septembe November Dezember
durch-land - Pays Jahr Januar Februar Mai Jun1 August Oktober schnitt
Ann8e Janv1er Ffivrier Mars Avril Mal Jvin Jurllot Aolit Septembre Octobre Novembre D8eembre Moyenne
mensuelle
Deutschl~d
- Allema,?t•
1957 11.829 10.853 11. 574 11.099 11.614 9.953 11.470 10.838 10.045 11.770 11.597 10.514 11.096(BRl (R ) 58 11. 978 10.573 11.551 11.140 11.008 10.485 11.513 10.534 11.034 11.714 10.671 10,380 11.049
59 11.377 10.351 10.498 10.926
I
Saarland - Sarre 1957 1.535 1. 427 l. 412 1. 349 1.427 1.228 1.469 1.391 1.262 l. 359 1.369 1.227 1. 37158 l . 559 l. 339 1.543 1.336 1. 300 1.285 1.411 1.297 1. 393 1.483 l. 294 1.183 1. 36~
59 1.432 1.319 1.307 1.398
Belgien - Belgique 1957 2.417 2.393 2.537 2.469 2.537 2,384 2.061 2.387 2.189 2.659 2.535 2.517 2.424
58 2.666 2.417 2.529 2.413 2. 329 2.105 1.985 2.041 2.113 2.331 1. 937 2,196 2.255 59 2.088 1.576 2.035 2.051
Frank,.lch .. France 1957 5.122 4.715 4.791 4.787 4.663 4.481 4.874 4.537 4.525 4.856 4.803 4.644 4.733
58 5.289 4.824 5.211 4.783 4.426 4,785 4.722 4.132 4.762 5. 328 4.722 4. 736 4.810 59 5.256 4.871 4.969 5.242
Ito lion - /to/lo 1957 76 84 89 87 90 79 100 94 92 83 72 73 85
58 90 73 51 59 59 57 59 53 51 59 52 58 6C
59 60 60 64 63
Niodorlando - Pays-Bas 1957 1.079 973 934 855 999 866 1.012 926 837 1.026 973 895 948
58 1.049 897 1.041 958 969 988 1.058 908 1.044 1.085 971 912 99C 59 1.069 937 1.010 1.001
6. Rohstahlerzeugung
(al(In 1000 t)
Jahr Januor Februar
Land - Pays
Ann8e Janvier Fevrier
Deutsch land - AIJomagne 1957 2.055 1.919
(SRI (RF) 58 2.220 1.981
59 1,847 1.737
Saarland - Sorre 1957 296 279
58 311 272 59 302 290
Belgien - Belgique 1957 575 519
58 560 492 59 504 465
Fr<~nkrelch - France 1957 1.207 1.102 58 l . 319 1.185 59 1.215 1.139
ltollon - Ito 1/o 1957 558 508
58 576 509 59 505 470
Lllllomburg .. Luxembourg 1957 301 279
58 295 268
59 294 266
Niodorlondo - Pays-Bas 1957 107 86
58 105 110 59 135 126
Gemeinschaft - Communoute 1957 5.099 4.692 58 5.386 4.817 59 4,802 4,493
.
Man: April
Mcrr5 Avril
2,054 1.929 2,061 1.878 1,823 2.148
300 272 313 278 286 316
578 556 527 500 504 536
1.216 1.091
l. 343 1.255 1.277 1.300
570 548 547 535 545 535
296 296 293 284 294 310
103 89 133 116 133 135
5.117 4.781 5.217 4.846 4.862 5,280
(a) Einsch1, der Erzeugung der unabh~ngigen
Stah1giesse-reien.
6. Production d'acler brut
cal(en 1000 t)
Monau.
Mot Juni Juli August Septembe Oktober November Dezember schnitt durch·
Mai Juin Juillet A oUt Septem&re Octobre Novembre Deco,.,... Moyenne
men•wlle
2,067 1.845 2,066 2,121 2.064 2.225 2,176 1,987 2.042 1,875 1.859 1,922 1.864 1.783 1,887 1.780 1.676 1,899
294 265 298 299 285 308 286 281 289 281 280 310 287 296 313 273 271 290
564 459 242 547 556 597 532 542 522 469 488 466 480 525 541 461 498 500
1.181 1.144 1.171 1.004 1.202 1.268 1.245 1.269 1.175 1.226 1.234 1.156 959 1.251 l . 338 l. 161 1.205 1.219
563 561 588 523 586 625 585 551 566 538 512 539 401 535 559 508 506 522
298 288 297 286 282 308 289 273 291 277 275 284 263 280 297 275 288 282
95 99 105 96 101 113 94 95 99 124 120 108 122 124 128 125 123 120
5.062 4.661 4.767 4.876 5.076 5.444 5.207 4.998 4.984 4.790 4.768 4.785 4.376 4.794 5.063 4.583 4.567 4.833
(a) Y compris 1a production des fonderies d'acier inde-pendantes.
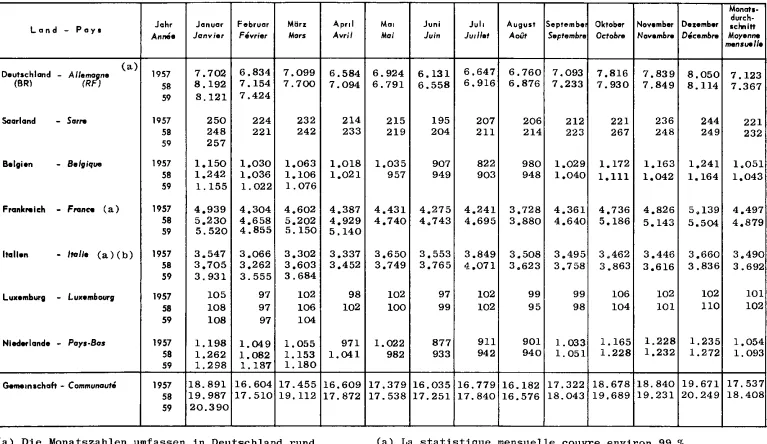
7. Stromerzeugung
(in Mio kWh)
Februar Mi:irz
Land - Pays Jahr Januar
Ann8e Janvier Fevrier Mars
Deutschland
- Allemo/t•
(a) 1957 7. 702 6.834 7.099(BRl (R ) 58 8.192 7.154 7.700
59 8.121 7.424
Saarland - Sorre 1957 250 224 232
58 248 221 242 59 257
Belgien - Belgique 1957 1.150 1.030 1.063 58 1.242 1.036 1.106 59 1.155 1.022 1.076
FranlcNich - Frane. (a) 1957 4,939 4,304 4,602 58 5,230 4.658 5.202 59 5.520 4.855 5.150
fiG lion - ltGiio (a) (b) 1957 3.547 3.066 3,302 58 3,705 3.262 3,603
59 3.931 3.555 3.684
Luxemburg - Luxembourg 1957 105 97 102
58 108 97 106 59 108 97 104
Niedorlando - Poys·Bos 1957 1.198 1.049 1,055
58 1,262 1,082 1.153 59 1.298 1.187 1.180
Gemetnsehaft - Communaute 1957 18.891 16.604 17.455 58 19.987 17.510 19. 112 59 20.390
(a) Die Monatszahlen umfassen in Deutschland rund 99
%,
in Frankreich rund 92%
und in Ita1ien rund 98%
der gesamten Produktion.(b) Bruttoerzeugung
Aprd Avril 6.584 7.094 214 233 1.018 1.021 4.387 4,929 5,140 3,337 3,452 98 102 971 1.041 16.609 17.872
7. Production d'electricite
(en millions de kWh)
MDI Juni Jul1 August Septembe Oktober November Dezember Mai Juin Ju1 /let A oUt Septembre Octobre Novembre D8cembre
6. 924 6,131 6,647 6,760 7.093 7.816 7.839 8.050 6.791 6.558 6,916 6.876 7.233 7. 930 7.849 8.114
215 195 207 206 212 221 236 244 219 204 211 214 223 267 248 249
1.035 907 822 980 1.029 1.172 1.163 1,241 957 949 903 948 1.040 1.111 1.042 1.164
4.431 4.275 4.241 3,728 4.361 4,736 4.826 5.139 4,740 4.743 4.695 3,880 4.640 5.186 5.143 5.504
3,650 3,553 3.849 3.508 3,495 3.462 3.446 3,660 3.749 3.765 4.071 3,623 3. 758 3.863 3,616 3.836
102 97 102 99 99 106 102 102 100 99 102 95 98 104 101
llO
1.022 877 911 901 1. 033 1.165 1.228 1.235 982 933 942 940 1. 051 1.228 1.232 1.272
17.379 16.035 16.779 16.182 17.322 18.678 18.840 19.671 17. 538 17.251 17.840 16.576 18.043 19.689 19.231 20.249
(a) La statistique mensuel1e couvre environ 99
%
de la production allemande, 92% de la produc-tion frangaise et 98
%
de la production ita1ienne. (b) Production brute [image:13.822.31.798.80.524.2]8. Index der Einzelhandelsumsatze
Land - Pays Jahr Januar Februor
An Me Janvier Fevrier
Deutschland - AllemaiJ"" A 1957 122 116
(BRl (R I 58 135 124
59 140 127
Belgian - Belgique B 1957 117 105 58 129 110 59 139 116
Belg1en - Belgique
c
1957 128 12258 136 120 59
Fr<1nkrelch - France 1957 178 109
- B Par>s - 58 204 122 59 249 145
FrGnkrelch - France
c
1957 120 12758 152 159 59 169 167
Ita lien - ltallo B 1957 in
58
59
Nieclerlande - Pays-Bas A 1957 137 118
58 146
us
59 157 120A Gesamter Einzelhandel - Taus commerces
B Warenh§user - Grands Magasins
C Konsumgenossenschaften - Cooperatives
1953 = 100
Marz Aprd Moi
Mars Avril Mai
133 148 137 148 146 152 154
122 130 127 135 138 143 139
121 119 123 133 126 136
149 140 158 168 163 178
128 134 133 161 171 180 166
Vorbereitung
140 146 151 140 143 164 148
8. lndlce du chiffre d'affaires du commerce de detail
Monats.
Jun• Juli August Septembe Oktober November Oezember schnitt
dureh-Juin Juil/et A oUt Septembre OctoDre Novembre oecembre Moyenne
menn-./Je
132 145 139 130 149 158 216 144 133 153 137 135 157 154 229 150
124 134 121 117 127 157 173 130 131 145 124 128 146 153 187 139
123 121 124 123 138 126 147 126 127 131 124 127 136 125 153 131
150 135 121 171 194 217 282 167 156 157 120 173 224 202 320 183
150 150 147 141 150 153 189 144 172 181 173 171 173 164 213 172
en preparation
9. Eisenbahnguterverkehr 9. Trafic ferroviaire marchandise
(in Mio Nettotonnenkilometern) (millions de tonnes-kilometres nettes)
Monats·
durch
Land - pay' Jahr Januar Februar M&rz Aprd Mat Jun~ Jul1 August Septembe Oktober November Oezember scM itt
Ann8e Janvier F8vrier Mars Avrd Ma1 Jurn Ju,/lot A oUt Septembre Octobre Novembre D8cembre Moyenne
mensuelle
Deutschlmd - A
llemolr•
1957 4.395 4.143 4,580 4.330 4.317 3. 925 4,410 4.409 4.053 4,661 4.486 4.134 4.320(BR\ (R ) 58 4.178 3.369 3,753 3.628 3,723 3,627 3.981 3,839 3,951 4.341 4.042 3.829 3,855
59 3,746 3.368
Saarland - Sarre 1957 89 87 93 86 94 85 94 88 86 91 91 89 89
.
58 94 82 89 84 82 82 88 82 84 89 81 79 8559 83 76 85
Belgien - Bolgique 1957 602 559 594 563 580 526 419 531 522 573 539 523 544
58 519 458 494 484 464 465 451 437 484 522 477 524 481
59
468 445Frank,.ich - France 1957 4,520 4,230 4,664 4,290 4,580 4,420 4,600 3,870 4,330 4,740 4,710 4.700 4,471
58 4,640 4,330 4,670 4,470 4,440 4,570 4,390 3,490 4,330 4,740 4.330 4.480 4.407
59
4.410 4.140Ita lion - ltallo 1957 1.234 1,257 1,319 1.187 1.227 1,110 1.195 1,019 1.216 1.226 1,089 1.217 1,191
58 1.013 1.131 1.201 1.062 1.123 1.111 1.071 924 1.095 1.156 990 1.157 1. 086
59
l. 059 1.144Luxomb ... g - Luxembovrg 1957 58 52 55 55 54 51 51 52 49 53 52 54 53
sa
56 49 54 51 47 45 46 44 46 50 46 50 4959
Nioderlando - Pays·Bas 1957 315 288 295 266 286 265 280 267 254 300 300 267 283
58 273 243 266 248 253 242 249 247 255 292 281 277 260
59 272
Gemeinschaft - Communout8 1957 11,213 10.616 11.600 10.777 11. 138 10.382 11.049 10.236 10.510 11.644 11.267 10.984 10.951
58 10.773 9.662 10.527 10,027 10.132 10.142 10.276 9.063 10.245 11. 190 10,:.:147 10,396 10.223
JO. Index der beschaftigten Arbeiter in der lndustrie
(Bergbau und Verarbeltende lndustrie)
1953 = 100
Jahr Januar Februar Mtirz April Moi Land - Pay1
Ann8e Janvier F8vrier Mars Avril Moi
Doutochland - A //emo?Jne 1957 120 121 122 123 124
(8Rl (R ) 58 124 123 123 125 125
59 121 121
Saarland - Sorre 1957 106 106 107 108 108
58 113 113 114 113 113
59
Belgian - Bolgiquo 1957 104 104 104 104 105
58 102 101 100 100 100
59
Fr<~nkrolch .. France (a) 1957 102 • • 103 •
58 105 • • 106 •
59 103
Ita lion - ltolio 1957 102 103 104 105 106
58 102 102 102 103 103 59
Luxemburg - Luxembourg (b) 1957 104 102 103 110 115
58 105 104 105 113 116
59 107 105 106
Niodorlando - Pay•·B•• 1957 • • 107 • •
58 • • 103 • •
59
(a) Index der Beschaftigten in der Industrie
(b) Einsch1. Baugewerbe, Transportwesen und Energiewirtschaft
10. lndlce des effectifs ouvriers dans l'industrie
(Industries extractives et manufacturieres)
Monata.
Juni Juh August Septembe Olctober November Dezember ochniH
durch-Juin Jui//et A oUt Septembre Octobre Navembre Oecombre Moyenne mon•uolle
125 125 126 127 127 127 125 124 125 125 125 125 125 124 122 124
109 109 110 111 112 112 113 109
113 113 113 113 113
.
105 104 104 105 105 104 103 104
98 98 98 98 98 97 96 99
•
104 • • 105 • • 104• 105 • • 105 • • 105
106 106 109 109 107 105 104 105 104 103 105 106 104 101 100 103
116 116 116 117 117 11~ H4 112
ll8 119 119 119 118 117 115 114
106
•
• 107 • • 105 106102 • • 103
•
•
102 102II. Index der geleisteten Arbeiterstunden in der lndustrie
(Bergbau und Verarbeltende lndustrie)
Jahr Januar Februar M8rz
Land - Pays
Ann8e Janvier F8vrier Mars
Oeutschle11d
- All•malr•
1957 11B 111 117(BRl (R ) 58 117 lOB 114
59 110 104
Bel.gien - Belgique 1957 115 lOB 114
58 111 100 105 59 97 B9
Frankreich - Franc. (a) 1957 106
58 109
.
.
59 103
Italian - ltalle 1957 106 103 10B
58 101 99 105 59
N;ed.,.londe - Poys-Sos 1957
.
.
58
.
59
1953 = 100
April Mai
Avril Mai
116 121 115 113
113 115 104 100
106 109
105 110 100 107
.
(a) Index der "Akt1v1 t!tt" der BeschlUtigten in der Industr1e
II. lndice des heures-ouvriers dans l'industrie
(Industries extractives et m3nufacturieres)
Juni Juli August Septembe Oktob.,. November Dezember
Jui:t Juil/et A oUt Septembre Octobre Ncweml>re Dicembre
lOB 117 116 115 121 119 113 109 116 110 116 123 112 112
104 B4 102 109 115 107 106
100 B9 91 104 109 93 101
lOB
.
109108 107
.
106 112 B9 111 110 104 100 100 109 B1 llO 114 100 96
.
.
.
(a) Ind1ce d'actlvit€ de la main d'oeuvre Jccupee dans l'1ndustrie
Monats- durch-scm itt
Mor-nne
mensuell•
I
116I
1 11I
lOB
I
101I
'
lOB
I
I
107 I I105
I
102
I
12. Index der Arbeitslosenzahl 12. lndice du nombre de chomeurs
1953 = 100
Monafl.
April Jun1 Julr August Septembe Oktobor Oezember
durch-Land - Pays Jahr Januar Februar Marz Mai November schnltt
Anncie Janvier Fevrier Mars Avril Moi Juin Julllot A.Ut Septembre Octohro Novembro Oecombrw Moyenno
mensw/le
Deutsch lond
- Al/emo/t•
1957 117 88 56 47 39 36 31 29 29 29 38 96 53(BRl (R ) 58 114 105 88 47 37 32 28 26 26 28 34 74 54
59 107 88 47 31
Saarland - Sarre 1957 130 129 119 110 113 107 102 106 105 101 111 106 112
58 121 122 123 117 115 117 115 116 115 116 121 137 118
59 152
Belgien - Bolgiquo 1957 55 53 47 43 39 36 35 34 34 35 44 54 42
58 63 63 60 56 54 53 53 53 54 57 70 83 60
59 92 92 80 72
FranlcNich • Fronce (a) 1957 59 58 51 46 42 38 34 35 37 42 45 49 45
58 56 56 53 51 47 43 41 43 48 57 65 74 52
59 94 99 90 84
Ita lion - ltalle 1957 102 101 97 93 90 85 84 82 82 84 88 95 90
58 101 100 98 94 87 84 84 83 82 85 89 98 90
59 102 99
~ ~
-Niederlande - Pays-Bas 1957 51 48 38 35 32 29 38 40 43 50 70 116 49
58 132 128 116 98 83 76 83 79 74 79 90 125 97 59 135 124 85 70
13. Index der Verbraucherpreise 13. lndice des prix
a
Ia consommation1953 = 100
Monats-Jahr Januar Februar Marz April Mai Jun1 Juli August Septembe Oktober November Dezember
durch-Land - Pays scM itt
Annrle Jonvier Fevrier Mars Avrrl Moi Juin Juillet Ao<it Septembre Octobte Novembre Decem&re Moyen,.
mensuelle
Deutschland - Alle-I'Jne 1957 106 106 106 106 106 106 107 107 107 108 108 109 107
(BRJ (R ) 58 110 110 110 110 111 110 111 110 109 109 110 110 110
59 110 110 110 llO
Saarland - Sarre 1957 108 107 106 107 107 111 112 114 116 119 123 125 113
58 128 129 130 131 131 132 131 130 130 131 131 132 130
59 134 135 136 136
Belgien - Belgique (a) 1957 106 106 106 106 106 106 107 107 108 108 108 109 107
58 109 108 108 108 108 109 108 108 108 108 108 109 108
59 109 109 109 109
FrankNich - Frcrn .. (Paris) 1957 103 104 103 102 103 104 104 106 107 109 111 114 105
58 117 119 120 121 121 122 122 123 123 124 123 124 122
59
127 128 128Ita lien - /tali• 1957 110 110 110 109 109 109 110 110 110 111 112 112 110
58 113 112 112 113 114 115 114 114 114 113 113 113 113
59 113 112 112
Luxemburg - Luxembourg (a) 1957 104 105 105 105 105 106 106 108 108 107 108 108 106
58 107 107 106 106 106 107 107 107 107 107 107 107 107
59
107 107 106 106Niederlande - Poys·Sos 1957 111 111 110 111 111 115 116 118 119 119 118 118 115
58 118 118 118 119 117 119 117 116 116 116 116 117 117
59
117 117 11714. Index der Grosshandelspreise 14. lndice des prix de gros
1953 = 100
Monotla
April Juni Jul1 August Septembe Oktobor November Oezember
durch-Land - Pays Jahr Januar Februar Marz Mai scM itt
Ann8• Janvier F8vrier Mars Avril Mar Jum Juillot A oUt Septembre Octobre Novembre Decembre Moyenne
mensuelle
Deutsch land - A llomo,?t" ( a ) 1957 107 107 106 107 106 108 109 109 109 109 109 110 108
(BRl (R ) 58 110 109 109 108 108 108 107 107 107 107 108 108 108
59 108 108 108
Belgien - Bolgiquo 1957 106 106 106 107 107 106 107 106 106 106 106 106 106
58 105 104 103 102 102 101 101 100 100 100 100 100 102 59 100 100 100
Frankreich - France 1957 105 104 104 104 106 106 107 108 109 112 116 119 108
58 120 120 120 120 124 121 120 121 120 120 120 121 121 59 127 126 125 125
Ita lion - ltol/o 1957 104 103 103 102 102 102 102 102 102 103 103 103 103 58 103 102 102 102 102 102 101 100 100 100 99 99 101 59 98 98 97
Niodorlando - Pays-Bas 1957 108 107 107 107 107 107 108 107 107 106 106 106 107 58 106 106 106 105 104 104 103 102 102 104 106 106 105 59 107 106 105
15. Index der Erzeugerpreise landwirtschaftlicher Produkte 15. lndice des prix agricoles
a
Ia production1953/54=100
Monats-Jahr Januar Februar MHrz April Mai Juni Juli August Septembe Oktober Dezember
durch-Land - Pays November sc:hnitt
Ann8e Janvier F&vner Mar:~: Avril Mar Juin Jut/let Aocit Septembre Octobre Novembre D&cembre Moyenne mensue/le
DeutschiCI'Id - AllemoiJne 1957 114 112 Ill 115 113 116 124 120 119 116 117 118 116
(BRl (R ) 58 119 119 120 122 121 119 117 114 113 114 117 119 118
59 121 121 121
Belgien - Belgique 1957 94 91 91 94 95 92 97 93 93 94 93 96 94
58 97 89 92 94 92 92 89 85 86 91 92 94 91
59 95 96 97
Fronlcreich - Fronce 1957 110 110 110 112 112 117 121 118 118 125 133 128 118
58 136 137 138 142 144 150 149 151 144 141 135 132 141 59 132 131 131
Ita lien - /ta/ie 1957 112 108 106 105 104 104 104 105 107 110 111 113 107
58 112 110 112 115 116 116 113 111 110 109 106 105 111 59 104 103 103
Nieclerlande - Pays-Bas 1957 111 104 102 100 100 99 100 101 102 106 104 105 103
16. Index der Bruttostundenlohne in der lndustrie 16. lndlce des salaires horaires bruts dans l'industrie
1953 = 100
Februar Man. April
Jahr Januar
Land - Pays
Anneie Janvier F8vrier Mar5 Avril
Deutschland - A/lem"/
1
ne (a) 1957
.
125.
.
(BR) (R ) 58 136
.
.
59
.
142 Saarland - Sorre (a)( b) 1957.
13058
.
153.
59
Belgien - Se/glque(c) 1957 125 125 126 126 58 132 132 132 132
59
132 132Frankreich .. France ( b)(c) 1957 128
.
13158 143 149
59
154Ita lien - /ta/le (a) 1957 121 121 121 122 58 126 127 127 128
59
Nieder land• - Pays-Bas (c) 1957 133 133 134 134 58 141 141 141 141
59
145 145 145 145 (a) Index der durchschnittlichen Bruttostundenverdienste (b) Gesamtindustrie ohne Bergbau(c) Index der Tarifstunden1ohne
Monats-Mai Juni Juli August Septembe Oktob.,. November Dezember scm itt
durch-Moo Juin Jui/let Aoilf Seplembre Octobre Novembre Decemlwe Moyenne
-
mensue/le129
.
131.
.
132.
130138
.
139.
.
140 • 138139
.
142.
.
149.
137161
.
.
165.
.
166 161126 126 128 128 128 127 125 125 126 133 133 132 132 132 133 133 133 132
.
.
134.
138 134.
152.
.
153.
150122 124 122 123 122 122 124 126 122 )27 129 126 130 128 129 131
135 135 135 140 110 141 141 141 137 141 145 145 145 145 145 145 145 143
(a) lndice des gains moyens horaires bruts
17. Aussenhandel der Gemeinschaft (a)
E1nhert
b,w Jahr Januor Februar Marz Bosrs Ann8e Jonvrer F8vrrer Mars
Umte ou
~ose
A. Handel ZW1SChen den
Gesamtwert - Valeur totole MIO $' 1957 593 555
(b) (b) 5B 566 530
59 550 548
Volumen~ndex- lndrce de volume 1953 = 100 1957 174 161
(b) (b) 5B 166 160
59 173
Werte - Voleurs B.
Ernfuhr- lmportotrons Mro $ 1957 1583 1449 58 1428 1300 59 1298 1183
Ausfuhr- Exportations Mro $ 1957 1189 1172 SB 1227 1255 59 1215 1231
Volumenrndrzes- lndrces de volume
Emfuhr- 1mporlotlons 1953- 100 1957 162 147 58 158 142 59 157
Ausfuhr- Exportat1ons 1953 = 100 1957 136 136 SB 142 143 59 146
lnd1zes der Ourchschn1ttswerte-Indices des valeurs moyennes
E 1nfuhr - lmportat1ons 1953 ~ 10 1957 105 106 58 97 98 59 89
Ausfuhr- Exportations 1953=100 1957 101 100
5B 100 102 59 96
Index der "terms of trode" 1953= 100 1957 96 94
lnd1ce des termes de l'echange 58 103 104 59 JOB
(a) Die Indexziffern sind vorlauf1g und wurden auf Grund der Dollar- Werte errechne t.
(b) Auf Basis der Einfuhrstat1st1k
623 590 182 176 Handel 1578 1395 1360 1316 160 159 154 152 10'3 94 103 100 97 106
17. Commerce exteneur de Ia Communaute (a)
m~nats-
durch-A.pnl Mao Jum Julr August September Oktober November Dezembor achmtt
Avrr/ Ma• Jurn Juri let A oUt Septembre Octobre Novembre Decembre Moyenne
mensuelle
Uindern der Geme1nschaft - Commerce entre les pays de 1a Com.munaute
574 609 569
555 563 557
166 174 163 163 170 169
m1t dritten Lanctern
1514 1604 1481 1358 1344 1346 1228 1341 1227 1265 1258 1279 153 162 154 154 153 153 136 148 136 144 145 148
106 106 103 95 95 95 105 105 105 102 101 100 99 99 102 108 106 106
592 528 560 621 587 595 565 485 564 615 591 596 168 152 165 180 173 178 171 148 174 189 182 183 - Commerce avec les pays tiers
1525 1410 1317 1422 1393 1504 1350 1206 1312 1364 1319 1429 1337 1229 1183 1396 1320 1358 1358 1200 1341 1462 1370 1533
157 148 138 153 148 163 154 139 153 159 155 166 147 137 132 157 150 158 159 140 155 172 161 183
105 102 103 100 102 99 94 93 92 92 91 93 106 104 104 103 102 100
99 99 100 99 99 97 101 102 102 104 100 101 106 107 109 107 108 105
(a) Les 1nd1ces sont proviso1res et calcules A partir de valeurs en dollars
585 565 171 171 1485 1346 1277 1322 154 154 144 154 104 94 103 99 99 106
(b) Sur la base des statistiques d1
18. Wert der Einfuhr (c.i.f.) 18. Valeur des importations (c.a.f.)
(in nationaler Wiihrung) (en monnale nationale)
Pays E 1nhe1t Jahr Januar Februor Marz April Moo Jum Juli August September Oktober November Dezember
Land
-Un1tti Janvier Fevr1er Mars Avril Mai Juin Juillet A oUt Octobre Novembre D8cembre
mensue
Deutschland - Allemagne M1o DM 1957 2.549 ,421 2,696 2, 516 .664 2.478 . 714 2,596 2,607 2,908 2. 774 2, 641
(BR) (RF)
58 2, 712 2.410 2,596 2,413 . 394 2,464 .690 2,394 2,656 2,737 2.790 2. 594 59 2.537 2,440 2,610
-
Luxemburg Mrd FB 1957 15,4 14,3 14,8 14 ,6 14 13,7 13,2 14' 13, 14 14'- Luxembourg 58 13,3 12,3 13 '7 12,4 11,4 13,2 14,3 12, 13,
59 13,3 12, 15,
- Saarland FF 1957 207,0 182' 198 199, 185 166,8 159' 1 166,4 175' 210' 187,
- Serre 58
215 '8 194 211 218 194' 161,9 171, 188, 176, 189' 196,
59 192,8 189,
ltal1en - ltal1e l1re 1957 188,4 207,5 208,6 208,4 183' 188, 170,9 180,1 194' 178,2 210,5 191, 58 163,2 178,6 160,2 167,9 171,4 166 141,3 163,3 167, 160,7 176,7 165, 59 177,3
Nil!tderlande - Pays-Bas Moo Fl 1957 1,445 1, 251 1,422 1.152 1,478 1,334 1. 394 1.276 1,153 1,333
1,226 1,132 1,300 58 1.179 1,090 1,047 1, 144 1, 152 1.121 1.114 1,062 1.167 1,239 1.189 1.271 1,148 59 1.153 1.120 1.163
19. Wert der Ausfuhr (f.o.b.)
19. Valeur des exportations (f.o.b.)
(in nationaler Wahrung) (en monnaie nationale)
M~nats-
durch-Einheit Jahr Januar Februar Morz Apnl Moo Juni Juli August September Oktober November Dezember schmtt Land - Pays
Unite Annee Janvier F&vrier Mars Avril Moo lum Joo//et A oUt Septembre Octobre Novem&re Decembre Moyenne
-
mensuelleDeutschland - A//emagne MioDM 1957 2.447 2,705 3,233 2.801 3,204 2,856 3,058 3.085 2. 866 3.261 3.185 3.267 2. 997
(BR) (RF I 58 2,600 2,955 3
.oso
2,985 3,013 2. 953 3,174 2.941 3.239 3.368 3.234 3,457 3,08359 2,767 3.089 3.046
Belgien _ Luxemburg Mrd FB 1957 14,4
12 '. 14, I 13 .~ 13, ~ 13,3 12 ,: 10,~ 13' 14 ,( 13,' 12,8 13,3
Belgique Luxembourg 58 14,2 12,5 13,0 12 '9 12 '1 11,2
12 '. 10,3 13 '1 13,8 12,' 13,2 12,7
59 13,3 11,2 12, I 14,5
Frankre1ch - Saarland Mrd FF 1957 158,4 142 '7 164,9 154' 1 154,3 144 ,6 151,4 130,9 134,7 168,5 170, ~ 195.0 155.9
F,.,ce - Sa .... 58 174 ,5 173 ,8 186,5 171,8 160,1 181,2 180,2 146,8 157,C 202,9 192,~ 223,3 179,~
59 174,6 196,( 213,8
ltalien - /ta/ie Mrd L1re 1957 112
,o
117,9 138,4 128,9 139,9 124 ,9147 '1 134,4 129,7 151,2 131 .~ 137;~ 132,8
58 123,0 124.6 133 ,6 129,9 130,6 133,2 147,( 116,2 133, 143,0 123,. 144, 132,1
59 124,7 126,6
Niederlande - Pays-Bas Mia Fl 1957 1.016 875 1,008 822 997 89!> 1,042 875 l. 062 1.139 l. 075 960 981
58 998 913 1.012 912 1,015 974 968 950 1.152 1.173 1.079 1,079 1.019
20. Index des Einfuhrvolumens
Mdrz
Jahr Januar Februar Land - Pays
Ann8e Janv1er F8vrier Man
Deutschland
- Allema,?t"
1957 185 173 195(BR) (R I 58 206 185 200
59 204 198 216
Belg1en
-
LuxembW"g 1957 143 128 135Be/pique - luxembourg 58 132 117 130
59 132
Frankrtdch - Saarland 1957 170 149 167
France - Sorre 58 160 148 173
59 136 131 149
Ita lion - /tali• 1957 128 135 136 58 118 123 136 59
Niederlande - Pays-Bas 1957 179 152 175
58 152 141 137 59 158 151 160
(a) Unabhangig von den Monatswerten berechneter Jahresindex
1953 = 100
Aprd Ma1
Avnl Ma1
181 188 188 188
138 131 131 119
163 166 162 167
140 148 122 124
139 174 146 152
Juni
Jurn
180 194
126 120
163 157
131 137
158 147
20. lndice du volume des importations
Monats·
Jul1 August Septembe Oktober November De:z.ember
durch-sc:hnitt
Jui//et A oUt Septembre Octobre Novembre 08cembre Moyenne mensuelle
194 187 192 215 206 209 192 214 192 217 221 227 232 205
129 125 121 136 125 136 139(a J
122 115 130 140 126 135 137(a I
155 139 123 132 126 155 150 148 122 132 145 138 146 149
132 121 132 133 138 170 137 126 113 130 132 126 135 127
166 153 140 166 154 143 158 148 143 158 168 161 173 152
(a) Ind1ce annue1, ca1cule independamment des donnees mensue11es
21. Index des Ausfuhrvolumens
Februar Marz
Land - Pays Jahr Januor
AnnOe Jonvrer F8vr~er Mars
DeutschiCI'ld - A /Je,..,gne 1957 155 171 203
(BRl (RF) 58 161 182 195
59 177 199 197
Belgian
-
Luxemburg 1957 135 120 137Belgique - Luxemhoorg 58 128 122 126
59 135
Frankreich - Saarland 1957 140 123 146
France - Sarre 58 134 134 141
59 127 146 156
Ita lien - ltolie 1957 135 143 159
58 143 147 162 59
Niederlande - Pays-Bas 1957 145 127 144
58 148 136 149 59 165 138 158
(a) Unabhang1g von den Monatswerten berechneter Jahresindex
1953 = 100
Aprd Mao
Avril Mao
174 200 186 191
126 130 127 123
134 134 130 121
145 157 146 158
ll6 139 132 146
Junr
Jum
179 187
122 ll2
128 138
144 162
120 140
21. lndice du volume des exportations
Monats-Juli August Septembe Oktober November Dezember schnrtt
durch-Jutllet A oUt Septembre Octobre Novembre Decembre Moyenne
mensue/le
192 194 179 204 198 206 188 201 184 207 216 207 220 195
llO 103 124 137 124 125 133 (a
122 106 132 138 130 127 136 (a
130 ll:l 111 135 134 152 132 139 113 122 159 150 176 138
161 153 157 187 160 167 156 174 147 169 174 156 194 163
145 119 137 152 149 135 136 149 142 159 169 158 157 149
22. Index der Einfuhrdurchschnittswerte 22. lndice de Ia valeur moyenne des importations
1953=100
Monats-Aprtl Mai Jun1 Jul1 August Septembe Oktober November Dezember
durch-Land- Pays Johr Jonuor F ebruor Man schnitt
AnMe Jonv1er Ft!vrier Mars Avr1l Mao )uin Juillet A oUt Septembre Octobre Novembre D8cem&re Moyenne
mensuel/e
Deutschland - AJ/emogne 1957 104 105 104 104 106 103 105 104 102 101 101 100 103
(BR) (RF) 58 99 98 97 96 95 95 94 93 92 93 92 93 95
59 93 93 90
Belg1en - Luxemburg 1957 103 104 104 105 104 102 103 101 102 99 100 97 102
Belvique - Luxembourg SB 96 98 96 96 95 93 95 93 93 93 92 93 95
59 93
Fronkreu:h - Saarland (a) 1957 109 107 llO 120 ll1
Fronee - Sorre 58 118 117 118 ll6 117
59 ll7
Italian - ltolie 1957 ll2 107 114 ll2 112 110 llO 108 105 107 108 106 110
58 108 106 103 106 105 103 105 100 100 101 104 104 103 ~
~ 59
Niederlonde - Pays-Bas 1957 105 107 107 110 110 110 109 109 108 106 104 104 107
58 104 103 102 103 102 102 100 100 100 99 99 98 101
59 99 99 99
23. Index der Ausfuhrdurchschnittswerte 23. lndice de Ia valeur moyenne des exportations
1953 =100
Monots-.
durch-Johr Januar Februor Marz April Moi Jun1 Jul1 August Septembe Oktober November Dez:ember sdv11tt
Land - Pays
AnOOe Janv1er Fevrter Mars Avnl Mai )uin Judlet A oUt Septembre Octobre Novembre Decembre Moyenne
mensuelle
Deutschland
- Allemalt•
1957 102 103 103 104 104 103 103 103 104I
104 104 103 103
(BR) (R ) 58 105 105 102 104 102 102 102 104 101 101 101 102 103
59 101 101 100
Belg1en - Luxemburg 1957 107 106 107 107 108 109 106 106 106 106 106 103 106
Belgique - Luxemhourg 58 106 103 102 101 98 98 99 97 96 95 95 98 99
59 96
Fronkre1ch - Saarland (a) 1957 103 103 106 114 107
France - Sarre 58 118 119 ll8 115 117
59 117
I
.
Ito lien - ltalie 1957 1C5 107 107 106 114 109 122 ll3 105 111 105 103 lOB
58 llO 108 104 ll4 105 105 llO 101 101 105 101 97 103 59
Niederlande - Pays-Bas 1957 104 104 103 105 105 108 106 107 106 106 105 104 105
58 103 103 104 104 103 101 100 100 99 100 100 103 102 59 101 100 101
24. lnd"x der "terms of trade" 1a1 24. lndice des termes de l'echange 1 a1
1953 = 100
Februar Mar~ April Johr Januar
Land - Payo
An Me Janvier Fevrier Mars Avril
Oeullchlond
- A
"•""'It•
1957 99 98 99 100(BRl (R ) 58 106 107 105 108
59 109 109 111
Belgien - Luxemb..,g 1957 103 102 10:1 101
Belgique - Luxemhourg 58 110 106 107 105
59 103
FrankNich .. Saarland (b) 1957 94
France ... Sa,. 58 100
59 100
Ita lien - ltalle 1957 94 100 94 94
58 102 102 101 108 59
Niederlande - Pays-Bas 1957 99 97 96 95
58 99 100 102 101 59 102 101 102
(a) Index der Ausfuhrdurchschn1ttswerte divid1ert durch Index der E1nfuhrdurchschnittswerte
(b) Vierte1jahreszah1en
Monat•·
Mai Juni Jul1 August Septembe Oktobor November Oe1ember sc..,itt durch~
Mai Juin Juillet A oUt Septembre Octo&re Novembre oecembre Moyenne , . , sue lie
98 100 98 99 102 102 103 103 100 107 107 109 111 110 109 110 110 108
104 106 104 104 104 107 107 106 104 103 105 104 104 103 103 103 105 105
96 96 95 96
102 100 99 100
102 100 111 104 100 103 98 97 99 100 102 105 101 101 104 97 94 100
95 98 97 98 98 100 101 100 98 101 99 100 100 99 ·101 101 105 101
(a) Indice de 1a valeur moyenne des exportat1ons di¥ise
par l'1nd1ce de la valeur moyenne des 1mportat1ons (b) Chiffres trimestriels
25. Steuerei nnahmen des Staates 25. Recettes fiscales de I'Etat
(in natlonaler Wahrung) (en monnale nationale)
M,onots-
durch-Pays E1nhe1t Jahr Jonuar Februor MOrz A.pnl Mao Jun1 Jul1 August September Oktober November Dezember schn1tt Land
-u"''e
Anmie Janvrer Fevner Mars Avn/ Mao Juin Julllet A oUt Septembre Octobre Novembre oecembre Moyennemensue/Je
r
Deutschland (BR) - Allemagne (RF)(a) Moo DM 1957 3.518 2.508 4.188 2.670 2. 821 4.377 2.874 2. 874 4.452 2. 853 2. 924 4. 865 3.41058 3.322 2.575 4.416 2.694 2.768 4.659 2.969 3.026 4.766 3. 250 3.245 5,194 3.574 59 3.763 2.745 4.707
Saarland - Sarre Mrd FF 1957 5,1 3,4 5,7 10,< 4,5 12 ,( 5 ,( 4.4 6.4 10,5 5, 7 9,1 6,8
58 4.7 4,4 6,2 12 ,( 8,2 7.2 12,0 11,9 6,5 5, ~ 12,3 5 ,' 8,0
59 6,1 11,£
Belgien - Belgique M1o FB 1957 9.616 6.310 6.685 6.549 7.359 8.153 10.414 6.312 7.020 6.592 6.980 7.306 7.441 58 10.014 6.479 6.586 6.716 7.120 7.448 9.857 6.340 7.485 6.899 6.ll0 6.790 7.320
59 10.526 6.202 6.764
Frankreich - France Mrd FF 1957 261 316 277 300 363 299 262 240 296 296 329 ,107 304
58 325 403 360 414 364 348 315 283 407 423 324
59
Ita hen - ltalie Mrd L~re 1957 222 228 207 223 246 255 223 227 215 225 225 214 226
58 246 248 227 242 246 272 245 247 234 238 232 229 242 59 269 262
Luxemburg - L uxemboorg M1o FB 1957 332 204 1>53 303 324 483 368 367 540 313 230 556 373
58 371 190 507 355 321 460 351 291 387 354 259 450 358 59 301 249 369
Niederlande - Pays-Bas Mto Fl 1957 682 542 563 518 589 550 693 700 804 1.229 570 612 671
58 679 476 547 519 531 561 646 599 748 1.161 539 680 641 59 663 515 522
26. Bestand an Spa rei nlagen
26. Situation des depots d'epargne
(m nationaler Wahrung) (en monnale nat1onale)
M~nots- durch-Land - Pays Emhe1t Jahr Jonuor Februar Marz April Moi Juni Juli August September Oktober November Dezember schnitt
u"''e
Anmfe Janv1er Fevrier Mars Avrtl Mo1 Juin JvWet A oUt Septembre Octobre Novemh"' 08cembre Moyennemensuelle
Deutschland - Allemogne Mrd OM 1957
I
24,9 25,3 25,8 26,0 26,3 26,6 26,' 27 ,c 27,4 27,9 28,2 29,4 26,8(BR) (RF) 58 30,2 30,8 31,3 31,8 32,2 32,6 33, 33,5 34,0 34,7 34,9 36,1 32,9
59 37' 1 37,8 38,3
Saarland - Sarre Mrd FF 1957 52' 1 53,5 54,0 54,6 54,8 54,8 54'! 52,4 52,4 51,5 50,4 51.4 53,1
58 51,7 53;( 53,9 55;o 55,2 55,2 56
,c
57,7 58,8 60,1 60,7 63,8 56,8,
59 65,1 67,3
Belg1en - Belgique (a) Mrd FB 1957 57' 1 57,5 57,6 57,5 57' 7 57,8 58,2 58,6 58,7 58,5 58,5 58,5 58,0 58 60,8 61,1 61,2 61,4 61,6 61;s 62;5 s2;s 63,3 63,8 64,3 64,7 62,5 59 67,7 68,3 68,6
Fronkreich - France Mrd FF 1957 1,785 1.807 1,820 1,831 1.833 1.830 1,839 1. 856 1,860 1.859 1.870 1.872 1.839
58 1,962 1.988 2.012 2.032 2,021 2.027 2.052 2,086 2,099 2.116 2.134 2,165 2,058
59 2.276 2.295 2.313
ltalien - ltal1e Mrd Lire 1957 4.439 4.469 4.494 4.514 4.544 4,556 4,598 4.645 4,677 4. 703 4. 739 4,949 4,611
58 5,034 5.078 5,131 5,170 5,201 5,223 5.283 5,343 5,389 5,436 5.497 5.701 5,291 59 5,790
Luxemburg - Luxembourg M>o FB 1957 •
.
5.271 •.
5,342 •.
5,400.
• 5,42" 5,35958
.
.
5,523.
• 5,587.
• 5,680 •.
5.794 5.64659
•
•
5,989Niederlande - Pays-Bas Moo Fl 1957 6.440 6,481 6,468 6.445 6.478 6.499 6,539 6.581 6,586 6.561 6.503 6.645 6.5T!J
58 6,663 6.722 6. 783 6,788 6,850 6,898 6,982 7,076 7.134 7.183 7.259 7.536 6.990 59 7.664 7.775 7.825