This is a repository copy of
Fundamentals of optimum performance-based design for
dynamic excitations
.
White Rose Research Online URL for this paper:
http://eprints.whiterose.ac.uk/92728/
Version: Accepted Version
Article:
Moghaddam, H. and Hajirasouliha, I. (2005) Fundamentals of optimum
performance-based design for dynamic excitations. Scientia Iranica, 12 (4). 368 - 378.
ISSN 1026-3098
[email protected] https://eprints.whiterose.ac.uk/ Reuse
Unless indicated otherwise, fulltext items are protected by copyright with all rights reserved. The copyright exception in section 29 of the Copyright, Designs and Patents Act 1988 allows the making of a single copy solely for the purpose of non-commercial research or private study within the limits of fair dealing. The publisher or other rights-holder may allow further reproduction and re-use of this version - refer to the White Rose Research Online record for this item. Where records identify the publisher as the copyright holder, users can verify any specific terms of use on the publisher’s website.
Takedown
If you consider content in White Rose Research Online to be in breach of UK law, please notify us by
Moghaddam, H. and Hajirasouliha, I. (2005) Fundamentals of optimum performance-based design for
dynamic excitations. Scientia Iranica, 12 (4). 368 - 378.
Fundamentals of Optimum Performance-Based Design for Dynamic
Excitations
H. Moghaddam and I. Hajirasouliha
Department of Civil Engineering, Sharif University of Technology, Tehran, Iran
ABSTRACT: This paper presents a new method for optimization of dynamic response of structures subjected to seismic excitation. This method is based on the concept of uniform
distribution of deformation. In order to obtain the optimum distribution of structural properties,
an iterative optimization procedure has been adopted. In this approach, the structural
properties are modified so that inefficient material is gradually shifted from strong to weak
areas of a structure. This process is continued until a state of uniform deformation is
achieved. It is shown that in general for a MDOF structure there exists a specific pattern for distribution of structural properties that results in an optimum seismic performance. It has
been shown that the seismic performance of such a structure is optimal, and behaves
generally better than those designed by conventional methods. The application of the
proposed method for optimum seismic design of different structural forms such as truss-like
structures and shear-buildings is presented. Effects of fundamental period, target ductility
demand, damping ratio and seismic excitations on optimum distribution pattern are
investigated.
Keywords: optimal strength pattern, performance-based design, seismic loading, Ductility, optimum seismic performance
INTRODUCTION
Seismic design is currently based on force rather than displacement, essentially as a
consequence of the historical developments of an understanding of structural dynamics and,
more specifically, of the response of structures to seismic actions and the progressive
modifications and improvement of seismic codes worldwide. Consequently, the seismic
procedures have become more rigorous in their application, this basic force-based approach
has not changed significantly since its inception in the early 1900s. Use of forces as a design
basis has remained more a matter of convenience than a representation of actual behavior
during earthquakes. Many structures have apparently survived earthquakes capable of
inducing inertia forces many times larger than those corresponding to their structural
strength, if a linear response was assumed. The concept of ductility has then been
introduced to reconcile this apparent inconsistency, and account for the anomaly survival
with inadequate strength through nonlinear response. Subsequently, much research efforts
have been directed to determining the available capacity of different structural systems,
performing extensive experimental and analytical studies to determine their safe deformation
capacity. This may be regarded as a more appreciation of the importance of deformation, as
opposed to strength, in seismic design.
Indeed, a review of the history of seismic design indicates that initially design was purely
based on strength, or force consideration. As the importance of deformation has come to
better appreciation, the approach has been to attempt to modify the existing force based
approach to include consideration of deformation, rather than to rework the procedure on
more rational basis.
In the conventional seismic design, the pattern for distribution of structural properties such
as strength, stiffness, and damping in a preliminary design is normally based on the
presumption that the structure vibrates within its linear-elastic range [1]. Recent design
guidelines, such as FEMA 356 [2] and SEAOC Vision 2000 [3], place limits on acceptable
values of response parameters, implying that exceeding of these acceptable values
represent violation of a performance objective. Further modifications to the preliminary
design, aiming to satisfy the Performance Objectives could lead to some alterations of the
original distribution pattern of structural properties. As structures exceed their elastic limits in
severe earthquakes, the use of inertia forces corresponding to elastic modes may not lead to
the optimum distribution of structural properties. This issue has been viewed by researchers
from different angles.
Many experimental and analytical studies have been carried out to investigate the validity of
the distribution of lateral forces according to seismic codes. Lee and Goel [4] analyzed a
series of 2 to 20 story frame models subjected to various earthquake excitations. They
showed that in general there is a discrepancy between the earthquake induced shear forces
and the forces determined by assuming distribution patterns. The consequences of using the
code patterns on seismic performance have been investigated during the last decade [5, 6,
7]. Chopra [8] evaluated the ductility demands of several shear building models subjected to
the El- Centro Earthquake of 1940. The relative story yield strength of these models was
Uniform Building Code[9]. It was concluded that this distribution pattern does not lead to
equal ductility demand in all stories, and that in most cases the ductility demand in the first
story is the largest of all stories. The first author [10, 11] proportioned the relative story yield
strength of a number of shear building models in accordance with some arbitrarily chosen
distribution patterns as well as the distribution pattern suggested by the UBC1997[9]. It is
concluded that: (a) the pattern suggested by the code does not lead to a uniform distribution
of ductility, and (b) a rather uniform distribution of ductility with a relatively smaller maximum
ductility demand can be obtained from other patterns. These findings have been confirmed
by further investigations [12, 13], and led to the development of a new concept: optimum
distribution pattern for seismic performance that is discussed in this paper.
CONCEPT OF OPTIMIZATION FOR DYNAMIC EXCITATION
• Background
As discussed before, for decades seismic codes have regarded the seismic effects as lateral
inertia forces. Consequently, in almost all optimization approaches developed for seismic
design, the forces are regarded as static with a pre-assumed pattern of distribution such as
triangular. In effect, these approaches are similar to the conventional optimization methods
for design of structures subjected to static loadings. It is generally endeavored to induce a
status of uniform deformation throughout the structure to obtain an optimum design as in
Gantes et al. [14]. In an attempt for developing an optimization method for seismic design of
steel frames, Gong et al. [15] used a set of story drift limits as performance objectives, and
considered the seismic effects as static forces with parabolic distribution. From their results it
can by concluded that the structural weight decreases as the deformation approaches to a
uniform status. It should be noted that although in this procedure the effect of nonlinear
behavior is considered, the seismic effects are regarded as external static forces rather than
induced deformation. Therefore, the procedure is still remains similar to the conventional
optimum design methods.
Some researchers have attempted to consider the effect of dynamic nature of seismic
forces. Lee and Goel [4] proposed a design procedure using predefined performance
targets. The procedure is based on minimizing the difference between the earthquake
induced shear forces and the forces used for seismic design. Although within the linear
range this concept seems to have a rather rational basis, the use of shear forces as a means
of assessing the adequacy of design looses its weight in nonlinear ranges of vibration.
In his early attempts to establish and apply the performance-based method for seismic
design of structures in late 1980's, the first author recognized the fact that several
acceptable solutions could be obtained for a given set of objective targets such as ductility
buildings subjected to seismic excitations [10, 11]. These early studies demonstrated that a
conventional seismic design does not lead to a uniform distribution of ductility. Further
investigations [12, 13], suggested that we need to move towards a rather uniform distribution
of ductility in order to reduce the ductility demand. Afterwards extensive studies have been
conducted to highlight and establish a rational basis for this concept [16]. Indeed, in spite of
those who assume the concept of uniform deformation as a performance objective, the
authors are using it as a means for obtaining an optimum design. In the following, it has
been attempted to substantiate the concept of uniform deformation and its application in
optimum design for seismic excitation.
• Inefficient Material
As discussed before, the use of distribution patterns for lateral seismic forces suggested by
codes do not guarantee the optimum performance of structures. The current studies indicate
that during strong earthquakes the deformation demand in structure does not vary uniformly.
For instance, the steel frame shown in Figure 1 is designed in accordance with UBC1997[9] and subjected to the Northridge earthquake of 1994 (CNP196). Non-linear dynamic analysis
is conducted using the computer program DRAIN-2DX [17]. It is illustrated in Figure1 that deformation demand is not distributed uniformly. On the other hand, the maximum inter-story
drift occurs almost at the top, and it decreases downward. Hence, it can be concluded that in
some parts of the structure, the deformation demand does not reach the maximum level, and
therefore, the capacity of the material is not fully exploited.
• Principle of Strength-Deformation Reciprocal Relation
Early studies on shear building models have proved that it is possible to improve the
performance of a model by shifting the material from strong to weak parts [12, 13, 16]. This
results in a uniform distribution of deformation, and reduces the maximum deformation
demand. The coincidence of uniform distribution of deformation with better seismic
performance can be explained by the principle of strength-deformation reciprocal relation.
The effect of variation of strength on seismic performance has been studied extensively [18,
19]. These studies have lead to development of numerous strength- ductility (R-µ)
relationships. Figure 2 shows a typical R-µ-T relationship. R is inversely proportional to strength. In this figure, three types of structures have been modeled. ST1 and ST2 represent
low and high period structures, respectively. In these models, it is assumed that stiffness
remains unchanged as strength varies. ST3 represents structures in which any decrease in
strength is accompanied by a decrease in stiffness. This figure indicates that generally µ
increases as strength decreases. It should be noted that in some exceptional cases this
principle may be violated in low period range of ST3 type in which a decrease in strength is
Figure 2). Investigations have indicated that this rule is also applicable for MDOF systems [12].
• Theory of Uniform Deformation
Consider the mentioned structure of Figure 1 in which the distribution of deformation is not uniform. If maximum story drift is taken as the failure criterion, the results indicate that only
some parts of the structure have failed. On the other hand, the deformation in the remaining
parts is less than the maximum allowable limit. The Strength-Deformation Reciprocal
Relation suggests that if the strength in these parts decreased, the deformation would
increase. Hence, if the strength is decreased incrementally, we should eventually obtain a
state of uniform deformation. At this point the material capacity is fully exploited. As any
decrease in strength is normally accompanied by a decrease of material, a structure
becomes lighter as deformation is distributed more uniformly as compared with a structure
with non-uniform deformation. Therefore, in general it may be concluded that we need to
reach the status of uniform deformation for optimum use of material. This is denoted as the
Theory of Uniform Deformation.
OPTIMUM SEISMIC DESING OF TRUSS-LIKE STRUCTURES
The Theory of Uniform Deformation is examined by a conceptual example shown in Figure 3. The objective is to design a truss-like structure for sustaining four masses M1 to M4 by using any number of stud members connecting these masses to each other and to the
supports A to E. This structure should not exceed a member ductility demand of 4 when
subjected to the horizontal component of the Northridge Earthquake of 1994 (CNP196). A
Rayleigh damping of 5% is assumed. No weight is considered for the masses and only the
seismic forces are considered. Masses M1 to M4 are assumed to be 20, 5, 10, and 5 tons,
respectively. Computer program Drain-2DX [17] is used for nonlinear dynamic analyses. At
the starting point, a very general arrangement is chosen by considering all possible
connections as shown in Figure 4. In the first step, an identical area of cross section of 1 cm2 is assumed for all members. It is also assumed that the strength of each member is
equal to (Afy) in both tension and compression. The structure is subjected to the seismic
excitation, and the ductility demand is calculated for all members. Subsequently, the area of
cross section of all members is scaled until the maximum ductility demand reaches the
target level of 4.
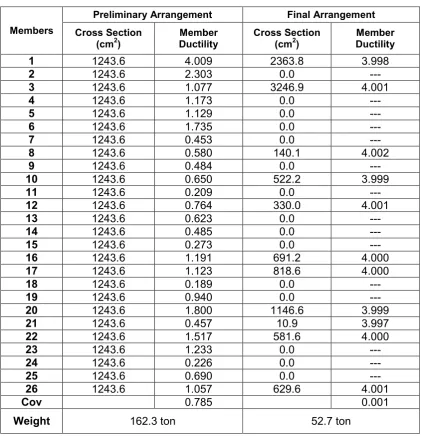
The distribution of material and ductility demand at this stage is shown in Table 1. These
results indicate that some members undergo much less deformation than others. This
Considering the Theory of Uniform Deformation, it should be attempted to move towards a uniform ductility distribution demand to obtain a lighter structure. To accomplish this, the
following optimization procedure is employed:
1. An arbitrary primary pattern is assumed for the distribution of structural properties that
control the response of structure (such as strength, stiffness, and damping). Here, the
cross section area is the only controlling parameter. Hence, as mentioned before, a
uniform pattern is chosen.
2. The structure is subjected to the excitation, and the maximum deformation is calculated,
and compared with the target value. The structural properties are then scaled, without
changing the primary pattern, until the maximum deformation demand reaches the target
value. This pattern is regarded as a feasible answer, and referred to as the first
acceptable pattern. For the above example, member ductility represents the deformation
demand, and the results of the first and the final steps are presented in Table 1.
3. The coefficient of variation (cov) of deformation distribution within the structure is calculated. If the cov is considered to be small enough, we can stop, and consider the pattern as practically optimum. Otherwise the analysis continues. The cov of the first
acceptable pattern was determined as 0.785. It is decided that the cov is high, and the analysis should continue.
4. At this stage the distribution pattern of structural properties is modified. Using the Theory of Uniform Deformation, the inefficient material is reduced until an optimum structure is obtained. To accomplish this, the positions where the deformation is less than the target
value are identified, and the material is reduced accordingly. Experience has shown that
this alteration should be applied incrementally in order to achieve convergence in the
numerical calculations. Hence, the following equation is used in the present studies: α
=
+ ti i n i sc n i scd
d
p
p
)
]
[(
)
]
[(
1(1)
Where di and dti are demand and target deformations at position i. (Psc)i is the structural
control parameter, relating to position i. n denotes the step number. α is the convergence
coefficient ranging from 0 to 1. For the above example, an acceptable convergence was
obtained for a value of α=0.2. Considering the cross-section area, Ai, as the structural control
parameter and member ductility, µi , as the deformation demand and substituting 4 as the
target deformation for all members, the following equation is obtained:
2 . 0 1
4
]
)
[(
]
)
[(
=
+ i n i
n
i
A
Using these modified cross sections; the procedure is repeated from step 2, until a new
feasible pattern is obtained. It is expected that the cov of deformation distribution for the new pattern is smaller than the corresponding cov for the previous pattern. This procedure is iterated until cov becomes small enough, and a status of rather uniform deformation prevails. Starting from a cov of 0.785, we reach a cov of 0.001 at the final step.
A comparison of the results of primary and final steps in Table 1 illustrates that member
ductility demands in the final step have become remarkably uniform and the weight of total
material has decreased from 162.3 ton to 52.7 ton. The method has been able to recognize
and eliminate the redundant and inefficient members. Out of 26 members in the primary
arrangement in Figure 4 only 11 members remain in the final step as shown in Figure 5.
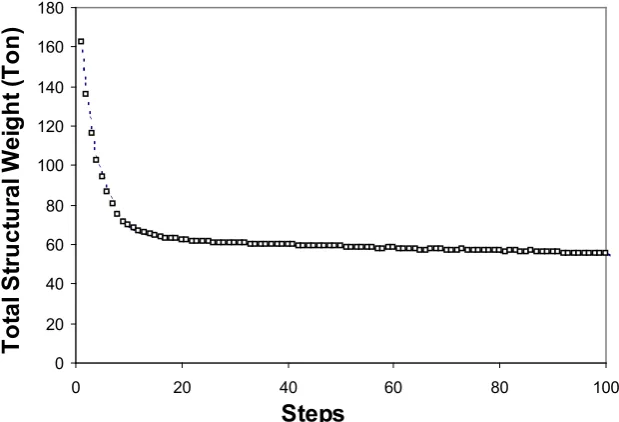
Figure 6 demonstrates the variation of total structural weight from the first feasible answer toward the final one. It is shown in this figure that total structural weight is decreased up to
50% in seven steps. It can be concluded that the proposed method has good convergence
to the optimum solution.
• Target Ductility Demand
The optimization algorithm was conducted on previous example for different values of target
ductility demands. Optimal topology corresponds to target ductility demands of 4, 6 and 8 are
compared in Figure 7. It is shown in this figure that optimal topology depends on target ductility demand, and therefore, a fixed topology cannot be appropriate for all the case. It can
be concluded that conventional optimization methods witch are usually based on elastic
vibration modes; are not appropriate for structures in nonlinear range of behavior. The
proposed method can optimize the design for all types of performance objectives such as
deformation, acceleration and velocity. Authors are not aware of any similar studies, capable
of optimizing the nonlinear dynamic response of structures for a given set of performance
objectives.
OPTIMUM SEISMIC DESIGN OF SHEAR BUILDINGS
The Theory of Uniform Deformation can be easily adapted for evaluation of optimum patterns for shear buildings. To obtain such optimum patterns, in principle, the steps
mentioned in the previous section are followed with some modifications. It should be noted
that there is a unique relation between the distribution pattern of lateral seismic forces and
the distribution of strength (as the strength at each floor is obtained from the corresponding
story shear force). Hence, for shear buildings, we can determine the optimum pattern for
distribution of seismic lateral loads instead of distribution of strength. Let us assume that we
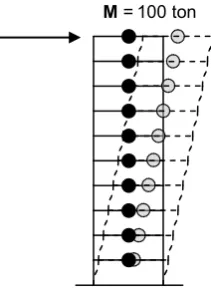
want to evaluate the most appropriate lateral loading pattern to design a 10-story shear
building with a fundamental period of 1 sec, so that it can sustain the Northridge earthquake
model, each floor is considered as a lumped mass and the total mass of the structure is
distributed uniformly over its height as shown in Figure 8. The Rayleigh damping is adopted with a constant damping ratio 0.05 for the first few effective modes and non-linear dynamic
analyses are conducted utilizing the computer program DRAIN-2DX [17]. Considering the
Theory of Uniform Deformation, the following optimization procedure is used:
1. 1. Arbitrary patterns for primary height-wise distribution of strength and stiffness are
considered. However, for shear buildings it is assumed that these two patterns are
similar, and therefore, an identical pattern is assumed for both strength and stiffness.
Here, the uniform pattern of Figure 8 is chosen for the primary distribution of strength and stiffness.
2. The stiffness pattern is scaled so as to attain a fundamental period of 1 sec.
3. Maximum ductility demand is calculated by performing nonlinear dynamic analysis for
the given exaction. Subsequently, the strength is scaled (without changing the primary
pattern) until the maximum deformation demand gets to a target value of 4. The resulting
pattern is a feasible solution and can be considered as the first acceptable pattern. The
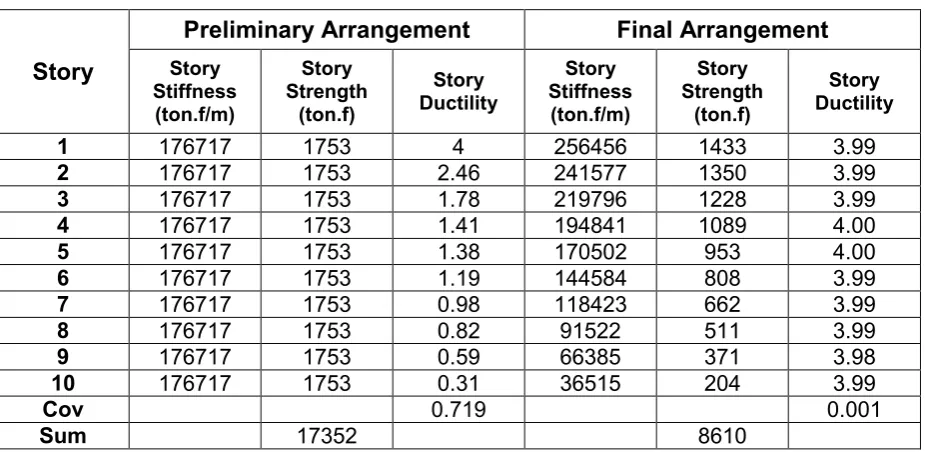
first and final steps are illustrated in Table2.
4. The cov (coefficient of variation) of story ductility distribution is determined. The procedure continues until cov decreases down to an acceptable level. For the first feasible pattern, the cov was determined as 0.719. The cove is considered to be high, and the analysis continues.
5. Considering the Theory of Uniform Deformation, the distribution pattern is modified. To achieve this, the stories where the ductility demand is less than the target values are
identified, and weakened by reducing the strength and stiffness. Similar to Equation 1,
the following equation is used for the good convergence:
(3)
Where
µ′
i is ductility demand at ith story, andµ′
ti is the target ductility assumed as equal to4 for all stories. Vi is the shear strength of the ith story. n denotes the step number. α is the
convergence coefficient ranging from 0 to 1. For the above example, an acceptable
convergence has been obtained for a value α=0.1. At this stage, a new pattern for height
wise distribution of strength is obtained. As mentioned before, the same pattern is used for
height wise distribution of stiffness. Now the procedure is repeated from step 2, until a new
feasible pattern is obtained. It is expected that the cov of ductility distribution for this pattern is smaller than the corresponding cov for the previous pattern. This procedure is iterated until cov becomes small enough, and a rather uniform ductility demand is achieved. The
α
µ
µ
′
′
=
+ ti i n i n iV
V
]
[
]
story ductility patterns for preliminary and final designs are compared in Figure 9. This figure indicates the efficiency of this method to reach the status of uniform ductility demand.
Table 2 illustrates the results of analysis for the first and final step. Figure 10 demonstrates the variation of cov and the total strength from the first feasible pattern toward the final one. It can be concluded that the proposed method has a good capability for converging to the
optimum solution. As shown in Figure 10, the total strength decreases up to 40% in five steps. The figure also indicates that the decrease in cov is accompanied by a decrease in total strength. Here the total strength is in proportion to the total weight of the seismic
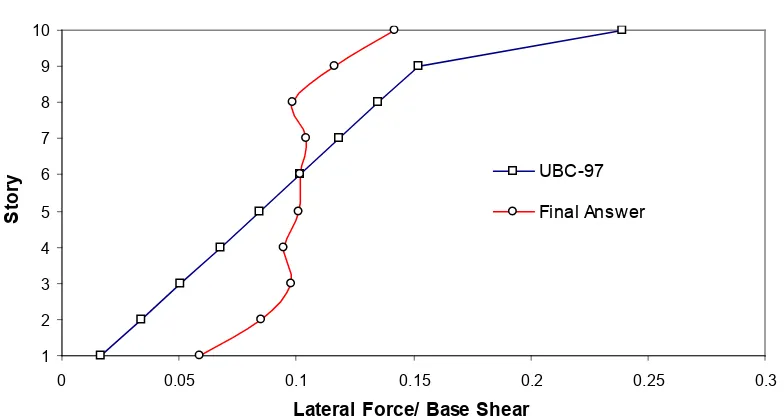
resisting system. These results are in agreement with the Theory of Uniform Deformation. The height wise distribution of strength can be converted to the distribution of lateral forces.
Such pattern may be regarded as the optimum pattern of seismic forces for the given
earthquake. As shown in Figure 11, this would enable us to compare this optimum pattern with the conventional lateral load distribution suggested by codes for seismic design.
• Initial Load Pattern
As described before, an initial strength distribution is necessary to begin the optimization
algorithm. In order to investigate the effect of this initial load (or strength) pattern on the final
result, for the previous example four different initial load patterns have been assumed:
1) A concentrated load on the roof level
2) Triangular distribution similar to the UBC code of 1997 [9]
3) Rectangular distribution
4) An inverted triangular distribution with the maximum lateral load on the first floor and the
minimum lateral load at the roof level
For each case, the optimum lateral load pattern was derived for Northridge 1994 (CNP196)
event. The comparison of the optimum lateral load pattern for each case is depicted in
Figure 12. As is shown in this figure, the optimum lateral force pattern is not dependent on the initial strength pattern. However, the convergence speed of the algorithm is to some
extent dependant on this initial pattern. This conclusion has been confirmed by analysis of
additional shear buildings and ground motions.
• Seismic Excitation
To investigate whether or not these findings are dependant on the selected seismic
excitation, the following seismic records are also applied to the foregoing 10-storey shear
building model: (1) The 1994 Northridge earthquake CNP196 component with a PGA of
0.42g, (2) The 1979 Imperial Valley earthquake H-E08140 component with a PGA of 0.45g,
(3) The 1992 Cape Mendocino earthquake PET090 component with a PGA of 0.66g, and (4)
A synthetic earthquake record generated to have a target spectrum close to that of the
All of these excitations correspond to the sites of soil profiles similar to the SD type of UBC.
Subsequently, the optimum strength-distribution patterns corresponding to these excitations
are determined. In Figure 13, total strength demand for optimum structures are compared with does designed according to seismic load pattern suggested by the UBC1997 [9]. The
figure indicates that for the same ductility demand, the optimum design requires less
strength as compared with the conventional design.
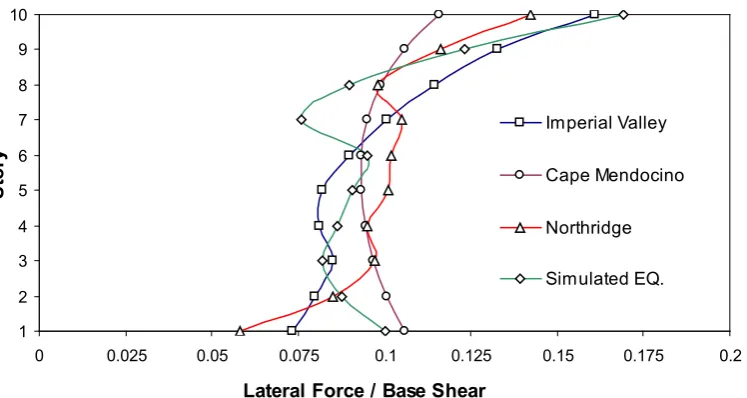
The optimum lateral load patterns correspond to each case are presented in Figure 14. It is shown in this figure that every seismic excitation has a unique optimum distribution of
structural properties. The optimum pattern depends on the earthquake and it varies from one
earthquake to another. Therefore, a fixed pattern cannot be appropriate for all the case and
it must be related to the earthquake and structural characteristics. However, Figure 14
shows that there is not a big discrepancy between different optimum load patterns
correspond to the seismic excitations with similar soil profiles.
• Target Ductility Demand
In order to study the effect of target ductility demand on optimum distribution pattern, 10
story shear- building models with fundamental period of 1 sec and target ductility of 1.5, 4, 6
and 8 have been considered. Optimum lateral load pattern was derived for each model
subjected to Northridge 1994 (CNP196) event. Comparing the results, the effect of target
ductility demand on optimum distribution of seismic loads is illustrated in Figure 15. The results indicate that optimum distribution is highly dependent on target ductility demand of
the structure. Hence, using conventional lateral load patterns witch are based implicitly on
the elastic vibration modes, may not lead to the optimum distribution of structural properties.
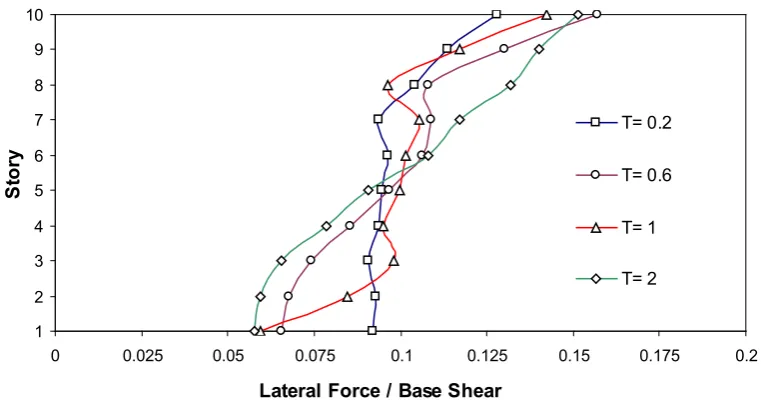
• Fundamental Period
To investigate the effect of fundamental period on the optimum distribution pattern, 10 story
shear-building models with target ductility demand of 4 and fundamental periods of 0.2, 0.6,
1 and 2 sec have been assumed. For each case, the optimum lateral load pattern was
derived for Northridge 1994 (CNP196) event. The comparison of the optimum lateral load
pattern for each case is presented in Figure 16. As shown in this figure, optimum distribution of seismic loads is a function of fundamental period of the structure.
• Damping Ratio
The effect of damping ratio on optimum load distribution pattern is illustrated in Figure 17 for a 10 story shear-building model with target ductility demand of 4 and fundamental period of 1
sec; subjected to the Northridge earthquake of 1994 (CNP196). As shown in this figure,
earthquake forces correspond to the top floors decrease with an increase in damping ratio.
This can be easily explained; higher mode effects mainly affect top floor forces and
damping ratios greater than 3%. Hence, for practical purposes, optimum load pattern can be
considered independent of the damping ratio.
CONCLUSION
1. This paper presents a new method for optimization of dynamic response of structures
subjected to seismic excitation. This method is based on the concept of uniform
distribution of deformation.
2. It is shown that using the strength pattern suggested by seismic codes does not lead to
a uniform distribution of deformation demand, and, it is possible to obtain uniform
deformation by shifting the material from strong to weak parts. It has been shown that
the seismic performance of such structure is optimal. Hence, it can be concluded that
the condition of uniform deformation results in optimum use of material. This has been
denoted as the Theory of Uniform Deformation.
3. By introducing an iterative method, Theory of Uniform Deformation has been adapted for topology optimization in seismic design of truss-like structures. It is shown that this
method can reduce the required structural weight by eliminating the redundant and
inefficient members. The effect of target ductility demand on optimal topology is
investigated.
4. With some modifications, Theory of Uniform Deformation has been adapted for optimum seismic design of shear buildings. It is concluded that this can efficiently provide an
optimum design.
5. It has been demonstrated that there is generally a unique optimum distribution of
structural properties, which is independent of the seismic load pattern used for initial
design.
6. The effects of fundamental period, target ductility demand, damping ratio and seismic
excitation on optimum distribution of seismic loads have been studied.
REFRENCES
1- Green, N. B., Earthquake resistant building design and construction, 2nd Edition, Van Nostrand
Reinhold Company, New York, 1981.
2- FEMA 356, Prestandard and commentary for the seismic rehabilitation of buildings.
Washington, DC: Federal Emergency Management Agency, 2000.
3- SEAOC. Vision 2000, performance based seismic engineering for buildings. Sacramento, CA:
Structural Engineers Association of California, 1995.
4- Lee, S.S. and Goel, S.C. “Performance based seismic design of structures using target drift
and yield mechanism”, U.S Japan Seminar on Advanced Stability and Seismicity Concept for
5- Martinelli, L., Perotti, F. and Bozzi, A., "Seismic design and response of a 14-story
concentrically braced steel building", Behavior of Steel Structures in Seismic Areas, pp 327-335,
2000.
6- Anderson, J.C., Miranda, E., Bertero, V.V. and Kajima Research Team, “Evaluation of the
seismic performance of a thirty-story RC building”, UCB/EERC-91/16, Berkeley: Earthquake
Engineering Research Center, University of California, July 1991.
7- Gilmore, T.A. and Bertero, V.V. “Seismic performance of a 30-story building located on soft
soil and designed according to UBC 1991”, UCB/EERC-93/04, Berkeley: Earthquake
Engineering Research Center, University of California, Feb. 1993.
8- Chopra, A. K., Dynamics of structures: theory and applications to earthquake engineering, 2nd
Edition, Prentice Hall Inc., London, 2001.
9- UBC. Structural engineering design provisions. In: Uniform Building Code. International
Conference of Building Officials, vol. 2. 1997.
10- Moghaddam, H., Earthquake Engineering, RTRC Publications, 1st Edition, Tehran, 1995 (in
Farsi).
11- Moghaddam, H. and Esmailzadeh Hakimi, B. “On the optimum seismic loading of multistory
structures”, 3rd International Conference on seismology and earthquake engineering, Tehran,
Iran, pp.669-676, 1999.
12- Moghaddam, H. and Karami, R. “Towards a more efficient seismic loading for MDOF
Structures”, Accepted for ASCE Journal of Structural Engineeringin October 2003.
13- Karami, R. “Effects of shear strength distribution on the reduction of seismic damage of
structures”, Thesis presented to Sharif University of Technology, in partial fulfillment of the
requirements for the degree of Doctor of Philosophy, Tehran, Iran, 2001.
14- Gantes, C.J., Vayas, I. And Spiliopoulos, A. “Optimum Bending and Shear Stiffness
Distribution for Performance Based Design of Rigid and Braced Multy-Story Steel Frames”,
Behavior of Steel Structures in Seismic Areas, pp 585-592, 2000.
15- Gong, Y., Grierson, D.E. and Xu, L. “Optimal Design of Steel Building Frameworks Under
Seismic Loading”, Response of Structures to Extreme Loading (XL2003), Canada, Toronto,
2003.
16- Moghaddam, H., Hajirasouliha, I. and Doostan, A., “On the optimum strength distribution in
seismic design of structures”, Response of Structures to Extreme Loading (XL2003), Canada,
Toronto, 2003.
17- Prakash, V., Powell, G.H., and Filippou, F.C. “DRAIN-2DX: Base program user guide,”
Report No. UCB/SEMM-92/29, 1992.
18- Riddell, R., Hidalgo, P., Cruz, E., “Response modification factors for earthquake resistant
design of short period buildings”, Earthquake Spectra, Vol 5, No. 3, pp. 571-590, 1989.
19- Vidic, T, Fajfar, P, and Fischinger, M., ”Consistent inelastic design spectra: strength and
Table 1.
The preliminary and final arrangement of members
Members
Preliminary Arrangement Final Arrangement Cross Section
(cm2)
Member Ductility
Cross Section (cm2)
Member Ductility
1 1243.6 4.009 2363.8 3.998
2 1243.6 2.303 0.0 ---
3 1243.6 1.077 3246.9 4.001
4 1243.6 1.173 0.0 ---
5 1243.6 1.129 0.0 ---
6 1243.6 1.735 0.0 ---
7 1243.6 0.453 0.0 ---
8 1243.6 0.580 140.1 4.002
9 1243.6 0.484 0.0 ---
10 1243.6 0.650 522.2 3.999
11 1243.6 0.209 0.0 ---
12 1243.6 0.764 330.0 4.001
13 1243.6 0.623 0.0 ---
14 1243.6 0.485 0.0 ---
15 1243.6 0.273 0.0 ---
16 1243.6 1.191 691.2 4.000
17 1243.6 1.123 818.6 4.000
18 1243.6 0.189 0.0 ---
19 1243.6 0.940 0.0 ---
20 1243.6 1.800 1146.6 3.999
21 1243.6 0.457 10.9 3.997
22 1243.6 1.517 581.6 4.000
23 1243.6 1.233 0.0 ---
24 1243.6 0.226 0.0 ---
25 1243.6 0.690 0.0 ---
26 1243.6 1.057 629.6 4.001
Cov 0.785 0.001
Table 2.
The preliminary and final arrangement of Strength and Stiffness
Story
Preliminary Arrangement
Final Arrangement
Story Stiffness (ton.f/m)
Story Strength
(ton.f)
Story Ductility
Story Stiffness (ton.f/m)
Story Strength
(ton.f)
Story Ductility
1 176717 1753 4 256456 1433 3.99
2 176717 1753 2.46 241577 1350 3.99
3 176717 1753 1.78 219796 1228 3.99
4 176717 1753 1.41 194841 1089 4.00
5 176717 1753 1.38 170502 953 4.00
6 176717 1753 1.19 144584 808 3.99
7 176717 1753 0.98 118423 662 3.99
8 176717 1753 0.82 91522 511 3.99
9 176717 1753 0.59 66385 371 3.98
10 176717 1753 0.31 36515 204 3.99
Cov 0.719 0.001
Figure 1.
Inter-story drift distribution for a 10 story steel frame subjected to
Northridge Earthquake 1994 (CNP196)
`
Figure 2.
Typical R-
µ−Τ
relationship
5 @ 6m = 30 m10 @
3m
=
3
0 m
1 2 3 4 5 6 7 8 9 10
0 2 4 6 8 10
Max Interstory Drift (cm)
S
to
ry
µ=2
µ=8
µ=4
R
T
ST1
ST3
ST2
[image:16.595.183.433.398.535.2]Figure 3.
The position of masses and supports
Figure 4.
Preliminary arrangement of members
Figure 5.
Final arrangement of members
A B C D E
M2
M4 M3 M1
4 @
2m
=
8m
2m 2m 2 @ 2m
[image:17.595.232.401.606.714.2]0 20 40 60 80 100 120 140 160 180
0 20 40 60 80 100
Steps
T
o
ta
l
S
tr
u
c
tu
ra
l
W
e
ig
h
t
(T
o
n
[image:18.595.145.455.84.295.2])
Figure 6.
Total structural weight for feasible answers
Figure 7.
Optimal topology for different target ductility demands
[image:18.595.100.515.465.600.2]Figure 8.
Primary load distribution pattern for the shear building
1 2 3 4 5 6 7 8 9 10
0 0.5 1 1.5 2 2.5 3 3.5 4 4.5
Story Ductility
S
to
ry
Preliminary Answer
Final Answer
Figure 9.
Primary and Final distribution pattern for story Ductility, 10 story shear
building with T=1 Sec and
µ
ti=4, Northridge 1994 (CNP196)
[image:19.595.117.479.394.593.2]0 200 400 600 800 1000 1200 1400 1600 1800 2000
1 2 3 4 5 6 7 8 9 10 11 12 13 14 15
[image:20.595.125.475.79.296.2]Steps 1 0 0 0 C o v & T o ta l S tr e n g th ( to n .f / 1 0 ) 1000 COV Total Strength
Figure 10.
Cov of story ductility factors and total story strength for feasible patterns,
10 story shear building with T=1 Sec and
µ
ti=4, Northridge 1994 (CNP196)
1 2 3 4 5 6 7 8 9 10
0 0.05 0.1 0.15 0.2 0.25 0.3
Lateral Force/ Base Shear
S
to
ry UBC-97
Final Answer
[image:20.595.102.494.465.675.2]1 2 3 4 5 6 7 8 9 10
0 0.02 0.04 0.06 0.08 0.1 0.12 0.14 0.16
Lateral Force/ Base Shear
S
to
ry
Concentrate Load
Triangular
Inverted Triangular
[image:21.595.111.495.90.282.2]Rectangular
Figure 12.
Optimum lateral force distribution for different initial load patterns, 10
story shear building with T=1 Sec and
µ
ti=4, Northridge 1994 (CNP196)
[image:21.595.100.501.381.624.2]1 2 3 4 5 6 7 8 9 10
0 0.025 0.05 0.075 0.1 0.125 0.15 0.175 0.2
Lateral Force / Base Shear
S
to
ry
Imperial Valley
Cape Mendocino
Northridge
[image:22.595.113.487.76.275.2]Simulated EQ.
Figure 14.
Optimum lateral force distribution for different earthquakes, 10 story
shear building with T=1 Sec and
µ
ti=4
1 2 3 4 5 6 7 8 9 10
0 0.025 0.05 0.075 0.1 0.125 0.15 0.175 0.2
Lateral Force / Base Shear
S
to
ry
µ= 1.5
µ= 2
µ= 4
µ= 8
[image:22.595.109.485.372.571.2]1 2 3 4 5 6 7 8 9 10
0 0.025 0.05 0.075 0.1 0.125 0.15 0.175 0.2
Lateral Force / Base Shear
S
to
ry
T= 0.2
T= 0.6
T= 1
[image:23.595.105.488.76.277.2]T= 2
Figure 16.
Optimum lateral force distribution for different fundamental period, 10
story shear building with
µ
ti=4, Northridge 1994 (CNP196)
1 2 3 4 5 6 7 8 9 10
0 0.025 0.05 0.075 0.1 0.125 0.15 0.175 0.2
Lateral Force / Base Shear
S
to
ry
ξ= 0 %
ξ= 3 %
ξ= 5 %
ξ= 10 %
[image:23.595.108.487.373.572.2]