promoting access to White Rose research papers
Universities of Leeds, Sheffield and York
http://eprints.whiterose.ac.uk/
White Rose Research Online URL for this paper:
http://eprints.whiterose.ac.uk/76447/
Paper:
Rakić, AD, Taimre, T, Bertling, K, Lim, YL, Dean, P, Indjin, D, Ikonic, Z, Harrison,
P, Valavanis, A, Khanna, SP, Lachab, M, Wilson, SJ, Linfield, EH and Davies,
AG (2013)
Swept-frequency feedback interferometry using terahertz frequency
QCLs: a method for imaging and materials analysis.
Optics Express, 21. 19.
22194 - 22205.
Swept-frequency feedback
interferometry using terahertz
frequency QCLs: a method for imaging
and materials analysis
Aleksandar D. Raki´c,1,∗Thomas Taimre,2Karl Bertling,1Yah Leng Lim,1Paul Dean,3Dragan Indjin,3Zoran Ikoni´c,3Paul Harrison,3
Alexander Valavanis,3Suraj P. Khanna,3Mohammad Lachab,3 Stephen J. Wilson,1Edmund H. Linfield,3and A. Giles Davies3
1School of Information Technology and Electrical Engineering, The University of Queensland, St. Lucia, QLD 4072, Australia
2School of Mathematics and Physics, The University of Queensland, St. Lucia, QLD 4072, Australia
3School of Electronic and Electrical Engineering, University of Leeds, Leeds LS2 9JT, UK
Abstract: The terahertz (THz) frequency quantum cascade laser (QCL) is a compact source of high-power radiation with a narrow intrinsic linewidth. As such, THz QCLs are extremely promising sources for applications including high-resolution spectroscopy, heterodyne detection, and coherent imaging. We exploit the remarkable phase-stability of THz QCLs to create a coherent swept-frequency delayed self-homodyning method for both imaging and materials analysis, using laser feedback interferometry. Using our scheme we obtain amplitude-like and phase-like images with minimal signal processing. We determine the physical relationship between the operating parameters of the laser under feedback and the complex refractive index of the target and demonstrate that this coherent detection method enables extraction of complex refractive indices with high accuracy. This establishes an ultimately compact and easy-to-implement THz imaging and materials analysis system, in which the local oscillator, mixer, and detector are all combined into a single laser.
© 2013 Optical Society of America
OCIS codes: (110.6795) Terahertz imaging; (120.3180) Interferometry; (140.5965) Semicon-ductor lasers, quantum cascade; (120.4530) Optical constants.
References and links
1. B. Hu and M. Nuss, “Imaging with terahertz waves,” Opt. Lett.20, 1716–1718 (1995).
2. W. L. Chan, J. Deibel, and D. M. Mittleman, “Imaging with terahertz radiation,” Rep. Prog. Phys.70, 1325 (2007).
3. A. G. Davies, A. D. Burnett, W. Fan, E. H. Linfield, and J. E. Cunningham, “Terahertz spectroscopy of explosives and drugs,” Mater. Today11, 18–26 (2008).
4. P. U. Jepsen, D. G. Cooke, and M. Koch, “Terahertz spectroscopy and imaging — Modern techniques and appli-cations,” Laser Photon. Rev.5, 124–166 (2011).
5. M. Tonouchi, “Cutting-edge terahertz technology,” Nature Photon.1, 97–105 (2007).
7. P. Han, M. Tani, M. Usami, S. Kono, R. Kersting, and X.-C. Zhang, “A direct comparison between terahertz time-domain spectroscopy and far-infrared fourier transform spectroscopy,” J. Appl. Phys.89, 2357–2359 (2001). 8. M. Naftaly, “Metrology issues and solutions in THz time-domain spectroscopy: Noise, errors, calibration,” IEEE
Sens. J.13, 8–17 (2013).
9. W. H. Fan, A. Burnett, P. C. Upadhya, J. Cunningham, E. H. Linfield, and A. G. Davies, “Far-infrared troscopic characterization of explosives for security applications using broadband terahertz time-domain spec-troscopy,” Appl. Spectrosc.61, 638–643 (2007).
10. X. Lu, N. Karpowicz, Y. Chen, and X.-C. Zhang, “Systematic study of broadband terahertz gas sensor,” Appl. Phys. Lett.93, 261106 (2008).
11. X. Zheng, C. V. McLaughlin, P. Cunningham, and L. M. Hayden, “Organic broadband terahertz sources and sensors,” J. Nanoelectron. Optoelectron.2, 58–76 (2007).
12. C. V. McLaughlin, L. M. Hayden, B. Polishak, S. Huang, J. Luo, T.-D. Kim, and A. K.-Y. Jen, “Wideband 15 THz response using organic electro-optic polymer emitter-sensor pairs at telecommunication wavelengths,” Appl. Phys. Lett.92, 151107 (2008).
13. L. Duvillaret, F. Garet, and J.-L. Coutaz, “A reliable method for extraction of material parameters in terahertz time-domain spectroscopy,” IEEE J. Sel. Top. Quantum Electron.2, 739–746 (1996).
14. N. Laman, S. S. Harsha, D. Grischkowsky, and J. S. Melinger, “7 GHz resolution waveguide THz spectroscopy of explosives related solids showing new features,” Opt. Express16, 4094–4105 (2008).
15. R. K¨ohler, A. Tredicucci, F. Beltram, H. E. Beere, E. H. Linfield, A. G. Davies, D. A. Ritchie, R. C. Iotti, and F. Rossi, “Terahertz semiconductor-heterostructure laser,” Nature417, 156–159 (2002).
16. M. S. Vitiello, L. Consolino, S. Bartalini, A. Taschin, A. Tredicucci, M. Inguscio, and P. De Natale, “Quantum-limited frequency fluctuations in a terahertz laser,” Nat. Photonics6, 525–528 (2012).
17. J. Darmo, V. Tamosiunas, G. Fasching, J. Kr¨oll, K. Unterrainer, M. Beck, M. Giovannini, J. Faist, C. Kremser, and P. Debbage, “Imaging with a Terahertz quantum cascade laser,” Opt. Express12, 1879–1884 (2004). 18. A. W. Lee, Q. Qin, S. Kumar, B. S. Williams, Q. Hu, and J. L. Reno, “Real-time terahertz imaging over a standoff
distance (25 meters),” Appl. Phys. Lett.89, 141125–141125 (2006).
19. P. Dean, M. U. Shaukat, S. P. Khanna, S. Chakraborty, M. Lachab, A. Burnett, G. Davies, and E. H. Linfield, “Absorption-sensitive diffuse reflection imaging of concealed powders using a terahertz quantum cascade laser,” Opt. Express16, 5997–6007 (2008).
20. P. Dean, N. K. Saat, S. P. Khanna, M. Salih, A. Burnett, J. Cunningham, E. H. Linfield, and A. G. Davies, “Dual-frequency imaging using an electrically tunable terahertz quantum cascade laser,” Opt. Express17, 20631–20641 (2009).
21. H.-W. Hubers, S. Pavlov, H. Richter, A. Semenov, L. Mahler, A. Tredicucci, H. Beere, and D. Ritchie, “High-resolution gas phase spectroscopy with a distributed feedback terahertz quantum cascade laser,” Appl. Phys. Lett. 89, 061115 (2006).
22. A. A. Danylov, T. M. Goyette, J. Waldman, M. J. Coulombe, A. J. Gatesman, R. H. Giles, X. Qian, N. Chan-drayan, S. Vangala, K. Termkoa, W. D. Goodhue, and W. E. Nixon, “Terahertz inverse synthetic aperture radar (ISAR) imaging with a quantum cascade laser transmitter,” Opt. Express18, 16264–16272 (2010).
23. M. Ravaro, V. Jagtap, G. Santarelli, C. Sirtori, L. Li, S. Khanna, E. Linfield, and S. Barbieri, “Continuous-wave coherent imaging with terahertz quantum cascade lasers using electro-optic harmonic sampling,” Appl. Phys. Lett.102, 091107 (2013).
24. S. Barbieri, P. Gellie, G. Santarelli, L. Ding, W. Maineult, C. Sirtori, R. Colombelli, H. Beere, and D. Ritchie, “Phase-locking of a 2.7-THz quantum cascade laser to a mode-locked erbium-doped fibre laser,” Nature Photon. 4, 636–640 (2010).
25. M. Ravaro, S. Barbieri, G. Santarelli, V. Jagtap, C. Manquest, C. Sirtori, S. Khanna, and E. Linfield, “Measure-ment of the intrinsic linewidth of terahertz quantum cascade lasers using a near-infrared frequency comb,” Opt. Express20, 25654–25661 (2012).
26. R. P. Green, J. H. Xu, L. Mahler, A. Tredicucci, F. Beltram, G. Giuliani, H. E. Beere, and D. A. Ritchie, “Linewidth enhancement factor of terahertz quantum cascade lasers,” Appl. Phys. Lett.92, 071106 (2008). 27. Y. L. Lim, P. Dean, M. Nikoli´c, R. Kliese, S. P. Khanna, M. Lachab, A. Valavanis, D. Indjin, Z. Ikoni´c, P. Harrison,
E. H. Linfield, A. G. Davies, S. J. Wilson, and A. D. Raki´c, “Demonstration of a self-mixing displacement sensor based on terahertz quantum cascade lasers,” Appl. Phys. Lett.99, 081108 (2011).
28. P. Dean, Y. L. Lim, A. Valavanis, R. Kliese, M. Nikoli´c, S. P. Khanna, M. Lachab, D. Indjin, Z. Ikoni´c, P. Harrison, A. D. Raki´c, E. H. Linfield, and A. G. Davies, “Terahertz imaging through self-mixing in a quantum cascade laser,” Opt. Lett.36, 2587–2589 (2011).
29. S. Donati, “Developing self-mixing interferometry for instrumentation and measurements,” Laser Photon. Rev. 6, 393–417 (2012).
30. T. Bosch, C. B`es, L. Scalise, and G. Plantier,Encyclopedia of Sensors(American Scientific Publishers, 2006), chap. Optical feedback interferometry, pp. 1–20.
31. G. Giuliani, M. Norgia, S. Donati, and T. Bosch, “Laser diode self-mixing technique for sensing applications,” J. Opt. A: Pure Appl. Opt.4, S283–S294 (2002).
(John Wiley & Sons, 2005), chap. 7: Laser Interferometry.
33. G. Scalari, L. Ajili, J. Faist, H. Beere, E. Linfield, D. Ritchie, and G. Davies, “Far-infrared (λ= 87 µm) bound-to-continuum quantum-cascade lasers operating up to 90 K,” Appl. Phys. Lett.82, 3165–3167 (2003). 34. D. Indjin, P. Harrison, R. Kelsall, and Z. Ikoni´c, “Mechanisms of temperature performance degradation in
tera-hertz quantum-cascade lasers,” Appl. Phys. Lett.82, 1347–1349 (2003).
35. P. Gellie, S. Barbieri, J.-F. Lampin, P. Filloux, C. Manquest, C. Sirtori, I. Sagnes, S. P. Khanna, E. H. Linfield, A. G. Davies, H. Beere, and D. Ritchie, “Injection-locking of terahertz quantum cascade lasers up to 35 GHz using RF amplitude modulation,” Opt. Express18, 20799–20816 (2010).
36. S. Barbieri, M. Ravaro, P. Gellie, G. Santarelli, C. Manquest, C. Sirtori, S. P. Khanna, E. H. Linfield, and A. G. Davies, “Coherent sampling of active mode-locked terahertz quantum cascade lasers and frequency synthesis,” Nature Photon.5, 306–313 (2011).
37. K. Petermann,Laser diode modulation and noise, 3rd ed. (Springer, 1991).
38. R. Lang and K. Kobayashi, “External optical feedback effects on semiconductor injection laser properties,” IEEE J. Quantum Electron.16, 347–355 (1980).
39. P. Spencer, P. Rees, and I. Pierce,Unlocking Dynamical Diversity: Optical Feedback Effects on Semiconductor Lasers(John Wiley & Sons, 2005), chap. 2: Theoretical Analysis.
40. S. Donati, “Responsivity and noise of self-mixing photodetection schemes,” IEEE J. Quantum Electron.47, 1428–1433 (2011).
41. G. Plantier, C. B`es, and T. Bosch, “Behavioral model of a self-mixing laser diode sensor,” IEEE J. Quantum Electron.41, 1157–1167 (2005).
42. Y. L. Lim, K. Bertling, P. Rio, J. Tucker, and A. Rakic, “Displacement and distance measurement using the change in junction voltage across a laser diode due to the self-mixing effect,” inPhotonics: Design, Technology, and Packaging II, D. Abbott, Y. S. Kivshar, H. H. Rubinsztein-Dunlop, and S. Fan, eds., Proc. SPIE6038, 60381O-1 (2006).
43. G. Bryant,Principles of microwave measurements(P. Peregrinus Ltd. on behalf of the Institution of Electrical Engineers, 1993).
44. P. Cunningham, N. Valdes, F. Vallejo, L. Hayden, B. Polishak, X. Zhou, J. Luo, A. Jen, J. Williams, and R. Twieg, “Broadband terahertz characterization of the refractive index and absorption of some important polymeric and organic electro-optic materials,” J. Appl. Phys.109, 043505–043505 (2011).
45. Y.-S. Jin, G.-J. Kim, and S.-G. Jeon, “Terahertz dielectric properties of polymers,” J. Korean Phys. Soc.49, 513–517 (2006).
46. S. Wietzke, C. Jansen, M. Reuter, T. Jung, D. Kraft, S. Chatterjee, B. Fischer, and M. Koch, “Terahertz spec-troscopy on polymers: A review of morphological studies,” J. Mol. Struct.1006, 41–51 (2011).
47. A. W. M. Lee, T.-Y. Kao, D. Burghoff, Q. Hu, and J. L. Reno, “Terahertz tomography using quantum-cascade lasers,” Opt. Lett.37, 217–219 (2012).
48. S. Barbieri, J. Alton, H. E. Beere, J. Fowler, E. H. Linfield, and D. A. Ritchie, “2.9 THz quantum cascade lasers operating up to 70 K in continuous wave,” Appl. Phys. Lett.85, 1674 (2004).
49. S. P. Khanna, S. Chakraborty, M. Lachab, N. M. Hinchcliffe, E. H. Linfield, and A. G. Davies, “The growth and measurement of terahertz quantum cascade lasers,” Physica E: Low Dimens. Syst. Nanostruct.40, 1859–1861 (2008).
50. A. D. Raki´c, “Algorithm for the determination of intrinsic optical constants of metal films: application to alu-minum,” Appl. Opt.34, 4755–4767 (1995).
1. Introduction
Moreover, spectroscopic data acquisition is slow and the technique relies on bulky and ex-pensive ultrafast laser sources for the generation and coherent detection of THz radiation.
Recently the THz quantum cascade laser (QCL) [15] has emerged as the established labora-tory source of high-power radiation in the frequency range∼1–5 THz. Terahertz QCLs have been shown to exhibit remarkable spectral purity with quantum-limited linewidths [16], making them ideally-suited to coherent THz systems. Nevertheless, owing to the challenges of coher-ently detecting the emission from such sources, most system developments have focussed on incoherent approaches to imaging [17, 18] and materials analysis [19, 20]. Coherent detection schemes have, however, permitted the phase and/or frequency of the THz field to be resolved. By exploiting the heterodyne mixing between a free-running QCL and a local oscillator derived from a gas laser, high-resolution frequency-resolved gas spectroscopy has been reported [21]. Phase-sensitive detection using a heterodyne approach has also enabled coherent inverse syn-thetic aperture radar imaging [22]. More recently, coherent imaging has been demonstrated by phase-locking a THz QCL to a near-infrared fs-laser comb [23], achieving a phase stability better than 3◦per hour.
It has been noted in the literature [24,25] that QCLs are affected by the reinjection of emitted radiation into the laser cavity. Whilst this optical feedback markedly reduces the frequency noise spectral density of the QCL, its linewidth under feedback remains close to the intrinsic QCL linewidth [25]. Optical feedback effects have also been exploited for measurement of the linewidth enhancement factor of QCLs [26, 27], as well as the realisation of compact THz imaging schemes [28].
We propose a new method for coherent imaging and materials analysis using a THz QCL feedback interferometer in reflection mode. At the heart of this scheme is the realization that a portion of the emitted THz radiation reflected from an external target, when reinjected into the laser cavity, yields information about the remote target that is observable through changes in laser operating parameters. Using this scheme, we concurrently obtain two-dimensional amplitude-like and phase-like images with minimal signal processing, which are indicative of the refractive index distribution and variation in absorption respectively. We demonstrate that this coherent detection method enables extraction of the refractive index and absorption coefficient of materials under test. Key to this approach is the implementation of a THz swept-frequency delayed self-homodyning (‘self-mixing’) scheme that enables phase-sensitive detec-tion of the THz field emitted by a QCL source. As well as phase-stability, the use of a QCL as the THz source affords the benefit of high output power spectral density, several orders of magnitude better spectral resolution than TDS, and the potential for high-speed measurements.
2. Theory
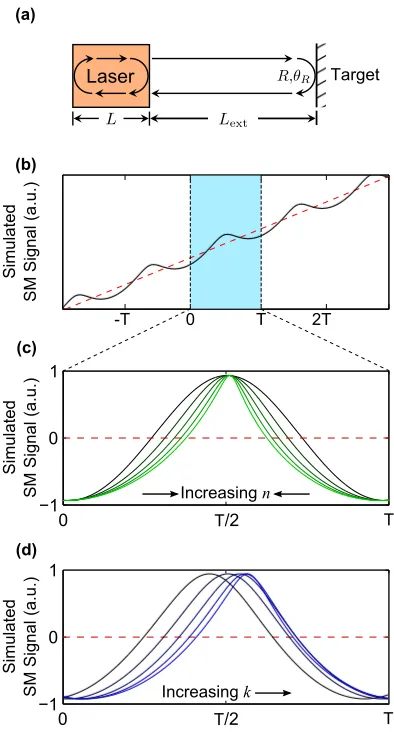
The basic structure and operating principles of our self-mixing interferometer are shown in Fig. 1(a). The re-injected light interferes (‘mixes’) with the intra-cavity electric field, caus-ing small variations in the fundamental laser parameters includcaus-ing the threshold gain, emitted power, lasing spectrum, and laser terminal voltage [29–32]. Whilst optical feedback affects al-most all laser parameters, the two that are al-most conveniently monitored are the emitted optical power and the voltage across the laser terminals. Of these, monitoring the laser terminal volt-age is preferred as it removes the need for an external terahertz detector [28]. The small voltvolt-age variation (referred to as the ‘self-mixing signal’) depends on both the amplitude and phase of the electric field of the reflected laser beam. This configuration thus creates a compact, coherent sensor that can probe information about the complex reflectivity or complex refractive index of the external target.
Fig. 1. Schematic diagram showing an intensity, and frequency modulated, self-mixing interferometer with representative waveforms in the time domain. (a) A laser with an ex-ternal target at distanceLextfrom the exit facet of the laser. (b) Self-mixing signal observed
ratio can be expected in the self-mixing signal. Furthermore, the maximum speed of response to optical feedback is determined by the frequency of relaxation oscillations in the laser itself. In the case of THz QCLs, the lifetime of the upper state of the lasing transition is limited by elastic and inelastic scattering mechanisms to a few picoseconds [33, 34], enabling response frequencies on the order of tens of GHz [35, 36].
We use a three mirror model to describe the laser system under feedback [37], which is equiv-alent to the steady-state solution to the model proposed by Lang and Kobayashi [38]. In this model, only one round-trip in the external cavity is considered. The phase shift in the external cavity is composed of the transmission phase shift arising from the optical path length as well as the phase change on reflection from the target. The reflectivity of the target together with the phase change on reflection form a complex pair which is equivalent to the complex refrac-tive index of the target. When the external target is displaced longitudinally, the laser system is swept through a set of compound cavity resonances [27]. The equivalent effect may be obtained by changing the laser frequency, which is accomplished here by applying a linear modulation of the laser driving current. The primary effect of this current sweep is a modulation of both the emitted laser power and the voltage developed across the laser terminals. The secondary effect, which is of most importance here, is a linear change of the lasing frequency with current (frequency chirp). This approach in essence constitutes a continuous-wave (cw) frequency-modulated system for coherently probing the remote target. During the frequency sweep, the self-mixing signal is observed as a set of periodic perturbations embedded in the modulated voltage signal [see Fig. 1(b)]. The temporal separation between the peaks of the self-mixing signal waveform, as well as its shape and phase, depends on the length of the external cav-ity and the complex reflectivcav-ity of the target. This is illustrated in Figs. 1(c) and 1(d), which considers one period of the self-mixing waveform with the linear ramp removed. Figure 1(c) shows the effect of increasing the real part of the complex refractive indexn, leading princi-pally to a narrowing of the waveform due to stronger feedback. On the other hand, an increase in the imaginary part of the complex refractive index (extinction coefficient)kpredominately produces a phase shift in the waveform whilst leaving the shape of the waveform unchanged, as shown in Fig. 1(d). This effect is mainly due to the strong link betweenkand the phase-shift on reflection. Thus, through analysis of the shape and phase of the self-mixing waveform, the complex reflectivity of the target may be deduced. The way in which information aboutnand kaffects the self-mixing signal is suitably described through the well-known steady-state solu-tion to the Lang and Kobayashi model. In particular, informasolu-tion about the complex refractive index of the target enters the Lang and Kobayashi model through the feedback parameterC, the effective external cavity lengthLext[39], and the phase change on reflectionθR.
The technique proposed here is equally applicable to extracting values fornandkof a ma-terial under test, and for high-contrast imaging of spatial variation in these quantities across a target.
3. Experimental Setup
slightly above the threshold (Ith=0.4 A), where the sensitivity to optical feedback is at a
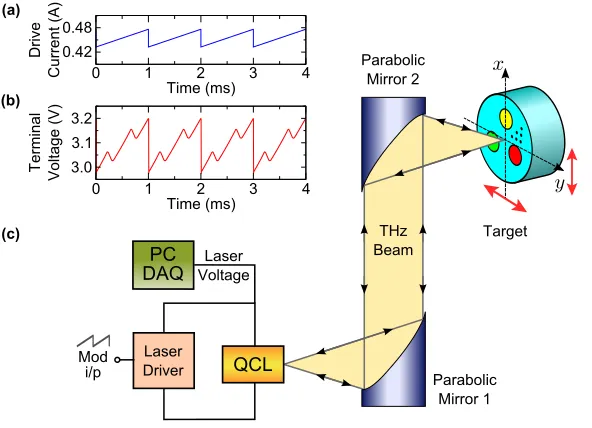
[image:8.612.160.456.237.451.2]maximum [28, 40]. A modulating saw-tooth current signal (50 mA peak-to-peak amplitude) was superimposed on the dc current [see Fig. 2(a)]. This leads to a linear frequency sweep of 600 MHz. Owing to optical feedback from the material under test, the self-mixing waveform containing information about the target is embedded in the voltage signal measured across the laser terminals [see Fig. 2(b)]. For image acquisition, the target was raster-scanned in two dimensions using a two-axis computer-controlled translation stage [see Fig. 3(a) for a photo-graph of the front surface of the target]. Time domain traces were acquired at each node of a 181×181 square grid with spatial resolution of 100 µm. For each spatial pixel of the target, the voltage signal was recorded as the average of 128 time-domain traces. Therefore the complete set of experimental data contains 181×181 time-domain waveforms, each corresponding to one spatial pixel on the target.
Fig. 2. Schematic diagram of the experimental apparatus used for target measurements. (a) Current stimulus signal; the current range was selected to sweep the laser frequency through three external cavity resonances in the region where the laser was most sensitive to optical feedback. (b) Corresponding voltage signal measured across the laser terminals. For illustrative purposes, the magnitude of the self-mixing signal has been increased ten-fold. The voltage signal shown is typical for this set-up. (c) The QCL is driven by a sawtooth current signal and the QCL terminal voltage variations are acquired using a PC-based data acquisition card (PC DAQ). A pair of parabolic mirrors focusses the beam onto the remote target containing materials under test, mounted on a computer-controlled translation stage. The six-dot triangular pattern was used for target orientation.
4. Results and Discussion
Two very different types of approach can be taken to analyse the data acquired in the exper-iments described above and we will address each in turn. First, a range of high-contrast THz images can be created by processing the self-mixing signals. Second, we present a procedure for extracting absolute values fornandkfor any region on the target, provided precise values ofnandkare known at two other positions on the target.
4.1. Imaging
To obtain high-contrast THz images, we first take each voltage signal and subtract a reference slope, thereby removing the effect of power modulation of the laser; stronger feedback leads to more pronounced departure of the voltage signal from the reference slope. The effect of tran-sients present around the edges of the modulation period of the laser is removed by using only the central 80% of each self-mixing trace. Figure 3(b) shows a two-dimensional representation of the set of time-domain self-mixing signals acquired along the representative horizontal line in Fig. 3(a), with the vertical axis showing temporal evolution of the self-mixing signal and the horizontal axis showing its spatial dependence. The colour scheme quantifies the instantaneous amplitude of the self-mixing signal (reference slope already removed). One should bear in mind that due to the coherent nature of the detection scheme the signal strength at a particular point in time cannot be simply related to the reflection coefficient of the target; rather, it is the inte-gral of the absolute value of the signal over time that is proportional to the reflectivity of the target. Further, this quantity is indicative of the strength of the self-mixing signal, with stronger feedback yielding a larger value.
In Fig. 3(c), this stronger feedback is spatially represented by the copper-colour end of the pseudocolor range, corresponding to the aluminium part of the target. Weaker feedback regions, corresponding to plastic insets in the aluminium target, are visible as black circles. Due to the strong reflection from aluminium and similar reflectivity of the three plastics at 2.59 THz, contrast between the three plastic insets is not visually discernible in Fig. 3(c). However, it is perfectly preserved in the time domain signal, as can be seen from the exemplar time domain traces plotted in Fig. 3(e) corresponding to each of the three plastic regions.
The amplitude-like codification of self-mixing signal [Fig. 3(c)] is exploiting just one part of the information embedded in it. Another possible representation relates to the phase, or equiv-alently the temporal position, of the peaks of the self-mixing signal relative to the edge of the modulating sawtooth signal. Different materials impose different phase-shifts on the inci-dent THz wave according to their complex refractive index, dominated by its imaginary part. This phase-like representation of the effect of the target on the self-mixing signal is shown in Fig. 3(d). Whilst visually this does not show the obvious contrast of the amplitude-like rep-resentation, it is interesting to note that these two pieces of information can be likened to the change in the magnitude and the phase of the complex reflectivity, respectively. These two re-ductions of the information contained in the self-mixing signal are by no means the only ones possible. For instance, by fitting these time-domain traces to the steady-state solution of the Lang and Kobayashi model [38], one obtains images through plotting the spatial variations in feedback parameterC.
4.2. Materials Analysis
lish the self-consistency of the scheme, this approach is adopted for each of the three materials in turn. In order to exclude the effects of the boundary between the materials and the alu-minium holder we use measurements from inside the circles superimposed on the photograph in Fig. 3(a) to determine the complex refractive index of each material under test. Referring to Fig. 1(a), the total phase delay in the external cavity can be decomposed into the transmission phase delay arising from the round-trip through the cavity and the phase change on reflection from the target, which is material dependent. The second order effect of the linear current sweep is a linear chirp of the lasing frequency (600 MHz), leading to a linear dependence of trans-mission phase with time. Therefore the external phase delay (interferometric phase)ϕover one frequency modulation periodTas a function of time is of the form
ϕ(t) =ϕ0+
Φ∆
T t−θR, (1) whereϕ0 is the round-trip transmission phase delay in the external cavity at the start of the
frequency sweep,Φ∆is the interferometric phase deviation caused by the current (frequency)
sweep, andθRis the phase change on reflection from the material under test. Clearly,ϕ is a
function of the instantaneous laser frequency, which depends on the level of feedback in the laser system.
According to the Lang and Kobayashi model for a semiconductor laser under optical feed-back in a steady state [38], the laser frequency satisfies the phase condition (sometimes called the excess phase equation)
ϕS−ϕFB=Csin(ϕFB+arctanα), (2)
whereϕFBrepresents the total external round-trip phase at the perturbed laser frequency, ϕS
represents the total external round-trip phase at the solitary laser frequency,Cis the feedback parameter that depends on the amount of light reflected back into the laser cavity, andα is
the linewidth enhancement factor [39]. Solutions to Eq. (2) are not possible in closed form and therefore require numerical solution [41]. The interferometric phase change is directly observable through the change in emitted optical power, or equivalently through the change in voltage across the laser terminals, as is used here [42]. The self-mixing signal embedded in the modulated voltage signal is related to the phase change through
V =V0+βcos(ϕFB), (3)
whereV is the voltage waveform obtained after the removal of the common slope,V0 is a
dc component of this signal (corresponding to a material-dependent voltage offset from the reference slope), andβ is the modulation index. Note that, for the modulation scheme used
here,V is a function of time through its dependence on the interferometric phaseϕFB.
Thus we have obtained a parametric model, based directly on the steady state solution to the Lang and Kobayashi model, that describes well the set of experimentally acquired time domain traces. Equations (1)–(3) form a model with six key parameters, namelyC,α,θR,Φ∆,V0, andβ.
The information about the complex refractive index to be extracted is encoded mainly inC,α,
andθR. To extract these parameters, we fit the model to data in the least-squares sense, for each spatial pixel of the target. This provides us with a set of parameter values for each pixel inside the coloured circles in Fig. 3(a).
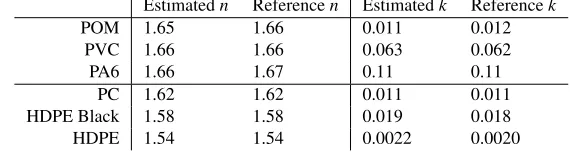
Table 1. Results for six materials under test obtained from two different targets compared against reference values from the literature.
Estimatedn Referencen Estimatedk Referencek
POM 1.65 1.66 0.011 0.012
PVC 1.66 1.66 0.063 0.062
PA6 1.66 1.67 0.11 0.11
PC 1.62 1.62 0.011 0.011
HDPE Black 1.58 1.58 0.019 0.018
HDPE 1.54 1.54 0.0022 0.0020
5. Conclusion
In summary, we present a novel feedback interferometric approach to the optical analysis of materials at THz frequencies. Using this simple, robust approach, both intensity- and phase-like images of materials are acquired concurrently. This technique enables us to interrogate regions of the target and extract precise values for refractive index and absorption coefficient within these defined areas. Such characterisation of the optical properties of substances at THz frequencies will enhance the detection and discrimination in the materials science. Extension of this single-laser system to an array of QCLs [47] will enable characterisation at a number of frequencies, and therefore material identification.
Appendix A
Laser Fabrication
The THz QCL heterostructure was based on a GaAs/AlGaAs bound-to-continuum [48] active region design operating at 2.59 THz. The wafer was grown on a semi-insulating GaAs substrate by molecular beam epitaxy [49], with an active region thickness of 11.6 µm, consisting of 90 repetitions of the gain medium. The active region stack was sandwiched between doped upper 80–nm-thick (n=5×1018 cm−3) and lower 700–nm-thick (n=2×1018 cm−3) GaAs contact layers. The wafer was processed into a surface plasmon ridge waveguide using optical lithography and wet chemical etching as outlined in [49], with confinement of the waveguide mode being ensured by the lower doped layer. Optical lithography was used for defining ohmic contacts, the thicknesses of the Au/Ge/Ni bottom and top contacts being 200 nm and 100 nm, respectively. The thickness of the Ti/Au overlayer was 20 nm/200 nm and the substrate was thinned to a thickness of∼200 µm. A 140 µm ridge width was used and the cleaved device facets were left uncoated. The device was mounted on a copper bar using indium foil to provide thermal contact, and was then wire bonded.
Appendix B
System and Measurement Calibration
The refractive index n and the extinction coefficient k of the target directly affect the self-mixing voltage in our model through the phase-shift on reflectionθR. Moreover, the reflectance of the targetRis directly linked to the model parametersCandα through the definition of the
feedback parameterC, given by [39]
√
R∝√ C
1+α2
To account for external reflections other than that from the target (including reflections from the cryostat shield and the window), we write√Ras
√
RM=a R+bR
√
RA, (5)
where√RAis the actual reflectance of the material under test,a
RandbRare unknown parame-ters to be determined, and√RM=C/√1+α2is representative of the material’s measured, but
uncalibrated reflectance.
Along similar lines, to account for systematic phase changes, we expressθRas
θRM=aθ+bθθ
A
R, (6)
whereθRA is the actual phase shift on reflection, aθ and bθ are unknown parameters to be
determined, andθRMis representative of the uncalibrated phase shift on reflection. Equations (5) and (6) contain four unknown parameters,aR,bR,aθ, andbθ, which can be determined from
two measurements on materials with known(√RA,θA
R)values, which can be viewed as a set of four linear equations with four unknowns. Denoting the calibration pairs of measured and actual reflectances and phase-shifts for our two standards as(RM1,RA1) (θRM,1,θRA,1), and(RM2,RA2) (θRM,2,θRA,2)respectively, the set of four linear equations are
q
RM1 =aR+bR q
RA1, (7a)
q
RM2 =aR+bR q
RA2, (7b)
θRM,1=aθ+bθθ
A
R,1, (7c)
θRM,2=aθ+bθθ
A
R,2. (7d)
The solution of this system of equations is straightforward and provides values foraR,bR,aθ,
andbθ. Once these values have been obtained using (5) and (6) we can readily calculate actual
values forθRAandRAfor the material under test. The relationship between(R,θR)and(n,k)is given through the pair of relations [50]
n= 1−R
1+R−2√Rcos(θR)
, (8a)
and
k= 2
√
Rsin(θR)
1+R−2√Rcos(θR)
. (8b)
We apply this procedure to the three materials embedded in our target [see Fig. 3(a)]. We used values from the literature for optical constants for two of the materials, treating them as standards in this procedure to obtain values for the unknownsaR,bR,aθ, andbθ.
Acknowledgments