Western University Western University
Scholarship@Western
Scholarship@Western
Electronic Thesis and Dissertation Repository
11-1-2012 12:00 AM
Quantitative Evaluation of Pulmonary Emphysema Using
Quantitative Evaluation of Pulmonary Emphysema Using
Magnetic Resonance Imaging and x-ray Computed Tomography
Magnetic Resonance Imaging and x-ray Computed Tomography
Amir M. Owrangi
The University of Western Ontario
Supervisor Dr. Grace Parraga
The University of Western Ontario
Graduate Program in Biomedical Engineering
A thesis submitted in partial fulfillment of the requirements for the degree in Doctor of Philosophy
© Amir M. Owrangi 2012
Follow this and additional works at: https://ir.lib.uwo.ca/etd
Part of the Other Biomedical Engineering and Bioengineering Commons
Recommended Citation Recommended Citation
Owrangi, Amir M., "Quantitative Evaluation of Pulmonary Emphysema Using Magnetic Resonance Imaging and x-ray Computed Tomography" (2012). Electronic Thesis and Dissertation Repository. 936.
https://ir.lib.uwo.ca/etd/936
This Dissertation/Thesis is brought to you for free and open access by Scholarship@Western. It has been accepted for inclusion in Electronic Thesis and Dissertation Repository by an authorized administrator of
QUANTITATIVE EVALUATION OF PULMONARY EMPHYSEMA
USING MAGNETIC RESONANCE IMAGING AND X-RAY
COMPUTED TOMOGRAPHY
Spine Title: MRI and CT of Emphysema
(Thesis Format: Integrated Article)
by
Amir M. Owrangi
Graduate Program in Biomedical Engineering
Submitted in partial fulfillment of the requirements for the degree of
Doctor of Philosophy
The School of Graduate and Postdoctoral Studies The University of Western Ontario
London, Ontario, Canada
ii
THE UNIVERSITY OF WESTERN ONTARIO
School of Graduate and Postdoctoral Studies
Certificate of Examination
Supervisor
______________________________ Grace Parraga, Ph.D.
Supervisory Committee
______________________________ Aaron Fenster, Ph.D., FCCPM
______________________________ Ian Cunningham, Ph.D., FCCPM
___________________________ David McCormack, M.D. FRCPC
Examiners
______________________________ Steward Gaede, Ph.D.
______________________________ Yves Bureau, Ph.D.
______________________________ Elaine O’Riordan, M.D. FRCPC
______________________________ Narinder Paul, M.D. FRCR.
The thesis by
Amir M. Owrangi
entitled:
Quantitative Evaluation of Pulmonary Emphysema Using Magnetic Resonance Imaging and
x-ray Computed Tomography
is accepted in partial fulfilment of the requirements for the degree of
Doctor of Philosophy
Date: __________________________ _____________________________
iii
Abstract
Chronic obstructive pulmonary disease (COPD) is a leading cause of morbidity and
mortality affecting at least 600 million people worldwide. The most widely used clinical
measurements of lung function such as spirometry and plethysmography are generally
accepted for diagnosis and monitoring of the disease. However, these tests provide only
global measures of lung function and they are insensitive to early disease changes.
Imaging tools that are currently available have the potential to provide regional
information about lung structure and function but at present are mainly used for
qualitative assessment of disease and disease progression. In this thesis, we focused on
the application of quantitative measurements of lung structure derived from 1H magnetic
resonance imaging (MRI) and high resolution computed tomography (CT) in subjects
diagnosed with COPD by a physician. Our results showed that significant and
moderately strong relationship exists between 1H signal intensity (SI) and 3He apparent
diffusion coefficient (ADC), as well as between 1H SI and CT measurements of
emphysema. This suggests that these imaging methods may be quantifying the same
tissue changes in COPD, and that pulmonary 1H SI may be used effectively to monitor
emphysema as a complement to CT and noble gas MRI. Additionally, our results showed
that objective multi-threshold analysis of CT images for emphysema scoring that takes
into account the frequency distribution of each Hounsfield unit (HU) threshold was
effective in correctly classifying the patient into COPD and healthy subgroups. Finally,
we found a significant correlation between whole lung average subjective and objective
emphysema scores with high inter-observer agreement. It is concluded that 1H MRI and
high resolution CT can be used to quantitatively evaluate lung tissue alterations in COPD
subjects.
Keywords: 1
H Magnetic Resonance Imaging, Computed Tomography, Chronic Obstructive
Pulmonary Disease, Pulmonary Emphysema, Hyperpolarized 3He, Apparent Diffusion
iv
Co-Authorship
The following thesis contains three manuscripts. One manuscript was published as a
peer-reviewed manuscript in a scientific journal and two manuscripts were submitted for
publication. Chapter 2 is an original manuscript entitled “Quantitative 1H and
Hyperpolarized 3He Magnetic Resonance Imaging: Comparison in Chronic Obstructive
Pulmonary Disease and Healthy Never-Smokers”, and was published in the European
Journal of Radiology in May 2012. The manuscript was coauthored by Amir Owrangi,
Jian Wang, Andrew Wheatley, David G. McCormack and Grace Parraga. Amir Owrangi
designed and conducted the experiments, analyzed the data, and wrote the manuscript.
Dr. Jian Wang and Dr. David G. McCormack, provided technical and clinical expertise
and aided in interpretation of the results. Hyperpolarization of 3He was performed by
Andrew Wheatley. He also provided assistance with software design and writing. Dr.
Grace Parraga, as the principal author’s supervisor helped lead the study design, helped
to determine the project objectives, provided mentorship, consulted on interpretation of
the results, provided editorial assistance and overall guidance.
Chapter 3 is an original manuscript co-authored by Amir Owrangi,Lauren Villemaire,
Andrew Wheatley, Roya Etemad-Rezai, Ian Cunningham, David G. McCormack and
Grace Parraga. This manuscript, entitled “Quantification of Emphysema using x-ray
Computed Tomography Histogram Analysis” is in preparation for submission to the
journal of Investigative Radiology. Amir Owrangi contributed to study design, study
subject visits, performed data analysis and statistical analysis, led interpretation of the
results and wrote the manuscript. Lauren Villemaire provided assistance with data and
statistical analyses. Dr. Ian Cunningham, Dr. David G. McCormack, Dr. Roya
v
Hyperpolarization of 3He was performed by Andrew Wheatley. He also provided
assistance with software design and writing. Dr. Grace Parraga, as the principal author’s
supervisor helped lead the study design, helped to determine the project objectives,
provided mentorship, consulted on interpretation of the results, provided editorial
assistance and overall guidance.
Chapter 4 is an original manuscript entitled “Subjective Evaluation of Emphysema:
Reproducibility and Comparison with Objective Quantification” and is in preparation for
submission to the journal of Academic Radiology. The manuscript was co-authored by
Amir Owrangi, Lauren Villemaire, Brandon Entwistle, Andrew Lu, Jack Chiu, Nabil
Hussain, Roya Etemad-Rezai, David G. McCormack and Grace Parraga. Amir Owrangi
contributed to study design, study subject visits, subjective scoring of emphysema,
performed data analysis and statistical analysis, led interpretation of the results and wrote
the manuscript. Lauren Villemaire provided assistance with subjective scoring of
emphysema, data and statistical analyses. Dr. David G. McCormack, Dr. Roya
Etemad-Rezai provided technical and clinical expertise and aided in interpretation of the results.
Dr. Roya Etemad-Rezai, Dr. Brandon Entwistle, Dr. Andrew Lu, Dr. Jack Chiu and Dr.
Nabil Hussain provide assistance in subjective scoring of emphysema. Hyperpolarization
of 3He was performed by Andrew Wheatley. He also provided assistance with software
design and writing. Dr. Grace Parraga, as the principal author’s supervisor helped led the
study design, helped to determine the project objectives, provided mentorship, consulted
on interpretation of the results, provided editorial assistance and overall guidance.
Appendix A is an original manuscript entitled “Pulmonary Tumour Measurements from
vi
in Academic Radiology in November 2011. The manuscript was co-authored by Lauren
Villemaire, Amir Owrangi, Laura Wilson, Elaine O’Riordan, Roya Etemad-Rezai, Harry
Keller, Brandon Driscoll, Glen Bauman, Aaron Fenster and Grace Parraga. Amir
Owrangi and Lauren Villemaire contributed equally to study design, tumour
measurement, performed data analysis and statistical analysis, led interpretation of the
results and wrote the manuscript. Laura Wilson provided assistance with measurement of
tumours, data and statistical analyses. Dr. Glen Bauman, Dr. Elaine O’Riordan, Dr. Roya
Etemad-Rezai, Dr. Aaron Fenster and Dr. Harald Keller provided technical and clinical
expertise and aided in interpretation of the results. Brandon Driscoll performed the
phantom tumour measurements and provided assistance with phantom scanning. Dr.
Grace Parraga, as the principal author’s supervisor helped led the study design, helped to
determine the project objectives, provided mentorship, consulted on interpretation of the
results, provided editorial assistance and overall guidance.
Appendix B is an original manuscript entitled “Three-dimensional lung tumor
segmentation from x-ray computed tomography using sparse field active models” and
was published in Medical Physics in February 2012. The manuscript was co-authored
by, Joseph Awad, Amir Owrangi, Lauren Villemaire, Elaine O’Riordan, Grace Parraga
and Aaron Fenster. Joseph Awad contributed to study design, performed data analysis
and statistical analysis, led interpretation of the results and wrote the manuscript. Amir
Owrangi and Lauren Villemaire provided assistance with measurement of tumours,
performed data analysis and statistical analysis. Dr. Grace Parraga provided technical
and clinical expertise and aided in interpretation of the results. Dr. Aaron Fenster, as the
vii
objectives, provided mentorship, consulted on interpretation of the results, provided
editorial assistance and overall guidance.
Appendix C is an editorial entitled “Chest MRI in children: why bother?” and was
published in Respirology in January 2012. The manuscript was co-authored Amir
Owrangiand Grace Parraga. Amir Owrangi wrote the manuscript. Dr. Grace Parraga, as
the principal author’s supervisor helped led the helped to determine the manuscript
objectives, provided mentorship, provided editorial assistance and overall guidance.
Pulmonary function tests were performed by Sandra Halko and Shayna McKay and MRI
ix
Acknowledgements
First, I would like to take a moment and thank my supervisor, Dr. Grace Parraga for
giving me the opportunity to be part of her research group, for her guidance, enthusiasm,
and everlasting support. She was not only a great supervisor to me, but also a good
mentor who inspires and challenges me, and shares her research insight and passion
throughout this research project. I owe her many thanks for her constructive criticism
during my time in her lab.
I would also like to thank the members of my advisory committee: Dr. Aaron Fenster, Dr.
Ian Cunningham and Dr. David McCormack for their invaluable guidance and support.
Their insightful suggestions and advice provided me with new thoughts and directions for
my project.
I would also like to thank the staff of the Parraga lab: Andrew Wheatley, Trevor
Szekeres, Shayna McKay and Sandra Halko. To Andrew Wheatley, who is always
helping me with computer related issues and software installation. I really enjoyed sitting
near you during my thesis writing period. To Sandra Halko, who answers many of my
questions about pulmonary function tests and helps in collecting such a wonderful data
set. To Shayna McKay, who collects all the clinical information of all subjects in one
Access datasheet. Whenever I asked you a question your thoughtful answers were always
helpful. Many thanks to Trevor Szekeres, for performing fast and efficient MRI scans.
You’ve been very helpful in answering all of my questions.
To my lab-mates, for your friendship and support. I am very thankful for the friendships
x
like to thank Miranda for helping me with my stats questions and spending time to
discuss the physiological aspects of my project. To Lindsay, for being a good friend and
shedding some light into some aspects of my project. To Steve for a lot of physics and
imaging related discussions that we had. Dan, we had lots of stat related discussion which
helped me a lot through the statistical analysis of my projects. Lauren, we started working
together during you undergrad fourth year project and I always enjoyed working with
you. I wish our collaboration can continue for future projects. Sarah, you have been a
great teammate both in the lab and in the soccer field. Nikhil, you have been a good
friend to me and I always enjoyed chatting with you. Many thanks to Laura Wilson and
Hassan Ahmed for many memorable times that we had together.
A very special thank to my wife, Samaneh, for your true love, patience and support. I
would also thank my family for all of their support and encouragement through my PhD.
Finally, I am thankful for the financial support I received during my graduate studies,
particularly the Queen Elizabeth II Graduate Scholarship in Science and Technology and
xi
Table of contents
Certificate of Examination ... ii
Abstract ... iii
Co-Authorship... iv
Acknowledgements ... ix
Table of contents ... xi
List of Appendices ... xiv
List of Tables ... xv
List of Figures ... xvi
List of Abbreviations ... xviii
CHAPTER 1: Introduction ... 1
1.1 Overview and Motivation ... 1
1.2 Lung Structure and Function ... 2
1.2.1 Conducting zone ... 3
1.2.2 Respiratory zone ... 4
1.3 Chronic Obstructive Pulmonary Disease (COPD) ... 5
1.3.1 Small Airways Disease ... 7
1.3.2 Parenchymal Destruction ... 8
1.4 Evaluation of COPD in Clinical Practice ... 10
1.4.1 Pulmonary Function Tests ... 10
1.4.2 Measurements of Dyspnea ... 13
1.4.4 Fractional exhaled nitric oxide (FENO) ... 15
1.4.5 Bronchial alveolar lavage (BAL) ... 15
1.5 Imaging the Lung ... 16
1.5.1 Chest x-ray ... 16
1.5.2 X-ray Computed Tomography ... 18
1.5.3 Nuclear Medicine Methods ... 21
1.5.4 Magnetic Resonance Imaging ... 25
1.6 Imaging of Pulmonary Emphysema ... 31
xii
1.6.2 1H and Hyperpolarized 3He MRI ... 33
1.7 Thesis Hypothesis and Objectives ... 36
1.8 References ... 38
CHAPTER 2: Quantitative 1H and Hyperpolarized 3He Magnetic Resonance Imaging: Comparison in Chronic Obstructive Pulmonary Disease and Healthy Never-smokers ... 53
2.1 Introduction ... 53
2.2 Materials and Methods ... 55
2.2.1 Study Subjects ... 55
2.2.2 Spirometry and Plethysmography ... 56
2.2.3 Image Acquisition ... 57
2.2.4 Image Analysis ... 60
2.2.5 Statistical Analysis ... 62
2.3 Results ... 63
2.4 Discussion ... 65
2.5 References ... 72
CHAPTER 3: Computed Tomography Density Histogram Analysis to Evaluate Pulmonary Emphysema in Ex-smokers ... 77
3.1 INTRODUCTION ... 77
3.2 MATERIALS AND METHODS ... 80
3.2.1 Study Subjects ... 80
3.2.2 Spirometry and Plethysmography ... 80
3.2.3 Image Acquisition ... 82
3.2.4 Density Histogram Principal Component Analysis Score (DHPCS) ... 83
3.2.5 CT Density Histogram Thresh-hold Measurements ... 85
3.2.6 Expert Observer Emphysema Quantification... 85
3.2.7 Statistical Analysis ... 86
3.3 RESULTS ... 87
3.4 DISCUSSION ... 90
3.5 References ... 96
CHAPTER 4: Semi-automated Scoring of Pulmonary Emphysema from x-ray CT: Trainee Reproducibility and Accuracy ... 101
4.1 INTRODUCTION ... 101
xiii
4.2.1 Study Subjects ... 105
4.2.2 Spirometry and Plethysmography ... 105
4.2.3 Image Acquisition ... 105
4.2.4 Emphysema Quantification ... 107
4.2.5 Semi-automated Emphysema Scoring ... 109
4.2.6 Statistical Analysis ... 110
4.3 RESULTS ... 111
4.3.1 Subject Demographics ... 111
4.3.2 Trainee Accuracy ... 111
4.3.3 Trainee Reproducibility ... 113
4.4 DISCUSSION ... 114
4.5 References ... 120
CHAPTER 5: CONCLUSIONS AND FUTURE DIRECTIONS ... 124
5.1 Overview and Summary ... 124
5.2 Summary of Conclusions ... 129
5.2 Limitation of Current Tools and Solutions ... 130
5.3 Future Directions ... 134
5.4 Conclusion ... 136
5.5 References ... 137
xiv
List of Appendices
Appendix – A: Pulmonary Tumour Measurements from X-Ray Computed Tomography
in One- Two- and Three-dimensions ... 143
Appendix – B: Three-dimensional lung tumor segmentation from x-ray computed tomography using sparse field active models ... 144
Appendix – C: Chest MRI in Children: Why Bother? ... 145
Appendix – D: Permissions for Reproduction of Scientific Articles ... 146
Appendix – E: Health Science Research Ethics Board Approval Notices ... 149
xv
List of Tables
Chapter 1
Table 1.1 COPD classification based on spirometry ... 7
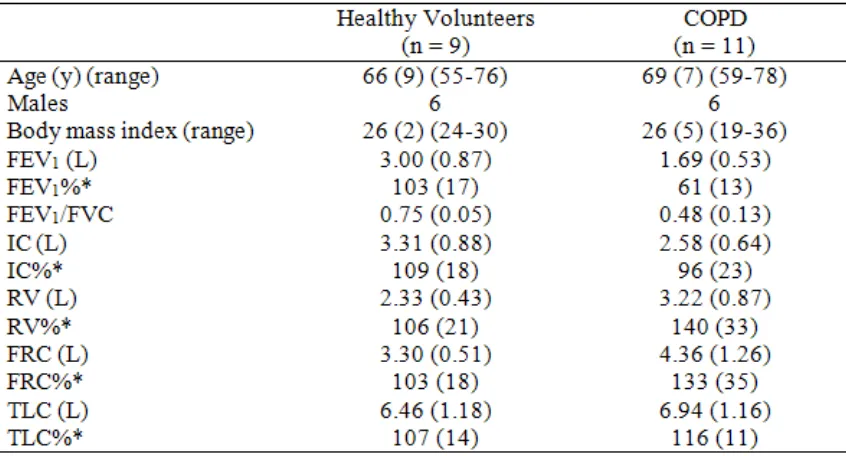
Chapter 2 Table 2.1 Subject Demographics ... 56
Table 2.2 MRI and CT Measurements ... 66
Chapter 3 Table 3.1: Subject Demographics and Emphysema measurements ... 83
Table 3.2: Pearson correlation coefficients ... 87
Table 3.3: Significant differences between Pearson correlation (PC) coefficients for DHPCS and other emphysema measurements ... 93
Chapter 4 Table 4.1. Subject Demographics ... 110
Table 4.2. Trainee-Expert Observer Comparisons ... 112
Table 4.3. Inter- and Intra-observer Reproducibility for Trainees... 115
xvi
List of Figures
Chapter 1
Figure 1.1: Human airway tree by generation ... 4
Figure 1.2: Lung function ... 5
Figure 1.3: Healthy and emphysematous alveoli ... 9
Figure 1.4: Pulmonary function testing ... 12
Figure 1.5: Chest x-ray of healthy volunteer and COPD subject ... 17
Figure 1.6: X-ray CT of healthy and emphysematous lungs ... 20
Figure 1.7: PET/CT image of healthy volunteer and subject with lung cancer ... 24
Figure 1.8: Conventional 1H MRI of healthy and emphysematous lungs ... 27
Figure 1.9: Hyperpolarized 3He MRI of a healthy volunteer and subjects with different lung diseases ... 29
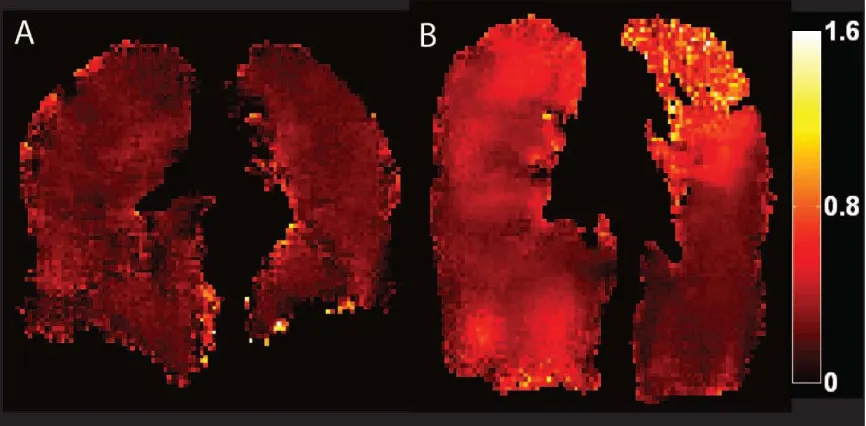
Figure 1.10: Pulmonary hyperpolarized 3He ADC of a healthy volunteer and a subject with COPD. ... 35
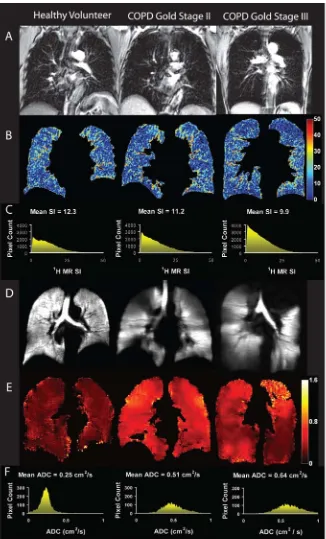
Chapter 2 Figure 2.1: 1H and 3He MRI for a healthy never-smoker and GOLD stage II and III COPD. ... 58
Figure 2.2: Mean 1H SI anatomical differences in the anterior-to-posterior (AP) ROI. ... 60
Figure 2.3: Mean 1H SI anatomical differences in the apex-to-base (AB) ROI. ... 61
Figure 2.4: Relationship between 1H SI, 3He ADC and pulmonary function measurements. ... 65
Figure 2.5: Relationship between 1H SI and 3He ADC. ... 67
Figure 2.6: Relationship between 1H SI and 3He ADC with CT tissue attenuation measurements. ... 69
Chapter 3 Figure 3.1: Schematic Representation of Method... 80
Figure 3.2: Coronal center slice 3He ADC maps, CT images and Relative area (RA) Masks for HU thresholds. ... 81
xvii
Figure 3.4: Significant Correlations for whole lung DHPCS and emphysema
measurements ... 92
Chapter 4
Figure 4.1. CT emphysema scoring Graphic User Interface. ... 102
Figure 4.2. Axial center slice CT images for Representative AE and GOLD stage II and IV COPD subjects. ... 104
Figure 4.3. Mean emphysema scores and Bland-Altman analysis for all observers. .... 107
Figure 4.4. Relationship between Emphysema scores of Trainees with Expert, CT
densitometry and DLCO. ... 108
xviii
List of Abbreviations
2D Two-dimensional
3D Three-dimensional
3
He Helium-3
99m
Tc Technetium-99m
129
Xe Xenon-129
ADC Apparent diffusion coefficient
ANOVA Analysis of variance
ATS American thoracic society
AUC Area under the curve
BAL Bronchoalveolar lavage
BMI Body mass index
BW Bandwidth
COPD Chronic obstructive lung disease
CT Computed tomography
COV Coefficient of variation
DHPCS Density histogram principal component score (DHPCS)
DLCO Diffusing capacity of carbon monoxide
DWI Diffusion-weighted imaging
ERV Expiratory reserve volume
FDG Fluorodeoxyglucose
FEV1 Forced expiratory volume in one second
FENO Fractional exhaled nitric oxide
FGRE Fast gradient recalled echo
FOV Field of view
FRC Functional residual capacity
FVC Forced vital capacity
GEHC General electric health care
GOLD Global initiative for chronic obstructive lung disease
GUI Graphical user interface
HIPAA Health insurance portability and accountability act
HRCT High resolution computed tomography
HU Hounsfield units
IC Inspiratory capacity
ICC Intraclass correlation coefficient
LAC Low attenuation cluster analysis
MANOVA Multivariate analysis of variance
MLD Mean lung dose
mMRC Modified medical research council
MRI Magnetic resonance imaging
PCA Principal component analysis
PET Positron emission tomography
PFT Pulmonary function test
PIPEDA Personal information protection and electronic documents act
xix
RF Radiofrequency
RV Residual volume
SGRQ St. George’s respiratory questionnaire
SNR Signal-to-noise ratio
SPECT Single photon emission computed tomography
SpO2 Oxygen saturation on pulse oximetry
TCV Thoracic cavity volume
TE Echo time
TLC Total lung capacity
TR Repetition time
TV Tidal volume
VC Vital capacity
WHO World health organization
1
CHAPTER 1: Introduction
1.1 Overview and Motivation
Chronic Obstructive Pulmonary Disease (COPD) is currently the fourth leading cause of
death worldwide.1 Its prevalence and mortality rates continue to rise and COPD projected
is to be the third leading cause of death by 2020.2 In Canada, this disease affects at least
one million people3 and is directly responsible for over 10,000 deaths and 100,000
hospitalizations annually, costing over $5 billion per year in estimated direct and indirect
costs.3,4 The worldwide Burden of Obstructive Lung Disease (BOLD) study recently
reported that 10% of the world’s adults 40 years and older have clinically relevant
COPD.5,6 COPD is characterized by persistent airflow limitation in which small airways
disease and parenchymal destruction, or emphysema, are the most important underlying
mechanisms.7 The future morbidity and mortality of COPD patients can be reduced by
early detection of the disease and the rate of its progression can be decelerated through
smoking cessation.8,9
Pulmonary function tests (PFT) widely used in respiratory clinics, such as spirometry,
provide established measurements of lung function that are widely accepted for the
diagnosis and monitoring of COPD;10,11 however, these tests are insensitive to early
disease changes, progression of the disease and response to treatments.11,12 Moreover,
these tests provide only global measures of lung function and no regional information
about the anatomical structure of the lung can be acquired. Imaging tools that are
currently available have the potential to provide regional information about lung structure
and function and can be utilized as a sensitive tool for detecting and monitoring small
2
provides regional anatomical information and can be used to evaluate COPD
abnormalities in the airways,13-15 regional evaluation of gas trapping16,17 and
quantification of lung tissue structure alterations.18-24 Conventional proton magnetic
resonance imaging (1H MRI) is also readily available in most clinical care centers and
can be used for qualitative25,26 and quantitative27-29 evaluations of lung structure.
This thesis focuses on the application of quantitative measurements of lung structure
derived from 1H MRI and high resolution CT in subjects with a smoking history of at
least 10 pack-years to differentiate between normal lung and emphysematous lung. In
order to test the capability of differentiating between emphysematous and healthy lungs,
1
H MRI were acquired using the short echo time (TE) pulse sequence and novel objective
and subjective quantification tools and techniques were developed to evaluate lung CT
images. Chapter 1 provides a foundation for understanding the lung structure and
function in healthy and COPD subjects. This chapter addresses the literature related to
the basics of COPD physiology, diagnosis and treatment options as well as reviewing the
subjective and objective methods for quantification of pulmonary emphysema. Finally,
an overview of the hypothesis and objective of this thesis related to quantification of
pulmonary emphysema using 1H MRI and CT is described.
1.2 Lung Structure and Function
The respiratory system is responsible for gas exchange and its main task is to allow
oxygen to move from air into the blood and allow carbon dioxide to move out from blood
into the air. Failure of the respiratory system can cause rapid cell death due to oxygen
starvation.30 The respiratory system is separated into two main divisions: the conducting
3
1.2.1 Conducting zone
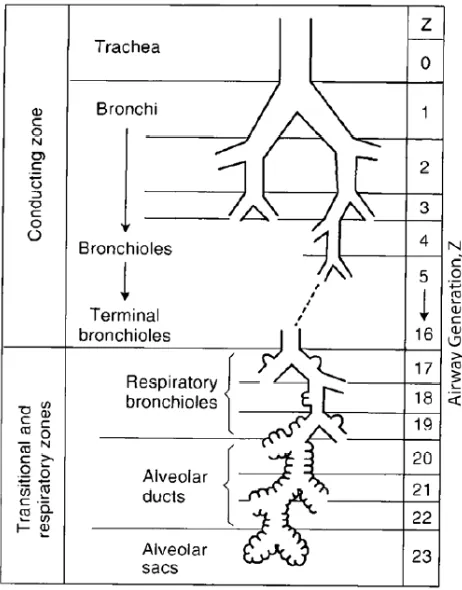
Airways in the conducting zone start from the trachea and continue down to terminal
bronchioles, which are the smallest airways without alveoli (Figure 1.1). The trachea
divides into a pair of primary bronchi where each left and right bronchus supplies air to
each lung. Within the lung and up to the 11th generation, each bronchus repeatedly
divides into smaller bronchi.31 The smallest bronchi divide into the first bronchioles in
the 12th generation and, while they continue to branch, their diameters continue to
decrease.31 Conducting bronchioles start from the 12th generation and continue to the 16th
generation.32 Distal to the 16th generation, conducting bronchioles turn into respiratory
bronchioles where alveoli start to appear in the walls of the airways.32
The main responsibility of the conducting airways is to carry air to and from the
respiratory zones. Since there are no alveoli in the conducting zone, no gas exchange
occurs in this region and, therefore, this is called the anatomical dead space. However,
anatomical dead space takes up only 150 ml (3% of human lung volume) and the
respiratory zone takes up the rest of the lung volume, maximizing the gas exchange area
4
Figure 1.1: Human airway tree by generation
Image adapted from West JB, Respiratory Physiology Eighth Edition33. Conducting zone starts from trachea (generation zero) and continue down to terminal bronchioles (16th generation). Respiratory zone starts from respiratory bronchioles (17th generation) and continue down to alveolar sacs (23th generation).
1.2.2 Respiratory zone
The respiratory zone is the region of the lung where gas exchange takes place. This Zone
starts at the respiratory bronchioles (17th generation) and continues down to the alveolar
sacs (23rd generation). As shown in Figure 1.2, alveoli are the sites for gas exchange in
the lung and they start to appear in the respiratory bronchioles wall. Their numbers
continue to increase as we move toward to the higher generation airways. On average,
5
It has been shown that there are about 170 alveoli per mm3 and an average human lung
contains 240 – 790 million alveoli.34
Proper gas exchange is essential and needs to be performed continuously. Therefore, the
blood-gas interface plays an important role in this task. Gas-exchange between lung and
blood is carried out by transmembrane diffusion of oxygen and carbon dioxide. Fick’s
law of diffusion states that the amount of diffusion is proportional to the surface area of
the membrane and inversely proportional to the thickness of the surface.33 The gas
exchange surface in the human lung is very thin and an average person has a total surface
area of 70 square meters,35 which makes the lung an ideal place for gas exchange.
Figure 1.2: Lung function
Air comes from nasal cavity and ultimately goes into alveoli. Alveoli are sites of O2 and CO2
exchange with the blood. Diagram of alveoli adapted from an online source36. Image of the gas exchange across capillary and alveolus wall adapted from37.
1.3 Chronic Obstructive Pulmonary Disease (COPD)
Chronic obstructive pulmonary disease (COPD) is characterized as a progressive airflow
limitation and is associated with the inflammatory process of the respiratory system
6
leading cause of death and mortality and morbidity continue to increase.39,40 In Canada,
1.5 million people have been diagnosed with COPD,41 which leads to thousands of
hospitalizations with a total cost of $1.5 billion a year.42 However, another 1.6 million
Canadians report having symptoms but have not been diagnosed with COPD.41
Introduction of noxious gases into the respiratory system can lead to a chain of reactions
that ultimately may result in the development of COPD. Noxious gas, in particular,
tobacco smoke, is responsible for chronic inflammatory response in the airways and lung
tissue, which leads to airflow limitation.10,43 Chronic inflammation is the main reason for
development of COPD that encompasses some pathological changes in different areas of
the respiratory system, including central airways, small airways, lung tissue and
pulmonary vasculature.38 However, small airway disease and lung tissue destruction are
the two main underlying mechanisms of airflow limitation7 and will be discussed in more
detail in the next two sections. Inflammation in the central airways results in chronic
bronchitis, which is accompanied by excessive mucous production.38 Central airways
refer to cartilaginous airways with an internal diameter greater than 2 mm.38 Small
airway obstruction is the consequence of inflammation in noncartilaginous airways with
an internal diameter of less than 2 mm.38 Inflammation in lung parenchyma can result in
pulmonary emphysema, which is defined as an abnormal enlargement of the airspaces
distal to the terminal bronchioles.44 Development of COPD, even in the early stages, can
lead to some changes in pulmonary vasculature, including vessel wall thickening and
endothelial dysfunction.38,45
Chronic cough, shortness of breath and sputum production are the common symptoms of
7
spirometry.47 Forced expiratory volume in one second (FEV1) and forced vital capacity
(FVC) are two main measurements that can be performed using spirometry. To confirm
the presence of COPD, the post-bronchodilator FEV1/FVC < 70% needs to be achieved.38
COPD can also be classified into four groups: mild, moderate, severe and very severe
(Table 1).
Table 1.1 COPD classification based on spirometry
COPD severity Post-bronchodilator FEV1/FVC FEV1% predicted
Mild < 70% ≥ 80%
Moderate < 70% 50% - 80%
Severe < 70% 30% - 50%
Very severe < 70% < 30%
Table adapted from ATS/ERS Standards for the diagnosis and managements of patients with COPD.38
1.3.1 Small Airways Disease
Smoking and inhalation of noxious particles and gases leads to the inflammatory process
in the lung,46 which results in obstruction of small peripheral airways.48-50 Airways
smaller than 2 mm in diameter are the major site of airway obstruction in COPD.49,51
Moreover, small peripheral airways including bronchioles, lack cartilage32 and their
structure is supported by lung parenchyma and alveolar structure.38,52 Destruction of
alveolar walls that support small airway structures52 and contribute to elastic recoil of
lung parenchyma53 along with airway narrowing,54 contribute to an increase in resistance
8
Direct evaluation of the inflammatory changes of the airways using biopsy and indirect
evaluation using bronchoalveolar lavage (BAL) have confirmed the inflammatory
response of the airways to noxious particles and gases especially cigarette smoke, even in
subjects with normal lung function.46,55
1.3.2 Parenchymal Destruction
Parenchymal destruction, or emphysema, has been defined as “abnormal permanent
enlargement of airspaces distal to terminal bronchioles, accompanied by destruction of
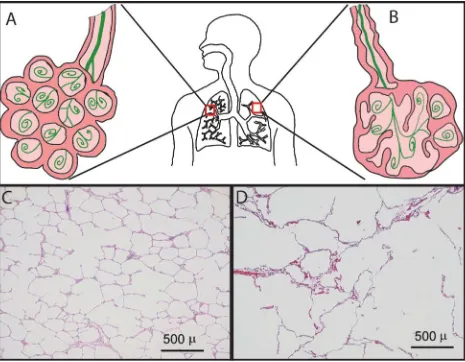
their walls without obvious fibrosis.”44 As shown in Figure 1.3, enlargement of the
airspaces is mainly due to alveolar wall destruction and ultimately results in the reduction
of the gas exchange area in the lung. This will reduce the amount of gas that can diffuse
from alveoli to the blood stream and vice versa. Moreover, the chronic inflammation of
lung parenchyma can lead to destruction of the attachments between the respiratory
bronchioles and the surrounding tissue.56 Since bronchioles do not have cartilage in their
wall and the attachment between their wall and surrounding tissue helps keep them open,
any rupture or breakage in the alveolar wall or between these attachments can lead to
9
Figure 1.3: Healthy and emphysematous alveoli
Schematic of normal and emphysematous alveoli are shown in A and B. (A): Normal alveoli with healthy walls, (B): Airway with thickened wall and emphysematous alveoli with destructed walls and less gas tissue interface. Histological slice of a (C) healthy lung tissue and (D)
emphysematous lung tissue were adapted from Woods et al.57 Magn Reson Med. 2006;
56(6):1293-300.
Pulmonary emphysema can be classified into two main types: panacinar emphysema and
centrilobular emphysema. Panacinar emphysema uniformly affects the entire respiratory
acinus and results from α1-antitrypsin deficiency58 and it predominantly affects the lower
lung regions.59 On the other hand, centrilobular emphysema refers to airspace wall
10
and occurs more frequently in the upper lung region when it is in its mild stage62.
Noxious particles and gases contribute to the inflammatory process in the lung that was
mediated by immunological cells such as alveolar macrophages, T lymphocytes and
neutrophils.47,63,64 Proteolytic enzymes that have been released by these immune cells
result in destruction of the alveolar walls and enlargement of the airspaces.62
1.4 Evaluation of COPD in Clinical Practice
1.4.1 Pulmonary Function Tests
Pulmonary function tests allow us to measure the static and dynamic lung volumes as
well as the lung’s capacity for transmembrane gas diffusion. Plethysmography can
measure and record the static lung volumes at predetermined points during the respiratory
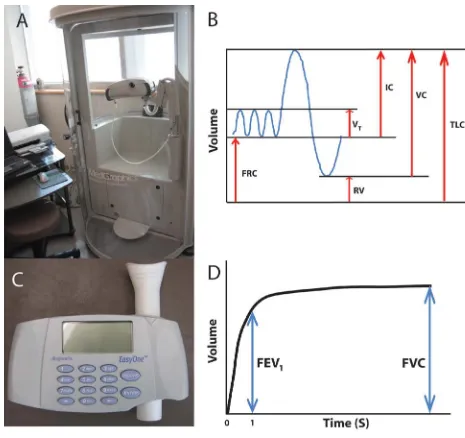
maneuver (Figure 1.4). Total lung capacity (TLC) is defined as the volume of gas in the
lungs at full inflation and the amount of gas that remains in the lungs after full expiration
is called residual volume (RV).33 Functional residual capacity (FRC) is the gas volume
remaining after a normal expiration of the lung. This is a volume where there is a
balance between the chest wall and lung elastic recoil.33 Body plethysmographs measure
the FRC by applying Boyle’s Law while the subject is in a large airtight box. A shutter
present in a mouth piece can measure the pressure of the lung while the subject tries to
inhale at the end of a normal expiration. Boyle’s Law states that, at a constant
temperature, the product of volume and pressure is constant, and since the lung tries to
expand while the shutter is closed, by measuring the lung pressure at the shutter we can
calculate the lung volume at the end of normal expiration.33 Tidal volume (VT) is also
defined as the volume of the gas that goes in and out of the lung while the subject
11
amount of gas that can be inhaled after a normal expiration is called inspiratory capacity
(IC) and the total amount of gas that someone can exhale after a full inspiration is called
vital capacity (VC).
Dynamic lung volumes can be assessed by measuring the amount of gas that someone
can forcefully exhale using spirometry (Figure 1.4). The breathing maneuver for
spirometry starts from inhalation of air up to TLC followed by forceful exhalation to RV.
The volume of gas that is exhaled in the first second of exhalation is called forced
expiratory volume in one second (FEV1) and the total volume of gas that is exhaled from
the lung is called forced vital capacity (FVC). The ratio of FEV1 over FVC is accepted as
a criterion for diagnosis of COPD.38,47 In a healthy individual, this ratio is above 70% but
in obstructive diseases, such as COPD, air trapping and increased residual volume and
severe airflow obstruction cause reduction in FEV1 and FVC. However, FEV1 reduction
is greater than the decrease in FVC, which results in lower FEV1/FVC. Reductions in the
elastic recoil of the lung, along with increase in the airway resistance, are the main causes
12
Figure 1.4: Pulmonary function testing
(A) A whole body plethysmograph. Lung volumes shown in (B) were measured using plethysmography. (C) A hand held spirometer. A sample airflow curve measured by spirometry is shown in (D).
Measurements of diffusion capacity of the lung for carbon monoxide (DLCO) enable the
evaluation of the lung’s capacity for transferring CO from airspaces into the pulmonary
capillaries. Many factors can influence the diffusion capacity of CO, including blood
13
subjects inhale a mixture of gases, including CO, a tracer gas, and a mixture of O2 and N2
and hold their breath for about 10 seconds before exhaling into the mouth piece. The
concentration of CO is then measured from the exhaled gas after the volume of the gas in
the dead space has been discarded.66 The tracer gas, which is included in the gas mixture,
cannot be absorbed by blood and should be chemically and biologically inert.66 The
initial concentration of CO in the alveoli will not be the same as its concentration in the
mouth piece during the inhalation. This is because of its dilution with the remaining
gases in the alveoli. Since the tracer gas cannot be absorbed by blood, the concentration
of CO in the alveoli can be measured by calculating the difference between the
concentration of inhaled and exhaled tracer gas.33
1.4.2 Measurements of Dyspnea
Dyspnea, or breathlessness, is a subjective experience for individuals who complain of
uncomfortable breathing.67 Different questionnaires have been developed for
quantification of dyspnea, and a few of them will be discussed in the next paragraph. The
results of these questionnaires depend on how subjects can describe their feelings while
performing daily tasks. Another way of assessing dyspnea is through exercise tests
where subjects are asked to perform an exercise in a controlled fashion. These tests are
accompanied by a scaled questionnaire, such as BORG scale, for rating the dyspnea.68
The Borg scale is a table with numerical values for evaluation of dyspnea that starts from
zero for no dyspnea or shortness of breath to 10 for maximum dyspnea.69
The modified medical research council (mMRC) dyspnea scale was designed for
evaluating the level of dyspnea or shortness of breath. In this questionnaire that includes
14
their shortness of breath.70 St. George’s Respiratory Questionnaire (SGRQ), is a more
complete survey which was developed for subjects suffering from airflow limitation. The
survey aims to address three areas related to their disease, including symptoms, activities
related to breathlessness and daily life disturbances.71 This is a questionnaire that
includes 76 items that need to be filled by the subject, and takes about 10 minutes to
complete.71
The Six Minute Walk distance (6MWD) refers to an objective test that measures the
distance that a subject can walk in 6 min.72 There is a relationship between the ability of
the subjects to perform this test and quality of their life.73 It has been shown that 6MWD
can also predict the risk of hospitalization in subjects with COPD.74 The rate of dyspnea
and overall fatigue should be measured at baseline and after the 6MWD test using the
Borg dyspnea scale.72
The BODE index is used to help predict the mortality of COPD, with higher scores
related to higher risk of death after diagnosis. It includes: body-mass index (BMI), the
degree of airflow obstruction and dyspnea, and exercise capacity.75 The degree of
airflow limitation will be determined using FEV1 % predicted, dyspnea will be assessed
using mMRC dyspnea scale and exercise capacity will be evaluated using 6MWD. BMI
in the BODE index has the score of 0 or 1 and the other three sections have scores
15
1.4.4 Fractional exhaled nitric oxide (FENO)
Nitric oxide (NO) is produced by inflammatory cells in human lungs and presents in the
exhale breath. Chronic inflammation of the airways will increase the amount of NO,
which has been recognized as a biological mediator.76 The fractional exhaled nitric oxide
(FENO) is a quantitative and non invasive method for evaluation of airway
inflammation.77 In FENO, subjects are asked to exhale their breath into a device where
the NO molecules produce light during a chemical reaction. The number of photon
emitted during the reaction is proportional to the number of NO molecules present in the
exhale breath. However, measurement of exhaled NO may be affected by some factors
such as current smoking78 and needs to be considered in subjects with COPD. It has been
shown that there was a correlation between the changes in the amount of NO and the
number of neutrophils76 as well as association between the variability in measurement of
FENO and number of exacerbations in COPD subjects.79 However, the application of
FENO in subjects with COPD is not established yet and its exact role needs to be
defined.77
1.4.5 Bronchial alveolar lavage (BAL)
Inflammation of the respiratory system, especially airways, is one of the biomarkers of
COPD. Bronchial alveolar lavage (BAL) enables researchers to measure the
inflammatory response of the airways and provide a better understanding of the disease
and related treatments.62 The amount of inflammatory cells and proteins that are
contained in the pulmonary secretions can be measured using BAL.80 While direct
visualization of the lumen of the airway is possible using flexible fibre-optic
16
small amount of sterile saline is flushed into the desired airways and then drawn back.73
These samples that contain cells and proteins is sent to a laboratory for further analysis
under microscope.73 Since this is an invasive method, it cannot be used for monitoring
the disease in short time intervals and it cannot be tolerated by patients with moderate to
severe COPD stages. Therefore, BAL studies are mainly limited to patients with mild to
moderate stages of COPD.62
Induced sputum is another way of evaluating airway inflammation. This a non-invasive
and inexpensive method that can applied on patients repeatedly with moderate to severe
COPD.62 Induction of sputum can be performed by inhalation of hypertonic saline
followed by a cough of a sample of sputum for further analysis.73 However, these tests
cannot provide any regional information about the affected areas of the lung.
1.5 Imaging the Lung
1.5.1 Chest x-ray
X-ray radiography is the most common and inexpensive type of imaging for the
evaluation of pulmonary structure. Image formation in x-ray radiography depends on the
contrast between materials that x-ray photons travel through. Image contrast is dependent
on the mass attenuation coefficient of the tissue which varies with photon energy, atomic
number and mass density of the absorbing material. Bony tissues in the body absorb
much of the x-rays and appear white on the x-ray images; therefore, sufficient effort is
needed to avoid their presence in the lung field-of-view (FOV) in chest radiography. For
example, one of these bony tissues that may appear in a chest radiograph is the scapula,
where subjects are coached to place their hand on the back of their hip and gently move
anterior-17
posterior (AP) acquisition.81 In another example, when it is necessary to acquire a lateral
chest radiograph for sagittal evaluation of the lungs, subjects are asked to put their hands
on top of their head to minimize the presence the hand’s bones in the FOV.81
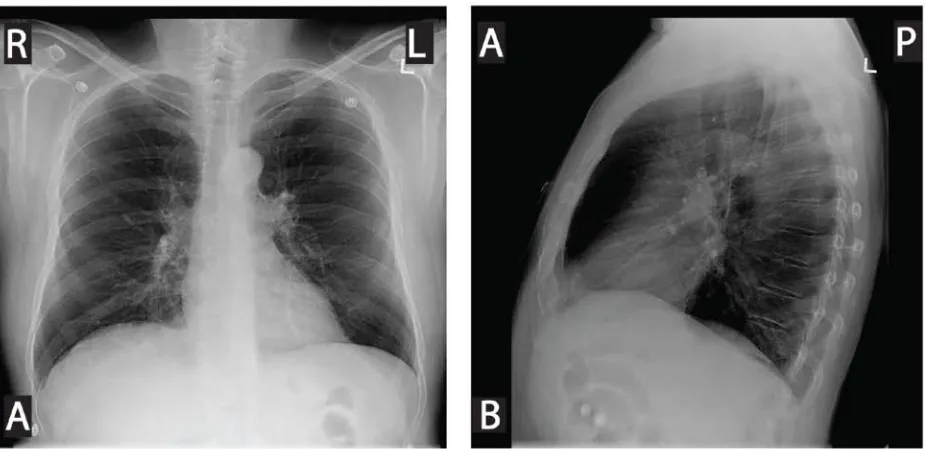
Figure 1.5: Chest x-ray of a COPD subject
X-ray radiograph chest images of 62 year-old male with severe COPD. (A) Coronal view, (B) Sagittal view. Images adapted from Parraga et al.82 Invest Radiol. 2007; 42(6):384-91.
Lung linear attenuation coefficient is defined as µ = (µ/ρ) x ρ, where (µ/ρ) is the mass
attenuation coefficient and ρ is the physical density of the absorbing material. Lung
linear attenuation is relatively low in comparison to its surrounding tissue, mainly
because it is filled with air, which has a very low physical density. The average radiation
dose associated with a normal chest x-ray is about 0.02 mSv,83 which is equivalent to the
background radiation dose in 2 days when considering an average background radiation
dose of 0.01 mSv/day84. This is a relatively small radiation dose, which adds to the other
18
these advantages, diagnostic information of respiratory diseases provided using chest
radiographs is restricted due to limited soft tissue contrast and superposition of bones,
tissues and air in the path of x-ray. Therefore, its application especially in COPD is more
prone toward the assessment of more advanced morphological changes in the lung.85
Figure 1.5 shows a flattened diaphragm and overall increase in the anterior-posterior
diameter of the chest in a patient with severe COPD.
In COPD and especially in emphysema, x-ray radiography can be used to assess some
classical features including hyperinflation and detection of bullae. In an AP view of a
chest x-ray, it has been shown that an increase in the diameter of the chest and flattening
of the diaphragm are correlated with the presence of COPD.85 Other features including a
reduction in pulmonary blood flow associated with emphysema86 and airway thickening
in chronic bronchitis87 can be detected in x-ray radiography, but presence of
hyperinflation in subjects with COPD is the most useful feature for detection of
emphysema88.
1.5.2 X-ray Computed Tomography
The introduction of computed tomography (CT) in the 1970s as a novel imaging
technique has revolutionized the field of diagnostic imaging in medicine. Image
formation in CT is based on tomographic reconstruction of internal structure from
information acquired through multiple projections of an object.89 In each projection, a fan
beam of photons from a x-ray source is transmitted through a desired object and some of
those photons that have not been completely attenuated and penetrated through the object
can be received by arrays of multiple detectors.89 Following the acquisition of multiple
19
subsequently, multiple adjacent 2D slices can be reconstructed into a 3D volumetric
image of the object. In CT each pixel is labeled with a value that is determined by the
average linear attenuation coefficient of the corresponding region in the object. One of
the main advantages of CT over the other imaging modalities, is the ability to provide
images with standard pixel values in a unit called the Hounsfield unit (HU), which is
named after an inventor of computed tomography, Sir Godfrey Hounsfield.90 HU is a
scale used in CT to convert the linear attenuation coefficient measurements of an object
into a universal radio-density scale as shown in equation 1:
where µx and µwater are the linear attenuation coefficients of object and water,
respectively. Standardized pixel values provide the opportunity for direct comparison of
pixel intensities of a same region that were acquired from different scanners with
different manufacturers.
The development and improvement of CT over the last four decades provides the
capability of volumetric imaging of lungs within a single breath-hold. Rapid image
acquisition with high spatial resolution makes this modality an ideal tool for assessment
of pulmonary structure, in particular when most pulmonary images are acquired in
breath-hold condition.91 However, development of four-dimensional CT (4DCT)
provides the opportunity for acquiring images in free breathing style. 4DCT not only can
provide information about lung tissue structure, but also can provide the opportunity to
acquire ventilation maps for functional regional evaluation of the respiratory system
time-20
points of the breathing cycle.92-94 These ventilation maps that have been generated after
post processing of dynamic CT images, have been validated against nuclear medicine
approaches, which is the standard method for regional evaluation of ventilation maps.95
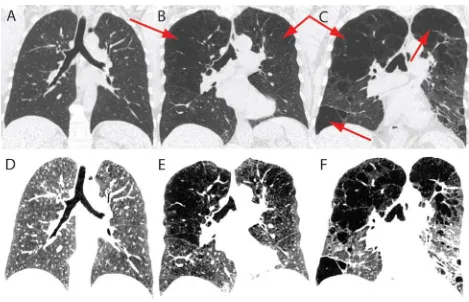
Figure 1.6: X-ray CT of healthy and emphysematous lungs
Lower row displays the same images as upper row in a different window and level. Coronal center slice CT images for a healthy volunteer (left panel), GOLD stage III COPD subject (middle panel) and GOLD stage IV COPD subject (right panel). Emphysematous regions are indicated by arrows. Images A-C are displayed in the standard Lung window (=1500 HU) and level (=-600 HU) and images D-F are the same images displayed in a deferent window (=280) and level (=-850) to highlight the emphysematous regions that are pointed to with arrows in the upper panel.
CT is an established imaging tool for detection and diagnosis of different lung diseases.
It can also be used for quantification and follow-up assessment of structural pulmonary
21
of many lung diseases. In COPD studies, CT has a very important role for detecting and
quantifying different structural abnormalities that leads to airflow limitation. One of
these structural abnormalities is pulmonary emphysema, which CT plays an important
role in its quantification. Representative center slice CT images of lung for a healthy
volunteer and COPD stage III and IV subjects are shown in Figure 1.6. Such CT images
are routinely used to qualitatively detect and evaluate pulmonary emphysema.
1.5.3 Nuclear Medicine Methods
In nuclear medicine, radioactive material(s) administered into body will be absorbed by
different organs.96 Regions with radionuclide uptake will become active sources that
emit gamma rays; however, information acquired from these regions depends on the
distribution of the radioactive nuclei in the organs. To guide and control the pathway of
the administered radionuclide, they are usually attached to molecules that most probably
will be absorbed by the organ that needs to be imaged. This will help to increase the
concentration of radionuclide in the organ of interest and reduce contamination of other
organs in the body.96 The number of gamma rays emitted from any organ, depends on
the concentration of the radioactive materials and the rate of their decay. In nuclear
medicine, the challenge is to find the spatial distribution of the radioactive material rather
than finding the map of attenuation coefficient like in CT.
All radioactive nuclei that are used in nuclear medicine emit gamma rays and some of
those gamma rays that can leave the body, will be captured by gamma cameras.96 For a
projection image to be formed, in addition to the measurements of photon flux density,
the direction of the detected photons needs to be determined.96,97 In planar scintigraphy,
22
interest. However, it is also possible to generate the volumetric image of the radioactivity
distribution by acquiring multiple planar projection of the organ at different angles using
single photon emission computed tomography (SPECT).98 These planar projections will
be used to reconstruct the tomographic images of the radioactivity distribution.98
In lung imaging, nuclear medicine techniques have been developed to study lung
perfusion and ventilation. These methods allow for regional evaluation of pulmonary
function. Ventilation images in SPECT and planar scintigraphy can be performed using
radioactive gases including xenon and krypton (133Xe, 127Xe and 81mKr) or aerosols that
are labeled with radioactive nuclei such as technetium-99m (99mTc).99 The distribution of
the aerosols in the respiratory system is mainly dependent on their particle sizes.100 The
ideal size range for the aerosols is between 0.1 to 0.5 µm and particles larger than 2 to 3
µm have less chance of passing through large airways.99 Ventilation imaging can be
performed in three phases of wash-in, steady state and wash-out using 133Xe, where
regional lung volume and regional gas trapping can be studied.99 In nuclear medicine,
radiation dose exposure to the patient starts from the point the radioactive material
administered to the body and continues to decrease until it is completely washed out of
the body or physically decays. Effective radiation dose in ventilation imaging ranges
between 0.1-0.6 mSv, depending on the protocol and the type of radioactive gas or
aerosol that is used.101
Perfusion is another parameter for the assessment of lung function, which can be
performed by intravenous injection of 99mTc-labeled macro-aggregates albumin (MAA).
The sizes of these particles are between 3 to 150 µm with 95% of them being between 3
23
demonstrate regional pulmonary perfusion.99 However, 99mTc-labeled MAA particles can
mainly provide images of the relative pulmonary arterial blood flow because the sizes of
many of these molecules are greater than the internal diameter of the arterioles and
cannot pass through them to reach the pulmonary veins.101 In a normal procedure, about
200 000 particles will be injected, which may block less than 0.1% of the total number of
arterioles.101 After a few hours post injection, macrophages will break up the MMA
particles and pass them through the arterioles and full perfusion of those blocked regions
will be restored.101 Effective dose in perfusion imaging using 99mTc-labeled MAA is
typically 1.0 mSv.101
Planar scintigraphy and SPECT work with radio isotopes (e.g. 99mTc) that emit single
gamma ray photons in each radioactive decay. However, some other isotopes that emit
positrons can be used in another nuclear medicine imaging modality, which is called
positron emission tomography (PET). Isotopes such as 11C, 13N, 15O, 18F, 19Ne, and 68Ga
emit positrons,103 which after several collisions with surrounding particles, its kinetic
energy approaches to zero. During an annihilation interaction of a zero-energy positron
with a neighbouring electron, two 511 keV photons are produced and travel 180 degrees
apart from each other.104 Simultaneous production of photons that travel in opposite
directions from each other and coincidence detection of them in detector arrays
surrounding the patient eliminate the need for collimation because the source of these
24
Figure 1.7: PET/CT image of healthy volunteer and subject with lung cancer
Coronal lung PET/CT images (A) healthy volunteer and (B) a subject with lung cancer. Images are courtesy of Harry Marshall.
PET is a great imaging modality for studying lung function, because it can provide
volumetric information about the distribution of the inhaled or injected
radioisotopes.103,105 Moreover, most positron emitting radioisotopes have a short
half-life, which minimizes the radiation exposure to the subjects. One of the longest half-life
among positron emitting radioisotopes belongs to 18F, which is 110 minutes. This
radioisotope can also be combined with deoxyglucose, to form 18F-fluodeoxyglucose
(FDG), which is one of the most common radioactive tracers for PET imaging. Coronal
PET/CT images of a healthy volunteer and a subject with lung tumor are shown in Figure
1.7. Although FDG cannot be metabolized, its uptake is similar to glucose and will be
increased in lungs as a result of airway inflammation caused by neutrophilic
infiltration.105
Nuclear medicine imaging techniques have been used for regional evaluation of lung
function in COPD. These methods have been used to find areas of the lungs in COPD
25
ventilation106. It has also been shown that there was a significant correlation between
radioactive aerosol ventilation imaging and pulmonary function tests.107 PET imaging
can also be used for differentiating emphysematous COPD subjects that have lower tissue
density and higher ventilation/perfusion ratio and COPD subjects with airway disease
that have lower ventilation and higher pulmonary blood flow.108
1.5.4 Magnetic Resonance Imaging
The lung is one of the most difficult organs to image with MRI. Proton (1H) MRI of the
lung is challenging mainly because of some conditions of the respiratory system. First,
the low tissue density and the proton density of the lung reduce the signal intensity (SI)
that can be acquired from lung.109 Second, the countless number of air-tissue interfaces
in the lung causes magnetic field inhomogeneity and high MR susceptibility artifact,
which leads to extreme reduction of T2* and rapid decay of the acquired signal from lung
tissue.110 Lastly, the movement of cardiac and respiratory systems causes motion
artifacts in the MRI images.109 However, there are some approaches to mitigate these
challenges.
The development of more powerful hardware along with faster pulse sequences enables
detailed imaging of pulmonary structure that is comparable with other imaging modalities
such as CT.26,111 For instance, minimizing the rapid signal decay of tissues with very
short transverse relaxation time (T2*) currently is feasible using faster pulse sequences
with short and ultra short echo time (UTE).112-114 In some studies, the subtraction
between images that have been acquired using UTE and those acquired using higher TE
has shown the enhancement of organs with very short T2*.115,116 In a study by Failo et al.
26
be acquired in subjects with cystic fibrosis (CF) using a short TE pulse sequence.25 In
general, higher signal intensity can be achieved using pulse sequences with shorter TE
than conventional pulse sequences that employ longer TE.
To minimize the motion artifact caused by the movement of the respiratory system, lung
MRI protocols were designed based on breath-hold techniques117, even though this
method will impose a time limit on the duration of image acquisition. Respiratory
motion artifacts in free breathing protocols can be partially eliminated118 using gated
imaging techniques, but standard clinical protocols are mainly based on breath-hold
methods.
In MRI imaging, lung diseases can be divided into two groups. Some diseases, such as
lung cancer, liquid infiltration or cell accumulation in the airways, will increase the
proton density of the lung. The increase of proton density, usually accompanied by a
reduction in air-tissue interfaces, will increase the lung signal intensity.119 Visual
assessment of such diseases is often not difficult because they provide a high contrast
against the dark background lung tissue.120 On the other hand, some pathologies such as
hyperinflation due to airway obstruction and emphysematous destruction in COPD will
cause the loss in lung tissue as well as reduction in blood volume flow, which both
contribute to reduction in proton density and MRI signal intensity.117 It has been shown
that airflow obstruction and the level of hyperinflation have a negative relationship with
27
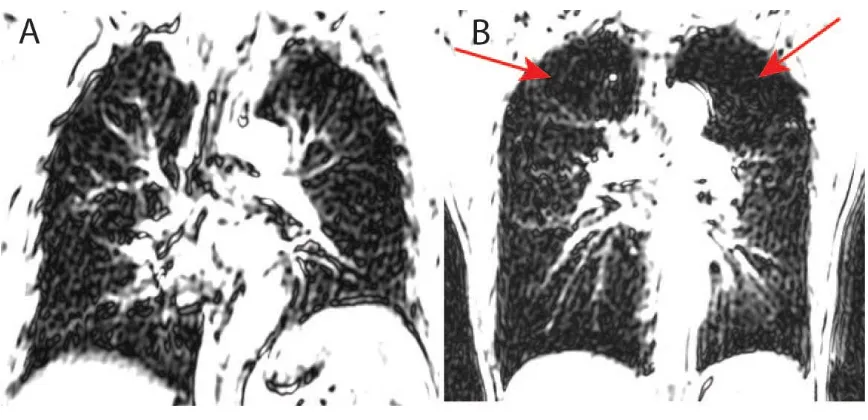
Figure 1.8: Conventional 1H MRI of healthy and emphysematous lungs
Conventional pulmonary 1H MRI of the lung (A) healthy volunteer and (B) COPD subject. Although, lung 1H MRI images are affected by low proton density and high susceptibility artifacts, short TE MRI can provide regional information regarding the emphysematous destruction of the lung tissue as indicated by arrows.
Regional functional assessment of pulmonary ventilation is important for the evaluation
of different pathological conditions and pathophysiological analysis of different
respiratory diseases. One of the main advantages of MRI is to provide functional
information as well as structural information without using any ionizing radiation. The
combination of functional and structural information with high spatial and temporal
resolution for the entire lung are the main advantages of MRI over the other imaging
modalities. This is mainly beneficial for imaging of children and young adults who are
more susceptible to ionizing radiation121-123, as well as follow-up monitoring of subjects
who are undergoing medical examinations and clinical trials.124
Over the past decade, there were several studies using different MRI techniques for
28
decomposition techniques allows for direct imaging of pulmonary ventilation.125 This
technique uses a 2D fast steady state pulse sequence for functional assessment of
pulmonary ventilation and perfusion without using any contrast agent125 and has been
validated against other imaging techniques including SPECT and CT126.
Oxygen-enhanced lung MRI127 along with hyperpolarized noble gas MRI have also played an
important role in developing our understanding of lung physiology,57 lung tissue structure
and function in COPD.82,128 Oxygen-enhanced MRI was first introduced by Edelman et
al. as a new method for regional evaluation of pulmonary ventilation using molecular
oxygen (O2) as a contrast agent.129 O2 molecules are slightly paramagnetic and their
presence will shorten the longitudinal relaxation time (T1) of protons in lung tissue.130,131
The amount of oxygen that presents in each lung region not only depends on the
ventilation of oxygen in that region of interest, but also depends on the diffusion of
oxygen molecules into capillaries and perfusion of blood in the pulmonary system.131 It
has been shown that oxygen-enhanced MRI has a significant correlation with spirometry
results (i.e. %FEV1 and FEV1/FVC) and %DLCO.132,133
Hyperpolarized noble gas MRI has emerged as a robust imaging technique, which gives
us valuable information about lung tissue structure and function.82,134,135 This method
was first introduced by Albert et al.136 in 1994, showing the feasibility of using 129Xe as a
contrast agent for MRI imaging in an ex-vivo mouse model. 3He and 129Xe are noble
gases with intrinsic spin of ½ and can be polarized using a laser optical pumping
method.136,137 In conventional MRI, the external magnetic field forces the 1H nuclei to be
aligned in the direction of the magnetic field, where the number of parallel alignments are
29
over anti-parallel alignments produces a small polarization, which is however
accompanied by a large abundance of 1H nuclei in the body to produce adequate signal.
However, in hyperpolarized noble gas MRI the low density of inhaled gas can be
compensated by increasing the polarization of the gas prior to inhalation.
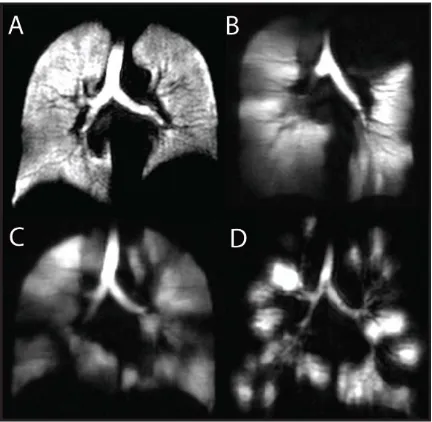
Figure 1.9: Hyperpolarized 3He MRI of a healthy volunteer and subjects with different lung diseases
30
Nuclear polarization of the noble gases can increase the ratio of parallel over anti-parallel
alignments of the nuclei up to 100 000 times compared to conventional MRI
polarization.136 During the polarization process, rubidium (Rb) vapor that is mixed with
noble gas atoms in a container will be bombarded by the circularly polarized laser. The
absorption of laser light by the Rb atoms polarize them along a small external magnetic
field that exists in the polarizer. In duration of 6-8 hours, a polarization of 10-25% can
be achieved for the noble gas atoms as a result of the collision with Rb atoms.138
Hyperpolarized noble gas MRI can be utilized to acquire both functional and structural
information of the pulmonary system using two different imaging techniques. Since the
development of these MRI methods, several studies have been performed to measure
pulmonary structure and function. For functional information, spin density imaging
provides high resolution information about the distribution of gas in the lung. In other
words, the signal intensity of each region in the lung represents the abundance of gas
molecules in that region. Normal lung function in healthy subjects can be characterized
by homogeneous distribution of the gas in the lung; however, in diseases, heterogeneous
distribution of the gas can be characterized as presence of regions with no signal or low
signal intensity.
The safety of both 3He and 129Xe have been examined and high subject tolerability was
shown with the prescribed doses of gas.139-141 Normal ventilation in healthy volunteers
was shown by Kauczor and co-workers with homogenous high signal intensity and
inhomogeneous signal intensity was shown for subjects with COPD and bronchogenic
carcinoma.142 Since then, several groups have used this technique to study a variety of