Measuring and Comparing Taxi Emissions with Privately Owned Vehicles in an
Urban Environment using a Remote Sensing Device
Christopher Rushton1* and James Tate1
1
Institute for Transport Studies, University of Leeds, Leeds, West Yorkshire, LS2 9JT, UK, *[email protected]
Introduction
Background
Diesel engines represent a significant fraction of the light duty vehicle fleet in the UK and Europe. Their emission characteristics differ vastly from Petrol fuelled vehicles and the lean burn characteristics of diesel engines that make them so desirable for fuel consumption also lead to many problems relating to the emissions of pollutants.
The presence of excess oxygen from the lean burn in the exhaust plume compared to traditional petrol engines operating at stoichiometric air-fuel mix levels means that the reduction reactions used in Three-Way Catalysts (TWCs), so successful at removing the vast majority of pollutants from petrol engines, are comparatively ineffective for Oxidised Nitrogen (collectively NOX) compound removal in lean burn engines. Diesel engines also emit a complex particulate matter component in their exhaust plumes containing a volatile organic fraction as well as solid organic material, often with one adsorbed onto the other. All of these factors mean that control systems for diesel emissions are far more complicated than for petrol (Johnson, 2006).
The short-term health impacts of exposure to air pollution are significant, with research consistently showing the negative impacts of exposure. Vehicle emissions are also cited as a significant contributor to air pollution (WHO, 2005). Exposure to species contained in diesel emissions such as NO2, particulate matter, Benzene and Polycyclic Aromatic Hydrocarbons are of special concern and therefore effective control systems are required.
A NOX Storage and Removal (NSR) catalyst aims to store the NOX as a nitrate under lean burn conditions and periodically remove it under rich burn conditions managed by the engine control unit (Matsumoto, Ikeda, Suzuki, Ogai, & Miyoshi, 2000). During lean burn periods the NO is oxidized over a Platinum catalyst to create NO2. The resultant NO2 is captured by forming compounds containing Barium, for example BaO is often used alongside Pt. During the short rich burning periods of operation, the NOx is released from the Barium and reacts with hydrocarbons to produce N2, H2O and CO2 (Olsson & Fridell, 2002).
Furthermore, an Oxidation catalyst (DOC) is used to remove CO and HC in the exhaust. The reactions in the DOC also remove the volatile organic fractions adsorbed onto the solid organic soot compounds (Walker, 2004).
Adsorption of molecules onto the catalyst occurs during periods of lean burn engine operation and the molecules are removed during short periods of rich burn operation, regenerating the catalyst and allowing it to work at full efficiency again. The rich burn process is typically controlled by the engine control unit (Lapuerta, Hernandez, & Oliva, 2014).
Catalysts in Diesel vehicles suffer from a lack of self-heating, means that even if a catalyst reaches light-off temperature it may later cool to a point that it is no longer effective at removing pollution from the exhaust gas (Herreros, Gill, Lefort, Tsolakis, Millington, & Moss, 2014). The number and contribution of these cold start and cold operation emission sources is not currently fully understood.
The Taxi Fleet
The typical operation cycle of a taxi may not include the high-speed periods required to trigger the rich running engine mode necessary to regenerate the catalyst and to maintain it at operating temperature if traffic becomes congested. If taxis are operating significantly differently to private hire vehicles it is important to understand and model these phenomena when arriving at fleet emission inventories. Current modelling techniques do not account for the differences between a private hire vehicle, a privately owned vehicle or a Hackney carriage. Taxis are typically not considered discretely, just part of the passenger fleet. If there is a significant difference between these two sections of the fleet then failure to distinguish between the two in terms of their emissions may lead to a misestimate of the pollution inventory derived from models.
Kerbside remote sensing of vehicles offers a rare chance to observe a range of vehicles in-situ, exposed to a range of operational histories hence improving the clarity of understanding. Substituting environment, drivers and vehicle characteristics control for volume and breadth of data means that an opportunity to compare different elements of the fleet in a meaningful way is possible.
The results of this research are of interest to emissions modellers who may wish to up-lift the impact of taxis compared to regular vehicles, and help policy makers develop a clearer understanding of the sources of air pollution.
Methodology
Theory
A remote sensing device (RSD 4600 supplied by ESP Systems) was used to measure the number of particles of NO, CO, HC, PM and CO2 via the extinction of ultraviolet and infrared laser sources by applying the Beer - Lambert law. Ratios of the various abundances are calculated in terms of the CO2 abundance with the final measurement being expressed as a ratio of pollutant to CO2. This method is preferable as it is independent of the geometry of the exhaust plume.
The measurement of NO is useful but NOX is more relevant for legislation purposes. To calculate the NOX, the sum of NO and NO2, fractional NO2 (fNO2) values are sourced from the literature (Grice, et al., 2009) and used as follows: NOx = NO / (1 - fNO2). This method has been used in previous studies (Carslaw, Tate, Westmoreland, Williams, & Beevers, 2011).
Whilst the ratios themselves are useful in quantifying the relative effectiveness of each vehicles emission reduction devices, their application is more limited for calculating emissions and their impact on roadside pollution concentration. The remote sensing equipment also measures the instantaneous speed and acceleration through the equipment, allowing accurate Vehicle Specific Power (VSP) to be calculated (Jimenez Palacios, 1999).
A camera is linked to the RSD, capturing each vehicle as it passes. The number plates are recorded and translated into car specific information via the http://www.carweb.co.uk service thus giving us great detail on the technical specifications of the vehicles, including but not limited to fuel type and euro class, kerb weight, engine size and power and year first registered. Local authorities granted access to the database of taxi license plates and this subset was isolated and studied in greater depth.
The ratio, for example NO:CO2, can then be converted into an emission factor with units of grams kilometre-1, a unit that is typically of more use to the field of car emissions. A number of methods can be used to convert the ratio measurements into gkm-1 estimates. The manufacturer’s CO2 rating can be used, combined with Sprit Monitor factors (http://www.spritmonitor.de) to adjust the CO2 emissions based on thousands of real world users to arrive at a more realistic global average CO2 value in gkm-1 then multiplied by the ratio. Instantaneous traces can also be derived using the speed and acceleration captured by the RSD. Using an instantaneous emission model (IEM) such as PHEM it is possible to model an instantaneous CO2 emission and hence an instantaneous pollution emission measurement.
Practical
The RSD was set up in 2 UK cities (Sheffield and Cambridge), each survey campaign consisting of 5 different locations for 2 days per location throughout the summer of 2013, totalling 20 days of observations and over 50k individual measurements, approximately 31k of which are cars, 12k are Diesel powered and 1.7k are taxis of various types.
Fleet Section Frequency
Private Vehicles 11678
Private Hire Vehicles 965
Hackney Carriages 612
Figure 1: Frequency of different vehicle classes
Measurement sites were selected in conjunction with the Sheffield and Cambridge councils. The sites are broadly representative of road conditions in the area but are limited by the operating conditions required for the RSD equipment to function. Single carriage roadways on a slight up-hill gradient provide the best results as the engines are doing more work and hence producing more CO2 and pollutants. Data collection begins at 8:00 and finishes at 18:00 to ensure the peak traffic times are covered. Vehicles are required to travel through the equipment at a speed greater than 5kmh-1. The privately owned car data was cut up into representative sets based on Euro class and fuel type. Euro 3 and 4 Diesel vehicles were compared to Hackney Carriage vehicles and Euro 4 Diesel vehicles were compared to the PHV fleet as it better represents the constituent members.
Of chief interest in this experiment are vehicles that are either Private Hire or pre-booked taxi Vehicles (PHV’s), Hackney Carriage or hailed taxis and Privately owned vehicles that are representative of these subgroups.
Limitations
The RSD operates best when located on an uphill gradient. As such, this tends to bias towards engines under load. This is important because the RSD requires a CO2 plume to be present, which is more likely the higher the load on the engine but it does mean that the selection is biased towards high load operation. This limitation is less important in a comparative experiment but is something that an operator should be aware of. Typically a vehicle not operating under load will not generate enough CO2 to trigger a measurement, suggesting that the contribution from these vehicles to the overall pollution inventory is minimal to insignificant.
Results
Vehicle Emission Measurements
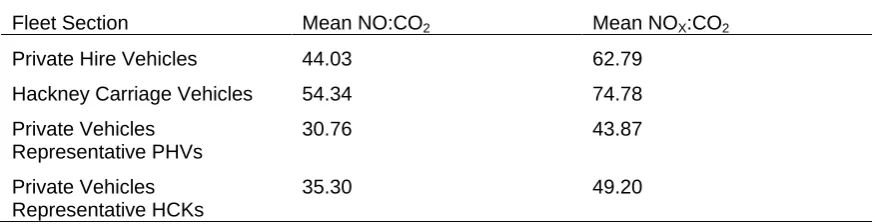
The mean emission ratio for each vehicle subset was calculated and the results are displayed in Table 1. NO and NOX ratios are higher in both the PHV fleet (43 & 43 percent) and the Hackney Carriage fleet (54 & 51 percent) than a representative sample of the privately owned fleet with Hackney Carriages having an 11 percent greater value than the PHV fleet.
Fleet Section Mean NO:CO2 Mean NOX:CO2
Private Hire Vehicles 44.03 62.79 Hackney Carriage Vehicles 54.34 74.78 Private Vehicles
Representative PHVs
30.76 43.87 Private Vehicles
Representative HCKs
35.30 49.20
[image:3.595.65.503.620.732.2]Figure 3: Distribution of NO and NOX per CO2 ratios between Hackney Carriages and PHVs. Panel a) shows a comparison of NO:CO2 emissions for Hackney Carriages (blue, dashed) with a representative fleet sample, b) shows a comparison of NO:CO2 for PHVs (blue, dashed) with a representative fleet sample. Panel c) shows a comparison between NOX ratios for Hackney Carriages (blue, dashed) and a representative fleet and d) shows a comparison between NOX ratios for PHVs (blue, dashed) and a representative fleet
Pollution Distributions
The distribution of NO and NOX ratios for various fleet subsets were plotted using a frequency density routine from a graphics package (ggplot2) in the R data analysis environment. The distributions are asymmetrical, biased towards the higher emitters. This feature is significantly more prevalent in the taxi fleet distributions compared to the comparative private fleet.
Conclusions
The taxi fleet emits more NO:CO2 and NOX:CO2 than similar privately owned vehicles. There are more higher emitters in both PHV and Hackney Carriage vehicles, significantly more so in the Hackney Carriage fleet.
Comparison of the hackney carriage and private hire vehicles to privately owned vehicles that are representative in terms of Euro class and fuel type suggest that hackney carriage vehicle emissions are a marked departure from the emissions of the standard fleet. In terms policy, this suggests that hackney carriages are a significant cause of urban pollution, creating more pollution than would be expected if they were replaced with vehicles from the private fleet. It is likely that the design of the vehicles, weight and fuel type, contributes to this although exactly how remains unclear. It also strengthens the case for investment in hybrid taxis in urban environments.
Private hire vehicles are reasonably consistent with the representative fleet however they do over-pollute relative to comparative sections of the same fleet. As with hackney carriage vehicles, this data does not allow us to see exactly why this is happening however it does suggest that, in this case at least, the effect is real and needs to be taken into account.
The results also provide evidence for those looking for a case to refresh the hackney carriage fleets around taxi hot spots such as train stations. Replacing these vehicles with modern hybrid vehicles could remove a significant amount of NOx emitted into high usage areas in the urban environment leading to a significant improvement in air quality.
Bibliography
Carslaw, D. C., Tate, J. E., Westmoreland, E. J., Williams, M. L., & Beevers, S. D. (2011). Recent evidence concerning higher NOx emissions from passenger cars and light duty vehicles. Atmospheric
Environment, 45:39, 7053-7063.
Grice, S., Stedman, J., Kent, A., Hobson, M., Norris, J., Abbot, J., et al. (2009). Recent trends and projections of NO2 emissions in europe. Atmospheric Environment, 43:21, 154-167.
Herreros, J. M., Gill, S. S., Lefort, I., Tsolakis, A., Millington, P., & Moss, E. (2014). Enhancing the low temperature oxidation performance over a PT and PT-PD diesel oxidation catalyst. Apploed Catalysis
B: Environmental, 147, 835-841.
Jimenez Palacios, J. L. (1999). Understanding and Quantifying Motor Vehicle Emissions with Vehicle Specific Power and TILDAS Remote Sensing .
Johnson, T. (2006). Diesel emission control in review. SAE Technical Papers , 1-30.
Lapuerta, M., Hernandez, J. J., & Oliva, F. (2014). Strategies for active diesel particulate filter
regeneration based on late injection and exhaust recirculation with different fuels. International Journal
of Engine Research, 15 (2), 209-221.
Matsumoto, S., Ikeda, Y., Suzuki, H., Ogai, M., & Miyoshi, N. (2000). NOx storage-reduction catalyst for automotive exhaust with improved tolerance against sulfur poisoning. Applied Catalysis B:
Environmental, 25 (2-3), 115-124.
Olsson, L., & Fridell, E. (2002). The Influence of Pt Oxide Formation and Pt Dispersion on the Reactions NO2 ⇔ NO + 1/2 O2 over Pt/Al2O3 and Pt/BaO/Al2O3 . Journal of Catalysis (210), 340-353.
Rogerson, S. (2013). Developing the evidence base and business case for hybrid taxis. Masters Dissertation .
Walker, A. (2004). Controlling particulate emissions from diesel vehicles. Topics in Catalysis, 28 (1-4), 165.