Modeling soil moisture-precipitation feedback in the Sahel: Importance
of spatial scale versus convective parameterization
Christopher M. Taylor,1Cathryn E. Birch,2,3Douglas J. Parker,2Nick Dixon,2 Françoise Guichard,4Grigory Nikulin,5and Grenville M. S. Lister6
Received 1 November 2013; accepted 19 November 2013; published 10 December 2013.
[1] Feedback between soil moisture and precipitation influence climate variability in semiarid regions. However, serious concerns exist about the ability of coarse-scale global atmospheric models to depict one key aspect of the feedback loop, namely the sensitivity of daytime convection to soil moisture. Here we compare regional simulations using a single model, run at different spatial resolutions, and with convective parameterizations switched on or off against Sahelian observations. Convection-permitting simulations at 4 and 12 km capture the observed relationships between soil moisture and convective triggering, emphasizing the importance of surface-driven mesoscale dynamics. However, with the inclusion of the convection scheme at 12 km, the behavior of the model fundamentally alters, switching from negative to positive feedback. Similar positive feedback is found in 9 out of 10 Regional Climate Models run at 50 km. These results raise questions about the accuracy of the feedback in regional models based on current convective parameterizations. Citation: Taylor, C. M., C. E. Birch, D. J. Parker, N. Dixon, F. Guichard, G. Nikulin, and G. M. S. Lister (2013), Modeling soil moisture-precipitation feedback in the Sahel: Importance of spatial scale versus convective parameterization, Geophys. Res. Lett.,40, 6213–6218, doi:10.1002/2013GL058511.
1. Introduction
[2] In many seasons and regions, soil moisture strongly influences daytime surfacefluxes of sensible and latent heat [Dirmeyer, 2011]. By driving soil moisture variability, antecedent rainfall can thus affect the thermodynamics and dynamics of the lower atmosphere, and hence the potential for future rain [e.g., Eltahir, 1998]. In the climate modeling community, this feedback between soil moisture and
precipitation is important due to its impact on regional hydroclimate—for example, a positive feedback is likely to pro-long and/or intensify drought. The sensitivity of precipitation to soil moisture variability was assessed for an ensemble of climate models in a key study [Koster et al., 2004]. They identified regions of the world (notably the U.S. Great Plains, the Sahel, and India) where soil moisture impacted rainfall during boreal summer. They also highlighted a large range of sensitivities between models, implying uncertainty in the modeling of key processes. More recently,Taylor et al. [2012, henceforth T12] used global satellite data to explore this question. Consistent with other studies [e.g.,Koster et al., 2004;Dirmeyer, 2011], they found the strongest signals in semiarid regions. However, T12 also showed that at scales of 50–100 km, afternoon rain is more likely to develop over drier soils rather than wetter soils. This observed, locally negative feedback contrasted with a strong positive feedback in the six global models analyzed. The model bias supports an earlier study [Hohenegger et al., 2009] which suggested that the feedback sign changed from positive to negative with a more realistic (i.e., convection-permitting) representation of deep convection than that provided by a parameterization. In particular, current convec-tion schemes, often based on consideraconvec-tions of one-dimensional convective instability [Arakawa, 2004], tend to respond rapidly to local daytime increases of low-level moist static energy, which is typically faster over wetter soils [Eltahir, 1998].
[3] An important mechanism favoring the initiation of rain over drier soil is the development of mesoscale circulations driven by soil moisture heterogeneity [Pielke, 2001]. These circulations increase convergence in regions of strong gradients in sensible heat flux [Taylor et al., 2007]. Observational analysis [Taylor et al., 2011, henceforth T11] from the Sahel has confirmed the climatological impor-tance of this mechanism. The effect of spatial variability in the Sahel dominates over one-dimensional considerations [Dione et al., 2013] in determining the soil moisture impact on convective initiation, though other feedback mechanisms may become more important as Mesoscale Convective Systems (MCS) mature, [e.g., Taylor and Lebel, 1998; Gantner and Kalthoff, 2010].
[4] The inability of large-scale models to capture the observed preference for afternoon rain over drier soil (T12) raises a critical question: is it inadequate spatial resolution and/or systematic bias in convective parameterizations which is responsible? This paper addresses that question. It provides a novel assessment of how models of different spatial resolutions represent soil moisture-precipitation feedback and compares their behavior to observations. We focus on the Sahel, a region with strong, relatively well understood, and observed feedback behavior. First, we use a convec-tion-permitting simulation, which can represent separate 1Centre for Ecology and Hydrology, Wallingford, UK.
2
Institute for Climate and Atmospheric Science, School of Earth and Environment, University of Leeds, Leeds, UK.
3
Now at Met Office, Leeds, UK.
4CNRM-GAME (CNRS and Météo-France), Toulouse, France. 5
Rossby Centre, Swedish Meteorological and Hydrological Institute, Norrköping, Sweden.
6
NCAS, Department of Meteorology, University of Reading, Reading, UK.
Corresponding author: C. M. Taylor, Centre for Ecology and Hydrology, Crowmarsh Gifford, Wallingford, Oxfordshire, OX10 8BB, UK. ([email protected])
©2013 The Authors.Geophysical Research Letterspublished by Wiley on behalf of the American Geophysical Union.
cumulonimbus updraughts without necessarily resolving their detailed turbulent structure, to explore the underlying mechanisms responsible for soil moisture controls on daytime convective initiation, and show that this simulation is consistent with the structure of the observed feedback. We then examine how this same model simulates the soil moisture-precipitation feedback when run at coarser resolu-tion, with the convective parameterization either switched on or off. We quantify how the different configurations influence rainfall persistence and dry-spell return times, and compare the results with simple diagnostics from 10 Regional Climate Model (RCM) simulations.
2. Model Simulations
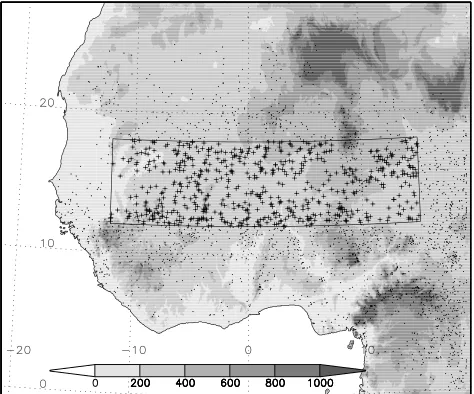
[5] We examine a set of 40 day simulations using the UK Met Office Unified Model (MetUM) run over a domain of 4440 × 3104 km (Figure 1). These include two simulations where the convective parameterization of Gregory and Rowntree[1990] is employed, using 12 and 40 km horizontal grid spacing (“12P” and “40P”), and two further explicit-convection simulations, where the explicit-convection scheme is switched off, at 4 and 12 km grid spacing (“4E” and
“12E”). These simulations have previously been used to understand the role of convection in the diurnal cycle of the West African Monsoon [Marsham et al., 2013] and the sensitivity of the diurnal cycle of rainfall to the representation of convection [Pearson et al., 2013]. The latter study illustrated the substantially improved diurnal phase of rain-fall in 4E and 12E compared to 12P. While parameterized versions of MetUM, in common with many climate models, simulate a strong rainfall peak around midday, the explicit runs capture the observed midday minimum and sharp rise during the afternoon as new convective systems initiate.
[6] The model configurations are described in detail by Pearson et al. [2013] and are only summarized here. The MetUM has a semi-Lagrangian, semi-implicit and nonhydrostatic formulation, and a terrain-following coordinate system [Davies et al., 2005]. Parameterizations represent
surface processes [Best et al., 2011], the boundary layer [Lock et al., 2000] and mixed-phase cloud microphysics [Wilson and Ballard, 1999]. In the explicit models, a 2-D Smagorinsky-type scheme accounts for subgrid-scale horizontal mixing. The 40 day simulations are initialized with a European Centre for Medium-Range Forecasts (ECMWF) analysis at 00Z, 25 July 2006. The 12 km-resolution configurations are forced at the boundaries by ECMWF analyses every 6 h, and the 4 km configuration is forced by the 12 km nest every 30 min. During thefirst 4 days, surfaceflux patterns exhibit artifi -cial features introduced by the soil moisture initialization, so this period is excluded from analysis. We ran an additional set of thirty six 30 h forecasts with the 12P model to explore sensitiv-ity to soil moisture (“12Ps”). For each 12Ps simulation, the model was initialized at 0000 UTC with atmospheric fields from 12P, but soil moisture from 12E.
[7] We also analyze 10 RCM simulations performed under the Coordinated Regional Downscaling Experiment (CORDEX)-Africa initiative [Nikulin et al., 2012]. The models were run with common lateral boundary conditions provided by reanalysis data across a much larger domain using a grid length of approximately 50 km. Three-hourly rainfall was output by the RCMs and is analyzed here for the same 36 day period in the seasonal cycle as the MetUM runs, but extended over 5 years (2004–2008) to produce more robust statistics.
3. Convective Initiation
[8] To assess whether the MetUM 4E model can capture the observed spatial relationships between soil moisture and convective initiation (T11), we examine a large sample of simulated daytime rain events. We repeat their methodology developed for observational data (cloud temperatures colder than 40°C and land surface temperature (LST), both avail-able every 15 min at spatial resolution ~ 3 km; see T11 for further details). The same tracking algorithm is applied to 15 min model output. Initiating convective storms between 1000 and 2100 UTC are identified from contiguous rainy areas exceeding 1000 km2, which are tracked back in time
and space to the appearance of thefirst rainy grid cell. That cell defines the initiation point, producing 2504 cases over 36 days (Figure 1). We retain only those 640 initiations which occurred in the Sahel subdomain, excluding cases where local topographic height exceeded 500 m (to avoid additional complexity due to orographic triggering), or the system took longer than 3 h to reach the areal threshold.
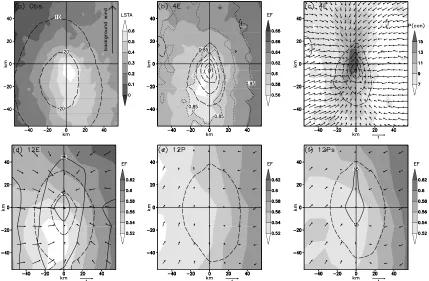
[image:2.612.62.299.56.253.2][9] Figure 2 presents the composite mean spatial structure associated with the initiations, where data from each case havefirst been aligned with the large-scale middayflow at 10 m, then centered on the time and location of thefirst rain. The evaporative fraction (latent heatflux divided by the sum of latent and sensible heatfluxes,“EF”; Figure 2b) illustrates spatial variability in simulated prestorm surfacefluxes. It in-dicates a preference for initiations to occur near the downwind end of a mesoscale (~ 50 × 30 km) region of lower (higher) latent (sensible) heatflux. As evident in Figure 2b, the EF pattern is well correlated with near-surface (0–10 cm) soil moisture, shown here as a ratio to the soil texture-dependent critical value, consistent with the model formulation of evapora-tive conductance from bare soil [Best et al., 2011]. Much of the rain in the 2 hours following the initiation occurs over the drier soil. This mesoscale structure is in remarkably good agreement Figure 1. Topographic height (m) across the 4E domain.
with the observations (Figure 2a) where daily anomalies in LST were used as a proxy for soil moisture (lower LST values on av-erage indicate higher soil moisture) [De Kauwe et al., 2013] and large cold cloud cover is indicative of rainfall. The similarity be-tween Figures 2a and 2b demonstrates that the model is well able to capture the soil moisture influence on convective initia-tion. Note that the large-scale cross-wind gradient in Figure 2b (surface getting wetter from left to right) is due to a combination of the climatological north-south rainfall and vegetation gradient, and south-westerly monsoon flow. The large-scale signal has been removed in Figure 2a through the use of LST anomalies.
[10] The low-levelflow preceding the development of deep convection is shown in Figure 2c, presented as vector anomalies from the areal mean wind. The mean field indicates convergence centered over the downwind edge of the dry area highlighted in Figures 2a and 2b. For a given event, the likeli-hood of convergence above a threshold of 1.25 × 10 4s 1in this area is more than double the value found 50 km away in either cross-wind direction. This local convergence signal emerges around 4 h before initiation of deep convection (not shown) and is associated with locally enhanced reductions in convective inhibition. The simulated preinitiation circulation is consistent with forcing from soil moisture heterogeneity [e.g.,
Gantner and Kalthoff, 2010;Pielke, 2001] and highlights the importance of patchiness in surface moisture for the develop-ment of new storms. The same analysis was performed with diagnostics from 12 km versions of the model. For the explicit model 12E (Figure 2d), the composite mean structures are qualitatively similar to the 4 km model. However, there is a stronger contribution to the 12E composite from cases with soil moisture-induced convergence, driven by a larger dry soil feature shifted about 15 km upwind from its location in 4E. On the other hand for 12P (Figure 2e), there is very little evidence of mesoscale soil moisture and associated conver-gence forcing in the composite mean due to the very large number (6500) of short-lived, disorganized convective events. These are classified as“initiations”in the sense that a rainy area develops where there was no overlapping rain in the preceding hour. We conclude that while 12E can capture the essential physics inferred from observations, switching on the convective parameterization at that resolution (12P) has a strong detrimental effect on the simulated feedback.
4. Feedback of Soil Moisture on Rainfall in Models
[image:3.612.92.521.56.337.2]of daily rainfall at different spatial scales. To compare the behavior of the MetUM model with the limited diagnostics from the CORDEX RCMs, we develop a simple measure based solely on rainfall. We consider the statistics of rainfall on sample areas of a given length scale, L. Daily rainfall is accumulated over 24 h from 0600 UTC, and to minimize the impact of long-lived nocturnal rainy systems affecting consecutive totals, days with nonzero rain between 0 and 0600 UTC are excluded from the analysis. To discriminate be-tween antecedent soil moisture conditions which are predomi-nantly dry, predomipredomi-nantly wet, or patchy over the L × L sample area, we adopt a simple antecedent rainfall threshold. This is set to 3 mm d 1, a value big enough to produce a clear
response in surfacefluxes the following day, but small enough to provide a large sample of cases. When at least 50% of the area has received rain exceeding this threshold on the previous day, it is defined as being“wet”, while an area is defined as“dry” when no grid cells within the L × L area have exceeded that threshold in the previous 24 h. The remaining cases are termed“patchy”.
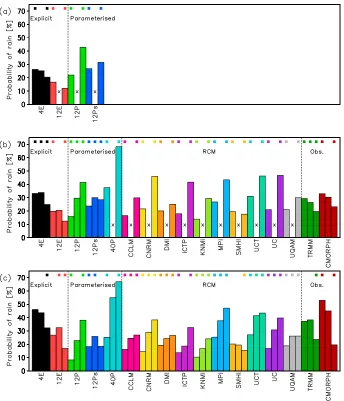
[image:4.612.136.480.53.454.2]resolution of 0.25° [Huffman et al., 2007] to reliably infer soil moisture variability on wavelengths less than 75 km, they indicate the lower probability of rain in regions which experienced extensive rain in the previous 24 h.
[13] The mean probability of rain varies considerably across the different configurations of the MetUM and the RCMs. However, in terms of sensitivity to antecedent rainfall class, distinct types of model behaviors emerge. First, the sensitivity in 12E is broadly similar to 4E, with significantly lower rainfall probabilities for the wet class. By contrast, the parameterized runs (12P and 40P) exhibit the opposite behavior over wet and dry classes. Furthermore, with the exception of the Swedish Meteorological and Hydrological Institute (SMHI) simulation, all the RCMs favor rain over wet surfaces when considered either at the grid box scale (Figure 3b) or averaged over nine grid boxes (Figure 3c). Similar behaviors over wet, dry, and patchy soils are found for all the models using alte-rnative thresholds of 1 and 5 mm d 1. These results indicate that, with the exception of one model, state-of-the-art convec-tive parameterizations produce rain which tends to persist from one daytime to the next. The reasons for the distinct behavior of the SMHI model are unclear but might be linked to that model’s lack of diurnal phase bias [Nikulin et al., 2012], though the University of Quebec at Montreal (UQAM) simulation also depicts a realistic diurnal cycle but unrealistic persistence in Figure 3.
[14] The additional sensitivity runs 12Ps (i.e., with con-vective parameterization but with soil moisture initializa-tion from 12E) allow us to disentangle potential atmospheric and land surface contributions to the excessive persistence in 12P. The probability of rain in 12Ps was calculated according to surface wetness classes from ante-cedent rain in 12E. The probabilities thus incorporate the soil moisture contribution to persistence but not the
[image:5.612.66.295.56.252.2]atmospheric contribution. Again the parameterized model erroneously shows higher probability of rain over wetter soil than drier soil for all length scales, though not signifi -cantly so aboveL= 132 km. In contrast to 12P, however, rain in 12Ps is most likely in the patchy class. This effect results directly from the strong mesoscale soil moisture heterogeneity created by 12E and subsequently used to initialize 12Ps (the decorrelation length scale of daily rainfall in 12E is 97 km, as compared to 264 km in 12P). The impact of patchier soil moisture on rainfall initiation is evident in Figure 2f. The composite mean shows convergence in the hours preceding the initiation in 12Ps, associated with a weak, local dry soil anomaly superimposed on the large-scale (cross-wind) gradient, in contrast to 12P (Figure 2e). This indicates that there are two important contributions to the biased soil moisture-precipitation feedback associated with this convective parameterization. First, in common with most other schemes, the parameterization has a scale-insensitive preference for rain over wetter soil (T12). Second, when run at the mesoscale, the unrealistic smoothness of the simu-lated rainfall tends to reduce spatial variability in surface fluxes on subsequent days, suppressing the local scale soil moisture feedback on convective initiation.
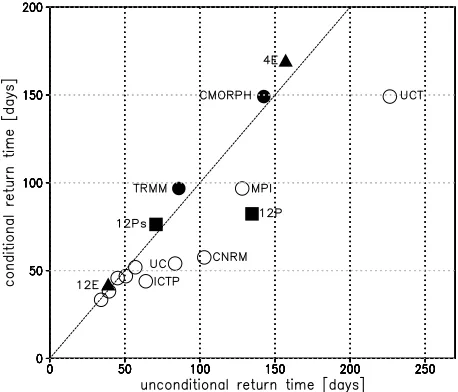
[15] Finally, we illustrate the impact of the erroneous soil-moisture sensitivity of the convective parameterizations on the statistics of rainfall and dry-spell return times in particu-lar. During the Sahel wet season, dry periods ~10 days can have significant deleterious effects on crops [Sultan et al., 2005]. We create stochastic time series governed by two models. The “unconditional model” is a binomial system, in which the probability of rainfall (P) is independent of the previous day’s rain (and hence surface state), and is given simply by the number of rain-days divided by the total number of days available. A second“conditional model”is developed, based on a Markov chain with five states, corresponding to possible combinations of mean rainfall (>3mm or<3mm) and rainfall distribution (dry, patchy, and wet as defined above), again taking probabilities from the set of observations and numerical models.
[16] Results of 30,000 day simulations with the statistical model are shown in Figure 4 for a box length scale ~ 50 km and indicate a broad spread of unconditional return times for a 10 day dry spell ranging from 34 to 226 days, depending on the data set. In the conditional model, the implicit inclusion of soil moisture feedback changes the return times consistent with the influence of the probabilities of daily rain-fall persistence for the particular data set (Figure 3). For the explicit simulations and observations, dry spells become less frequent (points above the 1:1 line), linked to the negative feedback, while 9 of the 10 RCMs have more frequent dry spells. Infive of these (labeled in Figure 4), the conditional return time is less than 80% of the unconditional value. Note that a strong reduction in conditional return time in this framework requires both a large difference inPbetween wet and dry soils, and a relatively high value ofPover wet soil (Figure 3b), conditions satisfied by thesefive models. The impact of patchy soil moisture initialization is evident in the contrasting dry spell time scales of 12P and 12Ps. For 12P, 10 day dry spells are ~40% more likely than predicted by the unconditional model, while 12Ps has a modest increase in return time in the conditional model. Note that qualitatively similar results are found at other length scales and thresholds.
5. Summary
[17] This study has shown that a convection-permitting simulation at 4 km can produce spatial relationships between soil moisture and convective triggering similar to those in-ferred from observational proxy data. The results confirm the importance of the surface-driven circulations in generating convergence and reducing convective inhibition in the hours preceding initiation. Additional 12 km simulations provided a means to test the sensitivity of the feedback to the convective parameterization. We found that switching on the convection scheme fundamentally changed the soil moisture coupling in the model. At the daily time scale, the explicit (parameterized) simulations show suppressed (enhanced) rainfall probabilities over wet soil, indicative of a negative (positive) feedback at scales of 12–156 km, and making agriculturally important dry spells less (more) likely. The erroneous tendency for a positive feedback in models with parameterized convection is also found in 9 out of 10 RCM simulations at 50 km resolution. These findings support the suggestion made by T12 that convective parameterizations may be overly sensitive to evapotranspira-tion. In the 12 km parameterized run (12P), convective initiation occurs too early in the day, linked to rapid boundary layer humidification. Moreover, rainfall in this configuration tends to be unrealistically smeared out in space, suppressing soil moisture-induced circulations on subsequent days. To capture the essential mesoscale dynamics of the negative feedback, spatial resolution is clearly important but evidently not sufficient in this model. Given their poor depiction of the diurnal cycle [Nikulin et al., 2012], similar biased feedback in the RCMs may well originate, at least in part, from their respective convec-tive parameterizations. Without additional higher-resolution RCM simulations, we can only speculate on the relative importance of resolution and convective parameterization for these particular models.
[18] Seasonal and multiannual convection-permitting simulations at the regional and even global scale are becoming technically possible [Dirmeyer et al., 2012], and these hold promise for better understanding of soil moisture and vegetation impacts on rainfall [Hohenegger et al., 2009]. However, these results indicate that urgent attention is needed to address the shortcomings of convective parame-terizations in coarser resolution integrations as these will remain key components of models used for global climate projection for many years to come.
[19] Acknowledgments. This work was supported by the UK Natural Environment Research Council (NE/G015961/1) and used simulations generated under the Cascade project (NE/E00525X/1). Additional support was provided by the European Commission’s 7th Framework Programme, under Grant Agreement 282672 (EMBRACE).
[20] The Editor thanks two anonymous reviewers for their assistance in evaluating this paper.
References
Arakawa, A. (2004), The cumulus parameterization problem: Past, present, and future,J. Clim.,17(13), 2493–2525, doi:10.1175/1520-0442(2004) 017<2493:ratcpp>2.0.co;2.
Best, M. J., et al. (2011), The Joint UK Land Environment Simulator (JULES), model description–Part 1: Energy and waterfluxes,Geosci.
Model Dev.,4(3), 677–699, doi:10.5194/gmd-4-677-2011.
Davies, T., M. J. P. Cullen, A. J. Malcolm, M. H. Mawson, A. Staniforth, A. A. White, and N. Wood (2005), A new dynamical core for the Met
Office’s global and regional modelling of the atmosphere, Q. J. R.
Meteorol. Soc.,131(608), 1759–1782, doi:10.1256/qj.04.101.
De Kauwe, M. G., C. M. Taylor, P. P. Harris, G. P. Weedon, and R. J. Ellis (2013), Quantifying land surface temperature variability for two Sahelian Mesoscale Regions during the wet season, J. Hydrometeorol.,14(5), 1605–1619, doi:10.1175/jhm-d-12-0141.1.
Dione, C., M. Lothon, D. Badiane, B. Campistron, F. Couvreux, F. Guichard, and S. M. Sall (2013), Phenomenology of Sahelian convec-tion observed in Niamey during the early monsoon,Q. J. R. Meteorol. Soc., doi:10.1002/qj.2149.
Dirmeyer, P. A. (2011), The terrestrial segment of soil moisture-climate cou-pling,Geophys. Res. Lett.,38, L16702, doi:10.1029/2011GL048268. Dirmeyer, P., et al. (2012), Simulating the diurnal cycle of rainfall in global
climate models: Resolution versus parameterization,Clim. Dyn.,39(1-2), 399–418, doi:10.1007/s00382-011-1127-9.
Eltahir, E. A. B. (1998), A soil moisture-rainfall feedback mechanism 1. Theory and observations,Water Resour. Res.,34, 765–776.
Gantner, L., and N. Kalthoff (2010), Sensitivity of a modelled life cycle of a mesoscale convective system to soil conditions over West Africa,Q. J. R.
Meteorol. Soc.,136, 471–482, doi:10.1002/qj.425.
Gregory, D., and P. R. Rowntree (1990), A mass flux convection scheme with representation of cloud ensemble characteristics and stability-dependent closure,Mon. Weather Rev.,118, 1483–1506.
Hohenegger, C., P. Brockhaus, C. S. Bretherton, and C. Schar (2009), The soil moisture-precipitation feedback in simulations with explicit and parameterized convection, J. Clim., 22(19), 5003–5020, doi:10.1175/ 2009jcli2604.1.
Huffman, G. J., D. T. Bolvin, E. J. Nelkin, D. B. Wolff, R. F. Adler, G. Gu, Y. Hong, K. P. Bowman, and E. F. Stocker (2007), The TRMM Multisatellite Precipitation Analysis (TMPA): Quasi-global, multiyear, combined-sensor precipitation estimates atfine scales,J. Hydrometeorol.,
8(1), 38–55, doi:10.1175/JHM560.1.
Joyce, R. J., J. E. Janowiak, P. A. Arkin, and P. Xie (2004), CMORPH: A method that produces global precipitation estimates from passive microwave and infrared data at high spatial and temporal resolution,
J. Hydrometeorol., 5(3), 487–503, doi:10.1175/1525-7541(2004)
005<0487:CAMTPG>2.0.CO;2.
Koster, R. D., et al. (2004), Regions of strong coupling between soil mois-ture and precipitation,Science,305(5687), 1138–1140.
Lock, A. P., A. R. Brown, M. R. Bush, G. M. Martin, and R. N. B. Smith (2000), A new boundary layer mixing scheme. Part I: Scheme descrip-tion and single-column model tests, Mon. Weather Rev., 128(9), 3187–3199.
Marsham, J. H., N. S. Dixon, L. Garcia-Carreras, G. M. S. Lister, D. J. Parker, P. Knippertz, and C. E. Birch (2013), The role of moist con-vection in the West African monsoon system: Insights from continental-scale convection-permitting simulations, Geophys. Res. Lett., 40, 1849–1843, doi:10.1002/grl.50347.
Nikulin, G., et al. (2012), Precipitation climatology in an ensemble of CORDEX-Africa regional climate simulations, J. Clim., 25(18), 6057–6078, doi:10.1175/jcli-d-11-00375.1.
Pearson, K. J., G. M. S. Lister, C. E. Birch, R. P. Allan, R. J. Hogan, and S. J. Woolnough (2013), Modelling the diurnal cycle of tropical convec-tion across the‘grey zone’,Q. J. R. Meteorol. Soc., doi:10.1002/qj.2145. Pielke, R. A. (2001), Influence of the spatial distribution of vegetation and soils on the prediction of cumulus convective rainfall,Rev. Geophys.,
39(2), 151–177, doi:10.1029/1999RG000072.
Sultan, B., C. Baron, M. Dingkuhn, B. Sarr, and S. Janicot (2005), Agricultural impacts of large-scale variability of the West African monsoon, Agr. For. Meteorol., 128(1–2), 93–110, doi:10.1016/j. agrformet.2004.08.005.
Taylor, C. M., and T. Lebel (1998), Observational evidence of persistent convective-scale rainfall patterns, Mon. Weather Rev., 126(6), 1597–1607.
Taylor, C. M., D. J. Parker, and P. P. Harris (2007), An observational case study of mesoscale atmospheric circulations induced by soil moisture,
Geophys. Res. Lett.,34, L15801, doi:10.1029/2007GL030572.
Taylor, C. M., A. Gounou, F. Guichard, P. P. Harris, R. J. Ellis, F. Couvreux, and M. De Kauwe (2011), Frequency of Sahelian storm initiation enhanced over mesoscale soil-moisture patterns, Nat. Geosci., 4(7), 430–433, doi:10.1038/ngeo1173.
Taylor, C. M., R. A. M. de Jeu, F. Guichard, P. P. Harris, and W. A. Dorigo (2012), Afternoon rain more likely over drier soils,Nature,489(7416), 423–426, doi:10.1038/nature11377.
Wilson, D. R., and S. P. Ballard (1999), A microphysically based precipita-tion scheme for the UK meteorological office unified model,Q. J. R.