Open Access
Research
Using the SaTScan method to detect local malaria clusters for
guiding malaria control programmes
Marlize Coleman
1, Michael Coleman*
2, Aaron M Mabuza
3, Gerdalize Kok
3,
Maureen Coetzee
4,5and David N Durrheim
6Address: 1School of Animal, Plant & Environmental Sciences, University of the Witwatersrand, Johannesburg, Gauteng, South Africa, 2Liverpool
School of Tropical Medicine, Pembroke Place, Liverpool, L3 5QA, UK, 3Mpumalanga Department of Health, 66 Anderson Street, Nelspruit, 1200,
South Africa, 4Vector Control Reference Unit, National Institute for Communicable Diseases, National Health Laboratory Service, 1
Modderfontein Road, Sandringham, 2131 Johannesburg, South Africa, 5SA Research Chair in Medical Entomology & Vector Control, School of
Pathology, University of the Witwatersrand, Johannesburg, South Africa and 6Hunter New England Population Health and Hunter Medical
Research Institute, Locked Bag 10, Wallsend, 2287, Australia
Email: Marlize Coleman - [email protected]; Michael Coleman* - [email protected];
Aaron M Mabuza - [email protected]; Gerdalize Kok - [email protected]; Maureen Coetzee - [email protected]; David N Durrheim - [email protected]
* Corresponding author
Abstract
Background: Mpumalanga Province, South Africa is a low malaria transmission area that is subject to malaria epidemics. SaTScan methodology was used by the malaria control programme to detect local malaria clusters to assist disease control planning. The third season for case cluster identification overlapped with the first season of implementing an outbreak identification and response system in the area.
Methods: SaTScan™ software using the Kulldorf method of retrospective space-time permutation and the Bernoulli purely spatial model was used to identify malaria clusters using definitively confirmed individual cases in seven towns over three malaria seasons. Following passive case reporting at health facilities during the 2002 to 2005 seasons, active case detection was carried out in the communities, this assisted with determining the probable source of infection. The distribution and statistical significance of the clusters were explored by means of Monte Carlo replication of data sets under the null hypothesis with replications greater than 999 to ensure adequate power for defining clusters.
Results and discussion: SaTScan detected five space-clusters and two space-time clusters during the study period. There was strong concordance between recognized local clustering of cases and outbreak declaration in specific towns. Both Albertsnek and Thambokulu reported malaria outbreaks in the same season as space-time clusters. This synergy may allow mutual validation of the two systems in confirming outbreaks demanding additional resources and cluster identification at local level to better target resources.
Conclusion: Exploring the clustering of cases assisted with the planning of public health activities, including mobilizing health workers and resources. Where appropriate additional indoor residual spraying, focal larviciding and health promotion activities, were all also carried out.
Published: 17 April 2009
Malaria Journal 2009, 8:68 doi:10.1186/1475-2875-8-68
Received: 15 December 2008 Accepted: 17 April 2009
This article is available from: http://www.malariajournal.com/content/8/1/68
© 2009 Coleman et al; licensee BioMed Central Ltd.
Background
Malaria is the most important parasitic disease of humans. Over three billion people live in malarious areas and the disease causes over 500 million cases with one to three million deaths per year [1,2]. An estimated one hun-dred million people in Africa are at risk of malaria epi-demics [3]. In common with most vector-borne infectious diseases, malaria is heterogeneous in its distribution in time and space [4-6], and incidence can vary greatly between districts, towns and villages. This heterogeneity is affected by patterns of malaria vector distribution, human-vector contact, human host behavioural factors, house construction, and malaria prevention methods used [5,7-10].
Characterization of malaria heterogeneity may allow pri-oritization of risk areas and allow focused control inter-ventions. The ability to identify localized malaria clusters in remote highland areas of east Africa facilitated early intervention in the absence of early warning systems, as these malaria "hotspots" remained constant in epidemic and non epidemic years [11].
A number of models have been developed for describing malaria spatial distribution and seasonality [12-15] trans-mission [8,16-18], mosquito distribution [19,20] and risk factors associated with malaria [21-23]. However many malaria endemic environments are resource limited and tools to assist decision support need to take account of these limitations.
Malaria remains a public health problem in north-eastern South Africa, in the low altitude provinces of KwaZulu-Natal, Limpopo and Mpumalanga [24,25]. Malaria risk is low compared to other hyper- and holo-endemic areas of sub-Saharan Africa and naturally acquired immunity does not develop in the local population [26].
The burden of malaria is well described in this region as definitive diagnosis using rapid diagnostic tests (RDTs) and mandatory reporting of malaria cases is universally practised in the public health system, which manages the vast majority of malaria cases [27,28]. All confirmed malaria cases are entered into a computerized malaria sur-veillance system.
This paper reports on the analysis of malaria notification data from 2002–2005 from Mpumalanga Province to determine local clustering of cases and how that was used to direct local control efforts and enhance the district out-break identification and response system [29].
Methods
Study area
Mpumalanga Province, which borders Mozambique and Swaziland, is a predominantly rural area with a
popula-tion of approximately four million people. Malaria occur-rence in this area is seasonal during the wet and humid months of October to April. Ninety-five percent of
malaria cases are due to Plasmodium falciparum infection.
This area has historically experienced malaria outbreaks and epidemics with relatively high mortality [29,30]. The
main vector in this region is Anopheles arabiensis and
vec-tor control is predominantly by indoor residual spraying (IRS) with DDT [31,32].
The seven rural towns that experience the highest malaria risk in Mpumalanga were included in this study (Figure 1)[33], with malaria incidence ranging from 30 to 61 per 1,000 persons between 1997 and 2005.
Original town maps acquired in 2000 were upgraded from digitized aerial photographs produced in 2002 (Cadnet, Nelspruit, South Africa) and updates were con-verted into MapInfo version 6.4 files (MapInfo Corpora-tion, New York, USA) with Geomedia software (Symmetry Systems Inc., New York, USA). Unique stand (household) numbers were allocated during the digitizing process. A stand may include one or more structures belonging to a family unit on a designated piece of land.
Active malaria case investigation
Malaria case investigators followed up all malaria cases reported at local health facilities for these towns as part of
Location of the seven towns selected for detailed cluster sur-veillance, Nkomazi municipal area, Mpumalanga
Figure 1
malaria control program activities for the 2002/2003, 2003/2004 and 2004/2005 seasons. A malaria case is defined as a person diagnosed either by positive rapid test or blood slide. An investigator would identify the proba-ble source of infection by confirming the travel history of the patient recorded on the notification.
Spatial and temporal clusters
SaTScan™ software, version 5.1.3, using the Kulldorf method of retrospective space-time permutation and the Bernoulli purely spatial model [34,35], was used by malaria control programme operational staff to detect malaria clusters in individual towns in the three seasons under investigation and over the combined time period. Individual malaria cases were used and recorded against source of infection households. Households who did not seek health care for malaria or tested negative during active case detection were used as controls for the Ber-noulli method. More than one case can be reported per household. A household in these areas is typically defined as a family unit with a single land owner.
The circular scan statistic is isotopic with respect to the rotation of the geographical area http://www.satscan.org. This method has previously been validated for plotting and understanding local malaria time-space-clusters [21,36-39].
Observed cases in a cluster were compared to the distribu-tion of expected cases if spatial and temporal locadistribu-tions of all cases were independent. The model adjusts for entirely spatial or entirely temporal clusters. With spatial adjust-ment, time remained dormant and during temporal anal-ysis seasons were considered. The distribution and statistical significance of the clusters were explored by means of Monte Carlo replication of data sets under the null hypothesis with replications greater than 999 to ensure adequate power for defining clusters http:// www.satscan.org. Clusters were prioritized for public health action according to their statistical significance. Hard copy town maps showing cluster areas were distrib-uted to malaria field staff investigating cases allowing the coordination of intervention efforts within communities.
Results
Malaria incidence
Four hundred and twenty two malaria cases were notified during the three seasons from 341 households across the seven towns. Malaria incidence differed significantly
between the towns during the three seasons (χ2 = 6.442, p
= 0.040) (Figure 2).
Case clustering
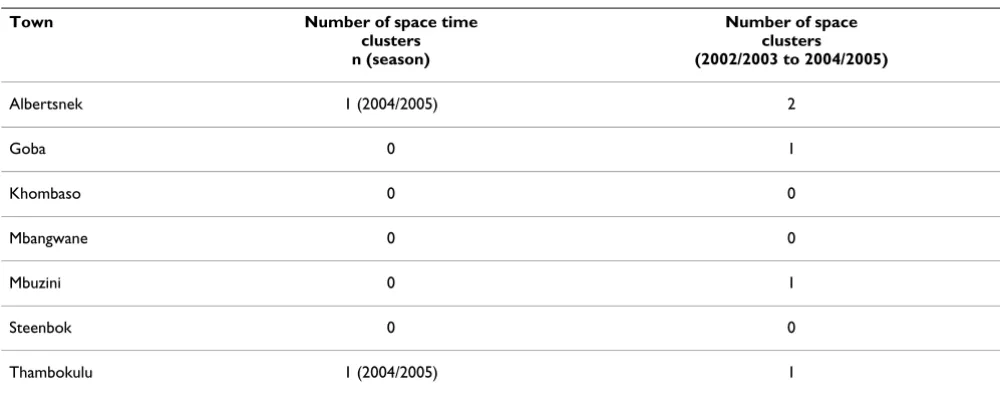
SaTScan analysis detected a number of clusters during the study period (Table 1). Albertsnek produced two
space-clusters over the three-season period using the Bernoulli model, one in the northern (log likelihood ratio = 12.308, p = 0.003) and one in the south eastern part of town (log likelihood ratio = 12.187, p = 0.003) (Figure 3A). Three additional space-clusters were observed; in Goba (log like-lihood ratio = 12.226, p = 0.001), Mbuzini (log likelike-lihood ratio = 22.372, P = 0.001) and Thambokulu (Figure 4A) (log likelihood ratio = 22.372, p = 0.001). Only two towns, Albertsnek (test statistic = 5.548, p = 0.007) and Thambokulu (test statistic = 3.668, p = 0.004), had space-time clusters and both were during the 2004/2005 season (Figures 3B and 4B).
Cluster detection to guide control activities
The third season for case cluster identification, 2004/ 2005, overlapped with the first season of implementation of an outbreak identification and response system in the
Malaria case incidence per 1 000 population by town, 2002/ 2003 – 2004/2005 seasons, Nkomazi municipal area
Figure 2
Malaria case incidence per 1 000 population by town, 2002/2003 – 2004/2005 seasons, Nkomazi municipal area.
0 2 4 6 8 10 12 14
Albe rtsne
k Gob
a Khom
baso Mba
ngw ane
Mbu zini
Stee nbok
Tham boku
lu
Tow n
In
c
id
e
n
c
e
2002/2003 2003/2004
2004/2005
Spatial malaria case clusters, Albertsnek town
Figure 3
Nkomazi area [29]. Thambokulu and Albertsnek triggered outbreak declarations during this season (Table 1). Anal-ysis demonstrated clusters in both towns during this sea-son. Real time cluster detection, monitoring as cases occur, triggered at the same time as the binomial outbreak identification thresholds [29].
The physical plotting of cases by household during this season (2004/2005) as part of the cluster identification activities at district level and on hard copy maps provided a visual distribution of risk in the towns and assisted with
the timely planning of public health activities especially logistics, including active case detection, early diagnosis and treatment of positive cases in the areas of the clusters, additional indoor residual spraying, focal larviciding and health promotion activities.
Discussion
Application of the SaTScan method successfully identified malaria clusters and clearly demonstrated malaria risk heterogeneity at local level. Four towns in this study expe-rienced spatial clusters and two produced space-time clus-ters in the 2004/2005 malaria season, the latter resulting in targeted local control efforts. The high rates of treat-ment-seeking behaviour at primary health care level in Mpumalanga [40] combined with the use of passive noti-fication and active case detection, strengthens disease sur-veillance and provides good quality data for cluster identification. SaTScan cluster identification has also proven valuable for targeting control strategies in the Ken-yan highlands [21]. Over a ten week period during a 2002 epidemic, spatial targeting of vector control interventions
reduced the abundance of Anopheles mosquitoes. The
investigation of causes for clusters within the areas reported here was not explored. The hypo-endemic nature of malaria in these areas does predict the unstable patterns of disease occurrence and more specifically outbreaks that can be clustered. The proximity of these areas to higher malaria risk areas such as Mozambique allows for the import of parasites and eventually local transmission.
Spatial clustering of infectious disease is enjoying renewed interest, particularly in areas of limited resources. Statistical methods have been used to investigate spatial clustering of dengue [41] encephalitis [19] and sleeping sickness but the application to malaria has been limited [42].
Space time malaria case cluster, Thambokulu town
Figure 4
[image:4.612.54.554.534.730.2]Space time malaria case cluster, Thambokulu town. A. 2004/2005 season. B. 2002/2003 – 2004/2005 seasons.
Table 1: Cluster and outbreak profile by town, 2002/2003 – 2004/2005 season
Town Number of space time
clusters n (season)
Number of space clusters (2002/2003 to 2004/2005)
Albertsnek 1 (2004/2005) 2
Goba 0 1
Khombaso 0 0
Mbangwane 0 0
Mbuzini 0 1
Steenbok 0 0
Gaudart et al [43] compared the oblique decision tree model, a complex statistical technique with Kulldorff's SaTScan™ cluster technique, which was used in this study.
Gaudart et al [43] produced similar results using both
methods in a village in West Africa to identify malaria risk clusters. This investigation confirmed the usefulness of the Kulldorff's scan statistic [44-46]. Due to the circular isotopic technique of Kulldorff's SaTScan™ it is a useful tool to detect clusters but has limitations on detecting irregular shaped clusters due to its fixed scan window [47,48].
The seven Mpumalanga towns under cluster surveillance were included in a malaria outbreak identification and response system based on formal case reporting [29]. There was strong concordance between recognized local clustering and outbreak identification in specific towns, with Albertsnek and Thambokulu both reporting malaria outbreaks in the same season as the time-space clusters. This synergy allows mutual validation of the two systems in confirming outbreaks, which demand additional resources, and cluster identification that could better tar-get these resources within the affected town.
Competing interests
The authors declare that they have no competing interests.
Authors' contributions
MaCol carried out all the investigative work and analysis under the guidance of MCoe and DND Field work would not have been feasible without the assistance of AMM and GK MiCol drafted the manuscript and corrected subse-quent drafts.
Acknowledgements
Special thanks and acknowledgement to the field personnel from the Malaria Control Programme in Mpumalanga province for their dedication and commitment to the cluster and outbreak activities.
References
1. Guerra CA, Hay SI, Lucioparedes LS, Gikandi PW, Tatem AJ, Noor AM, Snow RW: Assembling a global database of malaria para-site prevalence for the Malaria Atlas Project. Malar J 2007, 6:17.
2. Snow RW, Guerra CA, Noor AM, Myint HY, Hay SI: The global dis-tribution of clinical episodes of Plasmodium falciparum malaria. Nature 2005, 434:214-217.
3. World Health Organization: Malaria epidemics: forecasting, prevention, early detection and control. From policy to practice Leysin, Switzerland, WHO; 2003.
4. Carter R, Mendis KN, Roberts D: Spatial targeting of interven-tions against malaria. Bull World Health Organ 2000, 78:1401-1411.
5. Gamage-Mendis AC, Carter R, Mendis C, De Zoysa AP, Herath PR, Mendis KN: Clustering of malaria infections within an endemic population: risk of malaria associated with the type of housing construction. Am J Trop Med Hyg 1991, 45:77-85. 6. Greenwood BM: The microepidemiology of malaria and its
importance to malaria control. Trans R Soc Trop Med Hyg 1989, 83:25-29.
7. Snow RW, Gouws E, Omumbo J, Rapuoda B, Craig MH, Tanser FC, le Sueur D, Ouma J: Models to predict the intensity of
Plasmo-dium falciparum transmission: applications to the burden of disease in Kenya. Trans R Soc Trop Med Hyg 1998, 92:601-606. 8. Thomas CJ, Lindsay SW: Local-scale variation in malaria
infec-tion amongst rural Gambian children estimated by satellite remote sensing. Trans R Soc Trop Med Hyg 2000, 94:159-163. 9. Thompson R, Begtrup K, Cuamba N, Dgedge M, Mendis C,
Gamage-Mendis A, Enosse SM, Barreto J, Sinden RE, Hogh B: The Matola malaria project: a temporal and spatial study of malaria transmission and disease in a suburban area of Maputo, Mozambique. Am J Trop Med Hyg 1997, 57:550-559.
10. Trape JF, Lefebvre-Zante E, Legros F, Ndiaye G, Bouganali H, Druilhe P, Salem G: Vector density gradients and the epidemiology of urban malaria in Dakar, Senegal. Am J Trop Med Hyg 1992, 47:181-189.
11. Ernst KC, Adoka SO, Kowuor DO, Wilson ML, John CC: Malaria hotspot areas in a highland Kenya site are consistent in epi-demic and non-epiepi-demic years and are associated with eco-logical factors. Malar J 2006, 5:78.
12. Craig MH, Snow RW, le Sueur D: A climate-based distribution model of malaria transmission in sub-Saharan Africa. Parasitol Today 1999, 15:105-111.
13. Hay SI, Snow RW, Rogers DJ: Predicting malaria seasons in Kenya using multitemporal meteorological satellite sensor data. Trans R Soc Trop Med Hyg 1998, 92:12-20.
14. Omumbo J, Ouma J, Rapuoda B, Craig MH, le Sueur D, Snow RW: Mapping malaria transmission intensity using geographical information systems (GIS): an example from Kenya. Ann Trop Med Parasitol 1998, 92:7-21.
15. Tanser FC, Sharp B, le Sueur D: Potential effect of climate change on malaria transmission in Africa. Lancet 2003, 362:1792-1798.
16. Kleinschmidt I, Bagayoko M, Clarke GP, Craig M, le SD: A spatial statistical approach to malaria mapping. Int J Epidemiol 2000, 29:355-361.
17. Snow RW, Peshu N, Forster D, Bomu G, Mitsanze E, Ngumbao E, Chisengwa R, Schellenberg JR, Hayes RJ, Newbold CI, Marsh K: Envi-ronmental and entomological risk factors for the develop-ment of clinical malaria among children on the Kenyan coast. Trans R Soc Trop Med Hyg 1998, 92:381-385.
18. Yang G, Zhou X, Malone JB, McCarroll JC, Wang T, Liu J, Gao Q, Zhang X, Hong Q, Sun L: GIS prediction model of malaria trans-mission in Jiangsu province. Zhonghua Yu Fang Yi Xue Za Zhi 2002, 36:103-105.
19. Kitron U, Pener H, Costin C, Orshan L, Greenberg Z, Shalom U: Geographic information system in malaria surveillance: mosquito breeding and imported cases in Israel, 1992. Am J Trop Med Hyg 1994, 50:550-556.
20. Sithiprasasna R, Linthicum KJ, Liu GJ, Jones JW, Singhasivanon P: Use of GIS-based spatial modeling approach to characterize the spatial patterns of malaria mosquito vector breeding habi-tats in northwestern Thailand. Southeast Asian J Trop Med Public Health 2003, 34:517-528.
21. Bostoen K, Chalabi Z: Optimization of household survey sam-pling without sample frames. Int J Epidemiol 2006, 35:751-755. 22. Gemperli A, Vounatsou P, Kleinschmidt I, Bagayoko M, Lengeler C,
Smith T: Spatial patterns of infant mortality in Mali: the effect of malaria endemicity. Am J Epidemiol 2004, 159:64-72. 23. Hu H, Singhasivanon P, Salazar NP, Thimasarn K, Li X, Wu Y, Yang H,
Zhu D, Supavej S, Looarecsuwan S: Factors influencing malaria endemicity in Yunnan Province, PR China (analysis of spatial pattern by GIS). Geographical Information System. Southeast Asian J Trop Med Public Health 1998, 29:191-200.
24. leSueur D, Sharp BL, Gouws E, Ngxongo S: Malaria in South Africa. S Afr Med J 1996, 86:936-939.
25. Sharp BL, le SD: Malaria in South Africa – the past, the present and selected implications for the future. S Afr Med J 1996, 86:83-89.
26. Richie TL, Saul A: Progress and challenges for malaria vaccines. Nature 2002, 415:694-701.
27. Durrheim DN, La Grange JJ, Govere J, Mngomezulu NM: Accuracy of a rapid immunochromatographic card test for Plasmodium falciparum in a malaria control programme in South Africa. Trans R Soc Trop Med Hyg 1998, 92:32-33.
Publish with BioMed Central and every scientist can read your work free of charge "BioMed Central will be the most significant development for disseminating the results of biomedical researc h in our lifetime."
Sir Paul Nurse, Cancer Research UK
Your research papers will be:
available free of charge to the entire biomedical community
peer reviewed and published immediately upon acceptance
cited in PubMed and archived on PubMed Central
yours — you keep the copyright
Submit your manuscript here:
http://www.biomedcentral.com/info/publishing_adv.asp
BioMedcentral 29. Coleman M, Coleman M, Mabuza A, Kok G, Coetzee M, Durrheim D:
Evaluation of an operational malaria outbreak identification and response system in Mpumalanga Province, South Africa. Malar J 2008, 7:69.
30. Govere J, Durrheim DN, Baker L, Hunt R, Coetzee M: Efficacy of three insect repellents against the malaria vector Anopheles arabiensis. Med Vet Entomol 2000, 14:441-444.
31. Kager PA: Malaria control: constraints and opportunities. Trop Med Int Health 2002, 7:1042-1046.
32. Kapp C: Hazard or help? Lancet 2004, 364:1113-1114.
33. Booman M, Durrheim DN, La Grange K, Martin C, Mabuza AM, Zitha A, Mbokazi FM, Fraser C, Sharp BL: Using a geographical infor-mation system to plan a malaria control programme in South Africa. Bull World Health Organ 2000, 78:1438-1444. 34. Kulldorff M, Athas WF, Feurer EJ, Miller BA, Key CR: Evaluating
cluster alarms: a space-time scan statistic and brain cancer in Los Alamos, New Mexico. Am J Public Health 1998, 88:1377-1380.
35. Kulldorff M, Heffernan R, Hartman J, Assuncao R, Mostashari F: A space-time permutation scan statistic for disease outbreak detection. PLoS Med 2005, 2:e59.
36. Boscoe FP, McLaughlin C, Schymura MJ, Kielb CL: Visualization of the spatial scan statistic using nested circles. Health Place 2003, 9:273-277.
37. kulldorf m, Feuer EJ, Miller BA, Freeman LS: Breast Cancer in northeastern United States: a geographical analysis. Am J Epi-demiol 1997, 146:161-170.
38. Nkhoma ET, Hsu CE, Hunt VI, Harris AM: Detecting spatiotem-poral clusters of accidental poisoning mortality among texas counties, United States, 1980–2001. Int J Health Geogr 2004, 3:25.
39. Odoi A, Martin SW, Michel P, Middleton D, Holt J, Wilson J: Inves-tigation of clusters of giardiasis using GIS and a spatial scan statistic. Int J Health Geogr 2004, 3:11.
40. Govere J, Durrheim D, La GK, Mabuza A, Booman M: Community knowledge and perceptions about malaria and practices influencing malaria control in Mpumalanga Province, South Africa. S Afr Med J 2000, 90:611-616.
41. Morrison AC, Getis A, Santiago M, Rigau-Perez JG, Reiter P: Explor-atory space-time analysis of reported dengue cases during an outbreak in Florida, Puerto Rico, 1991–1992. Am J Trop Med Hyg 1998, 58:287-298.
42. Chadee DD, Kitron U: Spatial and temporal patterns of imported malaria cases and local transmission in Trinidad. Am J Trop Med Hyg 1999, 61:513-517.
43. Gaudart J, Poudiougou B, Ranque S, Doumbo O: Oblique decision trees for spatial pattern detection: optimal algorithm and application to malaria risk. BMC Med Res Methodol 2005, 5:22. 44. Hjalmars U, Kulldorff M, Gustafsson G, Nagarwalla N: Childhood
leukaemia in Sweden: using GIS and a spatial scan statistic for cluster detection. Stat Med 1996, 15:707-715.
45. Kulldorf M: A spatial scan statistic. Communications in Statistics: Theory and Methods 1997, 26:1481-1496.
46. Shaheen P, Clart JD, Williams D: Small area analysis: a review and analysis of North American literature. J Health Polit Policy Law 1987, 12:741-809.
47. Aamodt G, Samuelsen SO, Skrondal A: A simulation study of three methods for detecting disease clusters. Int J Health Geogr 2006, 5:15.