2638
COST FUNCTION BASED ON ANALYTIC HIERARCHY
PROCESS FOR DATA REPLICATION STRATEGY IN CLOUD
ENVIRONMENT
1MOHAMED REDHA DJEBBARA, 2HAFIDA BELBACHIR
Université des Sciences et de la Technologie d’Oran Mohamed Boudiaf, USTO-MB, BP 1505, El-M’naouer 31000 Oran Algérie
E-mail: 1[email protected], [email protected], 2[email protected]
ABSTRACT
Data stored on a cloud is becoming more and more important. Thus, data replication across multiple cloud nodes is considered an effective solution to achieve good performance in terms of response time, load balancing and most importantly, high data availability and reliability. To maximize the benefit of data replication, strategic placement of replicas in the system is critical. Several replica placement works have been proposed in the literature; the most of these works are based on five parameters (criteria): mean service time, failure probability, load variance, latency and storage usage. Weights of these criteria have always been proposed by the user to calculate a cost function. In order to improve this cost function, we propose in this paper an original approach based on a multi-criteria optimization model. According to the context of the five criteria mentioned above, we have chosen the AHP (Analytic Hierarchy Process) multi-criteria optimization method which makes it easier to use it to determine the coefficient of each criterion. This modeling of the cost function makes it possible to improve the selection of the candidate sites for replica placement, which have a good impact on the simulation results, and improve performances.
Keywords: Cloud, replica placement, cost function, AHP method
1. INTRODUCTION
Today, the field of information and communication technologies has become one of the pillars of modern society. The development of the cloud computing concept has been a major step towards the democratization of this field. Data management becomes one of the crucial elements of the infrastructure [1]. It plays a central and major role in the cloud and, as such, it needs to be given greater attention so that it is always available.
Data centers are considered as basic components of the clouds, they contain a large mass of data that are placed on different nodes in the same data center, or nodes in different data centers. In many large IT companies, several online storage platforms have been launched such as Amazon [2], Google GFS [3] and so on. To improve the reliability and availability of data in a cloud storage system, several systems, such as the Google File System and the Hadoop Distributed File System, are adopting the technique of data replication.
Data replication is a very well known and researched data management technique that has
been used for decades in many systems. Benefits of data replication include increased performance by strategic placement of replicas, improved availability by having multiple copies of data files and better fault-tolerance against possible failures of servers.
The role of replication in a system is not limited to the availability of the data and the reliability of the system, but more than that, yet other benefits such as minimizing the response time, load balancing, reduce effective network usage and so on. In order to get the most out of the gain that replicas can bring, their placement in the system is a very important point.
2639 context. Indeed, this method is applied to calculate a cost function of each system site. At the base of this function our strategy can easily locates the candidate site to place the replica. If we succeed in selecting the candidate site to place a replica, we can easily improve the performances of the system compared to the mean service time, failure probability, load variance, latency and storage usage.
To evaluate our approach and compare it with other existing works, we use CloudSim which is the best tool simulation known and used in domain of cloud simulation.
Our contribution improves the strategy proposed in [4], so as to put in place a more adapted approach that models the system as a multi-criteria optimization problem, and next applying the Analytic Hierarchy Process AHP method.
The remainder of the paper is organized as follows. Section 2 presents the most related works on existing data replication strategies in cloud. Section 3 presents our model and the detailed steps of our data placement approach. Section 4 demonstrates the simulation results and the evaluation we have adopted. Finally, Section 5 addresses our conclusions and future work.
2. RELATED WORK
The main goal of replicas placement strategies is to select the best sites to place replicas to improve performances. Replica placement belongs to the NP-complete class of problems [5,6]. The placement strategy performance can be affected by decisions such as:
- System model used - The cost model adopted
- Criteria used as metrics to improve performances
Wei et al. [7] presented a Cost-effective Dynamic Replication Management scheme (CDRM). They propose a model that studies the relationship between replica number and availability. The purpose of this model is to limit the number of replicas while meeting availability requirements. According to CDRM, the data replica placement is based on several parameters such as CPU power, memory capacity, network bandwidth and the saturation of data nodes storage system. They implemented CDRM in Hadoop distributed file system (HDFS). CDRM was compared to the default replication management of HDFS and evaluation results obviously show that CDRM
improved performance and load balancing. However, the replicas replacement was not taken into consideration.
Yuan et al. [8] proposed a matrix based k-means clustering strategy for data placement in scientific cloud workflows systems. In their strategy, they attempt to keep the datasets in one data center, with the goal that when jobs were scheduled to this data center, most, if not all, of the data they need are stored locally. Their idea was to study and determine dependency matrix for all the application data, which shows the dependencies between all the datasets including the datasets that may have fixed locations. Then they introduced the BEA algorithm [9] to cluster the matrix and partition it that datasets in every partition are highly dependent upon each other. The simulation results indicate that with this strategy, the data movement between the data centers is significantly reduced compared to a random data placement.
Li et al. [10] presented a new cost-effective dynamic data replication strategy named Cost effective Incremental Replication (CIR). Their strategy has the objective to reduce the storage cost and meet the data reliability requirement at the same time. CIR is a data reliability strategy for Cloud-based applications in which the focus is for cost-effectively managing the data reliability issue in a data center. The approach proposed in CIR is to calculating the replica creation time point, which indicates the storage duration that the reliability requirement can be met. In order to guarantee the reliability requirement, CIR dynamically increases the number of replicas by predicting when an additional replica is needed. The data storage model used in CIR exploits the relationship between the number of replicas and the storage duration. The simulation results demonstrate that CIR strategy can significantly reduce the number of replicas in a data center, and consequently, the storage cost of the whole storage system can be considerably reduced. Nonetheless, CIR did not consider the issue of the trade-offs between cost and performance.
2640 availability and efficient access of files in data centers. This strategy determines the popular files that are identified by analyzing the access history of the file. The popularity of a file is determined by the rate of access to that file by the clients. Once the access number of a popular file exceeds a predefined threshold, the replication system is triggered. Hence, the adaptive strategy finds the appropriate replication location based on a heuristic search for the best replication factor of each file. Simulation results show that the adaptive strategy improves the availability of the cloud system under study, but it doesn’t take into account the load balancing of the system.
Rajalakshmi et al. [12] presented a dynamic replica selection and placement (DRSP) architecture for managing replicas in cloud environment. The proposed strategy concentrates on designing an algorithm for suitable optimal replica selection and placement to increase availability of data in the cloud. In a first phase, the strategy consists of locating and creating replicas using catalog and index. The index is used for storing replica file into local or remote candidate site. In the second phase, the policy determines whether there is enough space, or not, in the candidate site to store the requested file. Experimental evaluation shows that DRSP stores data efficiently in selected sites and improves the performance of access and bandwidth utilization. Further, this strategy has not dealt with the storage usage issue and consistency of data file.
In Ref. [13], the author presented a Replicas Placement strategy based on Analytic Hierarchy Process in cloud data storage (RPAHP). Replicas placement was modeled as a classical Multi-Attribute Decision Making (MADM) problem. The analytic hierarchy process (AHP) is a structured technique for organizing and analyzing complex decisions. RPAHP considered six attributes (criteria), namely, CPU, Memory, Bandwidth, CPU Utilization, Memory Utilization, and Bandwidth Utilization, which characterized the Data Center and affected the DC performance. We noticed that the optimization criteria that have been chosen for the replicas placement concerned only data center components. The author neglected criteria judged much more important for a better choice of candidate sites for replicas placement such as: the response time, load variance, replicas frequently. AHP method was also used in other work of [14]. An algorithm based on fuzzy comprehensive evaluation, based on AHP method, was implemented. A Qos (quality of service) model of cloud storage service was proposed. Then, a Qos
preference-aware algorithm was introduced to deal with individual Qos sensitivity (IQS) constraints.
Mansouri [4] proposed an approach called “Adaptive Data Replication Strategy (ADRS) in cloud computing for performance improvement”. She proposed replicas placement strategy based on five parameters: mean service time, failure probability, load variance, latency and storage usage. At the base of these parameters, she calculated the cost function for each site. The smaller the Cost-Function value, the better the individual’s fitness. When a new replica was generated, the ADRS chose one of light-load sites to store the new replica. The simulation results showed that ADRS gave better performances compared to other works such as CIR [10], DRSP [12] and CDRM [7], according to the five parameters cited above. However, the proposed strategy presented some limitations. The calculation of the cost function was based on the user's proposal who was to gave weight to each parameter at one time.
According to this bibliographic study, we noticed that each strategy improved performances but in a well specified context. Meanwhile, each of these strategies has some limitations, we quote as an example, the load balancing criterion that was not taken into consideration by [11] and [13], or the strategy [12] which has not dealt with the storage usage issue and consistency of data file, and so on.
Among the works cited in this section, we look to the strategy proposed by N. Mansouri called (ADRS) [4] which used a maximum of criteria (5 criteria). Meanwhile, her strategy has been compared with some works cited above (CIR, CDRM, DRSP), and improved performances compared to the Average Response Time, Load Variance, Effective Network Usage, Replication Frequency and Storage Used. She calculated a cost function, for each site, based on service time, load variance, storage usage, failure probability and latency. The cost function that she used was calculated by applying the weighted sum method where the user proposed weights for each criterion. Nevertheless, this method, the weighted sum, had several limitations:
- The choice of weights is critical. The user sometimes finds it difficult to determine the values of w , w , w , w and w , or even the proportion between these weights.
2641 - Some efficient (non-dominated) data nodes
may never appear as an optimal solution for a weighted sum regardless of the set of weights selected.
- High sensitivity to small variations in weightings. Very slight variations in weight values can lead to radically different solutions - No intuitive correspondence between the
values of the weights and the optimal solution obtained by a weighted sum.
Our contribution is to improve the calculation of the cost function proposed in [4], so as to put in place a more adapted approach that models the system as a multi-criteria optimization problem, and applying the Analytic Hierarchy Process AHP method.
3. COST FUNCTION BASED ON ALALYTIC HIERARCHY PROCESS
In this section we present our approach called Cost Function based on Analytic Hierarchy Process for data replication strategy (CF-AHP). This section is organized as follows. First, we describe the model of the system used. Then we briefly mention the criteria used for calculating the cost function used in [4], and finally, we present our approach CF-AHP.
3.1 System Model
Before discussing our replication strategy, we must first define the system model of replication management used. The cloud storage cluster we propose in this paper is composed of m independent heterogeneous data nodes D , … , D , … , D storing a total of n different filesf , … , f , … , f .
Most file systems [15] suppose that each access to file f is a sequential read of the total file. In our system, each file must be placed entirely onto one data node, and thus, we do not consider file partitioning.
3.2 Cost Function Criteria
We kept the criteria used in [4], which are as follows:
Mean Service Time MST :
ST i, j d i, j (1)
Where:
ST i, j is the expected service time of file
f on the data node N (1<= j<= m),
d i, j is the decision variable that equals
to 1 if the file f exists on data node N, otherwise it
sets to 0; size is the size of file f and tp is the transfer rate of the data node N.
AR i ∑ Acc i, j (2)
Where:
AR i is the mean access rate;
Acc i, j is the access rate of read requests
coming from data node N asking for the file f .If the file f is not on the data node N, we set
Acc i, j 0.
The mean service time of file f can be defined as
ST i ∑ ST i, j , (3)
The mean service time of the system is given by the following:
MST ∑ ST i (4)
Load Variance LV:
Data node load variance is the standard deviation of data node load of all data nodes in the cloud storage cluster which can be used to show the degree of load balancing of the system. The lower value of load variance, the better load balancing is achieved. It is calculated as follows:
Load i, j Acc i, j ST i, j (5)
Storage Usage SU:
It is the storage space used in each node.
Failure probability FP:
If one node fails, a replica of the failed service will be possibly created on a different node in order to process the requests. Thus, it is better to place popular files in data nodes with low failure probability to minimize their latency.
Latency L:
The mean latency Latency i of file f is given as follows:
Latency i ∑ d i, j
Acc i, j (6)
Each file f has r replicas; B is the minimum bandwidth of data node N ;
Then, the mean latency L of the system can be computed by:
L ∑ Latency i
(7)
3.3 The Procedure Of CF-AHP
We propose a multi-criteria optimized data replication strategy for cloud storage. We take into account several factors such as mean service time, load variance, storage usage, failure probability and latency to select candidate data nodes for replica placement.
2642 we have chosen to use the Analytic Hierarchy Process AHP method which gives more flexibility to the users.
For a user, it is increasingly more controllable to make comparisons of criteria pair-by-pair instead of giving total weightings to the criteria, precisely as was the case with the weighted sum method. For that we apply AHP method (Analytic Hierarchy Process) for the cost function. This generic method of decision-making aid can be used with each time we have to make a decision on the basis of several criteria [16]. The cost function is used to determine the best sites candidates to place replicas.
The cost function is calculated as follows :
CostFunction c MST c LV
c SU c FP c L (8)
MST, LV, SU, FP and L are the criteria calculated in section 3.2.
c … c are coefficients determined by applying the AHP method, while passing by the following steps.
3.3.1 Determination of evaluation matrix
For the whole of the criteria, we calculate a matrix of analysis per pair to evaluate the importance of each one of them.
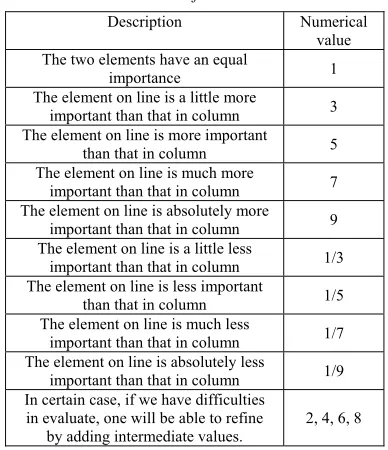
[image:5.612.97.291.437.662.2]Saaty and Vargas in [17] proposed an evaluation on 5 levels according to Table 1.
Table 1: Table Of Relative Scores.
Description Numerical value The two elements have an equal
importance 1 The element on line is a little more
important than that in column 3 The element on line is more important
than that in column 5 The element on line is much more
important than that in column 7 The element on line is absolutely more
important than that in column 9 The element on line is a little less
important than that in column 1/3 The element on line is less important
than that in column 1/5 The element on line is much less
important than that in column 1/7 The element on line is absolutely less
important than that in column 1/9 In certain case, if we have difficulties
in evaluate, one will be able to refine by adding intermediate values.
2, 4, 6, 8
On the base of this table, we build a square matrix whose elements of the lines and columns are the 5 criteria of the cost function (MST, LV, SU, FP and L). The values of the matrix are introduced by the
user by comparing the criteria two by two and
giving numerical values suggested by the table above.
3.3.2 Calculate the coefficient of each criterion
In the preceding step, we built a square matrix which rises from an evaluation 2 to 2 of the criteria. In order to calculate the coefficients of the criteria based on the values of our matrix, we proceed as follows:
- we calculate the sum by column
- we divide each value of the column by the sum of those
- The coefficient (which corresponds to the value of the matrix) is given by calculating the average of each line.
The ACP method will enable us to calculate the coefficients c , …, c in a formal way. However, it will be easy to calculate the cost function and from where we will be able to identify the sites candidates for the replicas placement. Our system chooses the site that has the lowest value of cost function to place replica.
3.3.3 Replicas replacement
Our strategy takes into consideration the replica replacement phase in case there is not enough storage space in the candidate sites. In this case, one or more files will be deleted based on several parameters such as:
- non frequently used files - replicas size
- file availability in other sites - replicas access history
Replicas access history allows us to have two important parameters, access number (AN) and the last time the replica was requested (LT). From there, we can define an indication of the probability of requesting the replica again. Another important parameter for replica replacement is the file size (S), it is better to replace files with large size to reduce the number of replica replacement.
We can calculate the potentiality (PT) of each replica with the following formula:
PT (9)
Where FA is the file availability, CT is the current time and the value of w , w , w , and w can be assigned by the users.
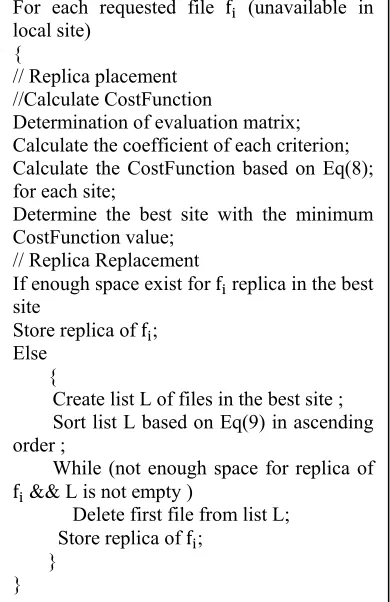
2643 Algorithm 1:The Procedure Of CF-AHP
4. EVALUATION AND SIMULATION RESULTS
In our study we use the simulator CloudSim which is the best tool simulation known and used in domain of cloud simulation.
4.1 CloudSim Presentation 4.1.1 CloudSim architecture
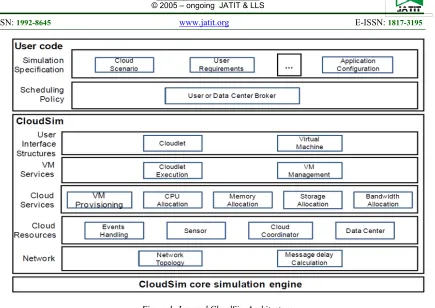
Figure 1 shows a multilayer architecture of the CloudSim software structure and its components. CloudSim used SimJava as a discrete event simulation engine that supports several basic features, such as queues, event processing, the creation of cloud system entities (services, hosts, Data Center, Broker, and VMS), communication between components and simulation clock management [18].
As illustrated in Figure 1, CloudSim architecture allows the modeling of the various components of a Cloud: Data Center, physical machines, virtual machines, etc. The management of all these resources is managed by the Cloud Services layer, managing the supply of virtual machines, the use of CPUs, RAM memory, storage capacity and
bandwidth of physical machines. In CloudSim, the tasks to be performed are treated as cloudlets that are allocated to virtual machines (VM Services and User Interface Structure layers). The configuration of each component must be managed by the user (Simulation Layer Specification) through a simulation configuration file.
Many parameters can be specified: • Number of Data Center, physical machines, virtual machines, tasks (cloudlets) • Data Center characteristics: architecture, operating system, hypervisor, operating costs • Characteristics of physical machines: number of CPUs, CPU capacity, memory capacity, storage
capacity, bandwidth
• Characteristics of virtual machines: CPU capacity, number of CPUs, memory capacity, storage capacity
• Cloudlet characteristics: number of statements to execute, size of input and output files.
4.1.2 Modeling virtual machines and cloudlets
The virtualization layer manages the execution of virtual machines on physical machines and the way that they run cloudlets [19]. CloudSim offers two modes of execution: shared time and shared space for running virtual machines on physical machines and also for cloudlets within virtual machines. The execution of the virtual machines is also managed by the instantiation of brokers. A broker can contain one or more virtual machines. The end of its life cycle is determined by the lifetime of each of the virtual machines that make it up. Thus, a broker completes its execution only when all the virtual machines that it contains have also finished their execution.
4.2 Experimental Settings
To start the simulation, the user uses the method startSimulation in its code. This method calls other methods such as run, runClockTick, runStart and runStop. All these methods dispose of entered cloudlets by a FCFS scheduling policy.
In our experimentation, file accesses show Poisson arrival rates and fixed service times. We only consider that all the data are read only, and thus no data consistency strategy is needed.
In the works of [4], the author compared her strategy called ADRS with other ARS, DRSP, CIR, CDRM and Build-time. According to experimentation results ADRS gave better results. In our experiment we opted to compare our strategy CF-AHP with ADRS which was already validated in the paper [4]. For that we used the same For each requested file f (unavailable in
local site) {
// Replica placement //Calculate CostFunction
Determination of evaluation matrix; Calculate the coefficient of each criterion; Calculate the CostFunction based on Eq(8); for each site;
Determine the best site with the minimum CostFunction value;
// Replica Replacement
If enough space exist for f replica in the best site
Store replica of f; Else
{
Create list L of files in the best site ; Sort list L based on Eq(9) in ascending order ;
While (not enough space for replica of
f && L is not empty )
Delete first file from list L; Store replica of f;
[image:6.612.92.287.101.402.2]2644 configurations that were installed in [4], and that are:
- We configure 64 datacenters geographically distributed in cloud with the corresponding topology shown in Figure 2.
- The service providers are represented by 1000 virtual machines. Each virtual machine (VM) is configured as 512MB RAM, 1000 MIPS, 1000M bandwidth, and single processer. - A hundred different data files are placed in the
cloud storage environment, with each size in the range of [0.1, 10] GB.
- 1000 tasks are submitted to the service providers using Poisson distribution and ensure their processing requirements larger than 10 MI, as well as adopt Random function to assign tasks file size and output file size. Each task requires one or two data files randomly.
- The host allocates query requests to each VM by the VMSchedulerTimeShared policy.
-
Initially, the number of replicas of each datafile is 1 and replicas are placed randomly.
4.3 Performance Evaluation Metrics
In order to compare our CF-AHP and ADRS replication strategy, we used the following metrics:
- Average response time (ART) ; - Effective network usage (ENU) ; - Load variance (LV) ;
- Replication frequency (RF) ; - Storage usage (SU) ;
The calculation of each criterion is as follows:
ART: for each data file, we can calculate the response time, which is the interval between the submission time of the task and return time of the result. The average response time of the system is the mean value of the response time for all data request tasks of the users, which can be obtained by the following equation:
If our system is composed of m users (j=1 … m), each user has m tasks to run (k=1…m);
ART ∑ ∑ ∑ (11)
Where UT rt and UT st are the return time and the submission time of the result of task k of the user j.
ENU: we have used the formula of [20] where ENU is given as follows :
ENU (12)
Where N is the number of access times that computing element reads a file from a remote site,
N is the total number of file replication operation, and N is the number of times that computing element reads a file locally. The effective network usage ranges from 0 to 1. A lower value of ENU means that the network bandwidth is used more efficiently.
LV: Data node load variance is the standard deviation of data node load of all data nodes in the cloud storage cluster. Load variance is used to represent the degree of load balancing of the system. The lower value of load variance, the better load balancing is achieved.
RF: it is the number of replications generated per data access. The lower value indicates that strategies are better at putting data in the proper nodes.
SU: it is determined as the ratio of filled space available in total space. The lower value indicates that strategies are better at placement and replacement of replicas in the system.
SU _ _ (13)
4.4 Simulation Results And Analysis
Let's start by commenting first on the RF (replication frequency) criterion, the results of simulations have shown that the two strategies give the same results in relation to the number of replicas generated. This is explained by the fact that both strategies (CF-AHP and ADRS) have the same replication principle that answers the question "When are we replicating".
2645 Figure 3: Mean Response Time Based On Varying
Number Of Tasks
As shown in figure 3 we find that there is a clear difference in the simulation results compared to mean response time.
In ADRS strategy, the author has calculated the cost function based on the weighted sum method, whereas the cost function of our CF-AHP strategy is based on the AHP method, which made the difference on the choice of candidate sites for replicas placement, and consequently, the placement of the replicas influenced the mean job time and even on the other criteria.
According to the figure 3, the difference between CF-AHP and ADRS is clear especially by exceeding 700 tasks. CF-AHP decreased the mean job time significantly by selecting the best replica location for execution tasks with considering replica cost.
Regarding the third criterion, which is LV(Load Variance), our strategy has taken into account the load balancing of data centers. The simulation showed that the LV variation of the two strategies converges, up to 400 files, but thereafter, CF-AHP consistently outperforms the ADRS in the load variance objective. Figure 4 shows the simulation results of load variance based on varying number of files.
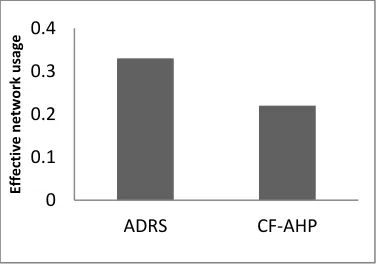
[image:8.612.91.294.70.273.2]As we have seen with ART criterion, our strategy gave less response time, so it was very logical to find that our strategy gives a very small network traffic compared to ADRS because the data are replicated in sites very close, or even, stocked locally, which clearly reduces the bandwidth consumed. The figure 5 illustrates the simulation results with ENU criterion. We found that CF-AHP decreases network traffic to 33% over ADRS.
Figure 4: Load Variance Based On Varying Number Of Files
Figure 5: Effective Network Usage
Regarding the last criterion (SU), the simulation showed that there was no difference between CF-AHP and ADRS. Both strategies occupied the same storage space, in the vicinity of 35%.
In addition to the results found above, if we compare the feasibility of using CF-AHP over ADRS, we find that for ADRS, when the user proposes weights for the five criteria at once, finds difficulties in adjusting their weights, but comparing them in pairs, the case of CF-AHP, and applying the principle of AHP, the weight assignment is more formal. This resulted in the subsequent change of the candidate sites for replicas placement.
In conclusion results, comparing our work with that of Mansouri [2016], simulation results have shown that our strategy improves the performance of three criteria which are ART (Average Response 0
5 10 15 20 25 30
100 300 500 700 900 1100
Response
time
/s
Total number of tasks
ADRS CF‐AHP
0 2 4 6 8 10 12
100 200 300 400 500 600
Load
variance/%
Total number of files
ADRS CF‐AHP
0 0.1 0.2 0.3 0.4
ADRS CF‐AHP
Effective
network
u
[image:8.612.333.522.349.481.2]2646 Time), LV (Load Variance) and ENU (Effective Network Usage), and for the other two criteria, RF (Replicas Frequency) and SU (Storage Usage), there was a convergence of results of our approach compared to that of Mansouri [2016].
5. CONCLUSION AND FUTURE WORK
In this work we proposed a strategy of placement and replacement of replicas named Cost Function based on Analytic Hierarchy Process for data replication strategy (CF-AHP). The application of AHP multi-criteria optimization method has as objective to facilitate the user's task in choosing the weights of the various parameters used in the calculation of the cost function. These parameters are: mean service time, failure probability, load variance, latency and storage usage. The definition of the coefficients of the criteria is very important in the calculation of the cost function, for this we choose the AHP multi-criteria optimization method to determine these coefficients. At the base of this function the system can determine the candidate sites for replica placement. We used the CloudSim simulator to compare CF-AHP with ADRS which gave better performances before. The simulation results showed that CF-AHP outperforms ADRS compared to metrics: Mean response time, effective network usage and load variance. Especially, its performance becomes better and better with the incensement of the number of tasks.
In a future work we plan to test other multi-criteria optimization methods such as Electre or Prométhée on the cost function. As a perspective too, we would like to integrate the economic concept and energy economic into our criteria, because these are very crucial points in cloud environment.
REFRENCES:
[1] R. Buyya, C. S. Yeo, S. Venugopal, J. Broberg, and I. Brandic, “Cloud Computing and Emerging IT Platforms: Vision, Hype, and Reality for Delivering Computing as the 5th Utility”, Future Generation Computer Systems,
25(6):599-616, Elsevier, June 2009.
[2] Amazon-S3.Amazon simple storage service (Amazon s3). http://www.amazon.com/s, 2009. [3] Ghemawat S, Gobioff H, Leung S. “The Google
file system”. In: Proceedings of the 19th ACM
Symposium on Operating Systems Principles.
2003.
[4] Mansouri N. “Adaptive data replication strategy in cloud computing for performance
improvement”. Frontiers Computer Science,
10(5): 925–935, 2016.
[5] Neves T A, Drummond L, Ochi L S, et al. “Solving replica placement and request distribution in content distribution networks”.
Electronic Notes in Discrete Mathematics, 36:
89-96, 2010.
[6] SHIJIA. YAO, WENLE ZHOU , HAOMIN CUI AND, MING. ZHU. “Video Replica Placement Strategy For Storage Cloud-Based CDN”.
Journal of Theoretical and Applied Information
Technology Vol. 59 no. 3, pp. 610-620. 2014.
[7] Wei Q, Veeravalli B, Gong B, Zeng L, Feng D. “CDRM: A cost-effective dynamic replication management scheme for cloud storage cluster”.
In: Proceedings of the IEEE International
Conference on Cluster Computing. 188–196 ,
2010.
[8] Yuan D, Yang Y, Liu X, Chen J J. “A data placement strategy in scientific cloud workflows”. Future Generation Computer
Systems, 26(8): 1200–1214, 2010.
[9] McCormick W T, Sehweitzer P J, White T W. “Problem decomposition and data reorganization by a clustering technique”.
Operations Research, 1972, 20(5): 993–1009.
[10] Li W H, Yang Y, Yuan D. “A novel cost-effective dynamic data replication strategy for reliability in Cloud data centres”. In: Proceedings of the 9th IEEE International Conference on Dependable, Autonomic and
Secure Computing. 496–502, 2011.
[11] Hussein M, Mousa M H. “A light-weight data replication for cloud data centers environment”.
International Journal of Engineering and
Innovative Technology, 1(6): 169–175, 2012.
[12] Rajalakshmi A, Vijayakumar D, Srinivasagan K G. “An improved dynamic data replica selection and placement in cloud”. In: Proceedings of the 2014 International Conference on Recent
Trends in Information Technology. 1–6, 2014.
[13] M. Radi, “Replica placement strategy based on analytic hierarchy process in heterogeneous cloud data storage”. International arab
conference on information technology, 2016.
[14] Wu, Xiuguo, Guan, Hongjun. “Data set replica placement strategy based on fuzzy evaluation in the cloud”. Journal of Intelligent & Fuzzy
Systems, vol. 31, no. 6, pp. 2859-2868, 2016.
[15] Xie T. “SEA: a striping-based energy-aware strategy for data placement in RAID-structured storage systems”. IEEE Transactions on
2647 [16] T.L. Saaty. “The Analytic Hierarchy Process”,
(book)McGraw-Hill, New York (1980), revised editions, Paperback (1996, 2000), Pittsburgh: RWS Publications.
[17] Saaty T L and Vargas L G, “Prediction, Projection, and Forecasting: Applications of the Analytical Hierarchy Process in Economics, Finance, Politics, Games, and Sports,” Kluwer Academic Publishers, Boston, 1991.
[18] R. N. Calheiros, R. Ranjan, A. Beloglazov, C. A. F. D. Rose, and R. Buyya, “Cloudsim : A toolkit for modeling and simulation of cloud computing environments and evaluation of resource provisioning algorithms,” Software :
Practice and Experience (SPE), vol. 41, no. 1,
pp. 23–50, 2011.
[19] R. Buyya, R. Ranjan, and R. N. Calheiros, “Modeling and simulation of scalable cloud computing environments and the cloudsim toolkit : Challenges and opportunities,” in Proceedings of the 7th High Performance Computing and Simulation Conference (HPCS),
IEEE press New York , pp. 21–24, 2009. [20] Cameron D G, Carvajal-schiaffino R, Millar A
P, Nicholson C, Stockinger K, Zini F. “UK Grid Simulation with OptorSim”. In: Proceedings of
2648
Figure 1: Layered CloudSim Architecture
[image:11.612.164.485.406.606.2]