D
EPARTMENT OF
E
CONOMICS
U
NIVERSITY OF
S
TRATHCLYDE
G
LASGOW
TERRORISM
,
EDUCATION
,
AND THE ROLE OF EXPECTATIONS
:
EVIDENCE FROM AL
-
SHABAAB ATTACKS IN KENYA
B
Y
MARCO ALFANO AND JOSEPH-SIMON GORLACH
N
O
19-04
S
TRATHCLYDE
Terrorism, education, and the role of expectations:
Evidence from al-Shabaab attacks in Kenya
Marco Alfano
∗& Joseph-Simon G¨
orlach
†March 2019
Abstract
This paper explores how terrorism alters human capital investment by affecting ex-pectations. Using different estimators, we identify a negative causal effect of terrorism on Kenyan primary school enrolment and attendance. Among these, we exploit al-Shabaab’s revenue streams and position in the al-Qaeda network to predict attacks. To isolate the significant contribution of indirect mechanisms—like expectations—we use finely geo-coded data on children and their closest schools as well as border disconti-nuities in educational provision, combined with media and attitudinal data. Moreover, we evaluate the degree and effect of the discrepancy between objective and subjective expectations in a structural model.
JEL Classifications: D74, I21, O15
Keywords: terrorism, education, expectations
∗Department of Economics, University of Strathclyde and Centre for Research and Analysis of Migration,
University College London
†Department of Economics, Bocconi University; BIDSA and IGIER. For helpful comments we would like
1
Introduction
Among respondents surveyed in Europe and North America, 58 percent are a “good deal”
or “very much worried” about terrorist attacks, on par with concerns about job loss or war
(World Value Survey, 2010-2013). In Africa, the share is 74 percent. These fears seem at odds
with the observed risks of dying in terrorist attacks in both regions, 9.2·10−5 percent and
9.6·10−4 percent respectively.1 However well founded concerns may be, they can nevertheless
affect decisions regarding the future, including investments in human capital.
In this paper, we examine the impact of terrorist attacks on primary school enrolment
and attendance. Specifically, we highlight the importance of expectations as a mechanism
through which terrorism affects behaviour. Different from many other types of violence, such
as gun crime or civil war, the explicit purpose of terrorism is the spread of fear and disruption
beyond the violent act itself (see Krueger and Maleckova, 2003; for a detailed discussion).
As a consequence of this strategy, terrorism can impact on educational outcomes in two
ways. Like other types of violence, terrorist attacks can affect educational outcomesdirectly
by destroying infrastructure and killing school personnel. However, because intimidation
is the motive behind many terrorist attacks, they are likely to affect educational choices also indirectly by changing expectations regarding the future; even for individuals physically
unaffected by attacks.
We investigate this in the Kenyan setting, which lends itself to a causal analysis, as parts
of the country have seen a stark increase in terrorist activity from the late 2000s onwards.
The vast majority of attacks are carried out by al-Shabaab, an Islamist terror organisation
based in Somalia with links to al-Qaeda. We explore the importance of expectations and the
mechanisms at play by exploiting the fact that many attacks do not occur on children’s way to
school or even in the administrative area they reside in. To further investigate the importance
of terrorism’s salience we draw on data on media coverage of attacks and individual attitudes
to violence. Moreover, we estimate a behavioural model of activity choices for children in the presence of terrorist attacks. This allows us to evaluate the importance of different
mechanisms, and to obtain an estimate for the discrepancy between objective mortality risk
and the subjective risk perceived by agents.
Before turning our attention to the role of expectations, fears and attitudes, we establish
a causal effect of terrorism on school enrolment, applying a range of estimators to several
independent data sources. In a first instance, we use the unique concentration of attacks in
spacetime to estimate various difference-in-differences specifications. Estimates using
Demo-1The percentages reported are the annual risk of dying from terrorist attacks in 2015. Numbers for
terrorist fatalities are drawn from the Global Terror Database (own calculations). Population numbers are
graphic Health Survey (DHS) data suggest that counties continuously exposed to terrorist
attacks experience a decrease in enrolment of around 15 percentage points, corresponding
to circa 25 percent. Each attack is found to decrease enrolment by 0.9 percentage points.
We do not find significant gender differences in the parameter estimates. Estimates using
enrolment data digitised from reports by the ministry of education suggest that each attack
keeps 243 children out of school.
A potential identification challenge is that terrorists select when and where to attack. We
cannot reject parallel trends during the early 2000s (before the sharp increase in terrorist
activity). Nevertheless, we exploit three features unique to the Kenyan setting to obtain
plausibly exogenous variation in al-Shabaab attacks. First, we use al-Shabaab’s position within the al-Qaeda network. Al-Shabaab has particularly strong links to the Yemeni branch
of al-Qaeda, al-Qaeda in the Arabian Peninsula (AQAP), from which it receives support and
guidance. We document not only that al-Shabaab closely follows AQAP in its timing of
attacks, but also that it chooses similar targets for its attacks. Second, we exploit the fact
that revenue streams for al-Qaeda derived from Yemen’s exports of hydrocarbons increase
the intensity of attacks by both AQAP and al-Shabaab. Finally, we look at al-Shabaab’s
main source of income directly: the export of charcoal. A major trading partner for Somalia’s
coal are the United Arab Emirates (UAE), and we use coal imports by the UAE as a third
exogenous variation. Estimates obtained from IV and OLS are of similar magnitude and we cannot reject the validity of the instruments.
We corroborate our results by zooming into two of the counties hardest hit by terrorist
attacks. Using longitudinal household data collected as part of the Hunger Safety Net
Programme (HSNP), we find that geographically close attacks reduce school attendance of
primary school aged children even conditional on household fixed effects. We also compare
the effect of terrorism with other types of violence, and find no influence of incidences of
violence unrelated to terrorism, such as protests, riots or general violence.
Since the causal reduced form estimates capture bothdirect physical effects, andindirect
effects of terrorism that operate via agents’ expectations, we provide three pieces of evidence all pointing towards a crucial role of the latter. First, we use the exact geographic coordinates
of individuals, schools and attacks and juxtapose two types of attacks: attacks close to
children’s residences or on their way to school on the one hand, and attacks further away
(but still in the same county) on the other. The relative importance of direct and indirect
pathways differs for the two, with attacks not in the immediate vicinity unlikely to affect
behaviour through physical damage. Although the effect of attacks in proximity to schools
or residences is considerably larger, attacks occurring elsewhere retain a significant effect. To
the fact that the responsibility and provision of education vary discretely at administrative
borders. We find that even attacks on Somali soil that are geographically close have a strong
and significant effect on school enrolment of Kenyan children in the border region, controlling
for attacks in a child’s Kenyan county of residence.
Second, we examine the influence of two factors that—by themselves—do not affect
in-frastructure or personnel directly: threats made by terrorist organisations andmedia coverage
of terrorist attacks. The correlations with enrolment are large and significant for both, again
conditional on the incidence of actual attacks carried out in any given county. Moreover, we
find that terrorist threats and media coverage of terrorist attacks regarding Somalia impact
negatively on educational enrolment in Kenyan counties adjacent to the Somali border. Fi-nally, we investigate attitudes directly. Using self-reported data from the Afrobarometer we
find no effect of terrorist attacks on self-reported experiences of violence but large effects on
concerns about violence.
Based on these insights about the importance of expectations, we formulate a simple
structural model of activity choices for children. Indirect effects include on the one hand
a change in agents’ risk assessment about leaving the home to either work or go to school.
On the other hand, terrorism may decrease the future returns to education by, for instance,
eroding institutions. In the model, we distinguish these two mechanisms. We estimate
the model’s structural parameters, which lets us evaluate the relative importance of different channels, and to obtain an estimate for parents’ perceived risk of children becoming casualties
of a terrorist attack. Contrasting this to the objective probability, we further can use the
model to assess the reduction in school attendance that is due to the misperception itself.
We employ moments constructed from the HSNP data, and maintain a close link with the
reduced form estimation by exploiting the quasi-experimental variation in attacks also for
identification in the structural estimation. Comparing the perceived probability of dying with
the actual number of deaths, our results suggests that parents over-estimate this probability
by a factor of 7.5, in line with studies documenting individuals’ over-estimation of mortality
risk in various contexts (see e.g. Fischhoff et al., 2000; Delavande et al., 2017). Finally, we use the model to obtain an estimate of the individual-level cost of terrorism, which we find
to amount to 1.6 times the average annual earnings of an adult without any schooling.
Our paper complements the literature on the consequences of violence by documenting
the importance of non-physical aspects as a mechanism through which behaviour is affected.
Several studies estimate either the total reduced form impact of violence (e.g. Justino et al.,
2013; Khan and Seltzer, 2016; Singh and Shemyakina, 2016; Koppensteiner and Menezes,
2018; Bertoni et al., 2018; Br¨uck et al., forthcoming) or explicitly model the physical
personnel (Monteiro and Rocha, 2017). A separate body of work, in turn, analyses the
im-portance of subjective expectations for educational decisions (Dominitz and Manski, 1996;
Jensen, 2010; Giustinelli and Pavoni, 2017; Boneva and Rauh, 2018; Attanasio et al., 2019;
Delavande and Zafar, forthcoming; see Hartog and Diaz-Serrano, 2014, and Giustinelli and
Manski, 2018, for overviews). We draw on insights from both of these literatures and
pro-vide epro-vidence that terrorism affects behaviour also by changing expectations. In addition,
by integrating the reduced form evidence in a structurally estimated behavioural model, we
can quantify the discrepancy between objective and subjective risk from terrorist attacks,
and evaluate its impact on education choices. A recent paper by Shany (2018) emphasizes
the negative effect of psychological distress on exam results of Israeli high school graduates during the Second Intifada. Our paper instead focuses on enrolment as a human capital
in-vestment decision that we find to respond to the salience of attacks—for instance by drawing
on media data. As such, the mechanism we investigate is closer to the work by Abadie and
Gardeazabal (2003, 2008), who document large negative effects of terrorism on economic
growth via a reduction in foreign direct investment, showing that terrorism can have severe
economic costs despite a limited direct physical impact.
This paper also contributes to the knowledge base on the workings of terrorist networks.
Part of our strategy to identify the causal effect of terrorist attacks exploits al-Shabaab’s
revenues and its position within the al-Qaeda network. The descriptive analysis leading to our first stage thus provides novel empirical evidence on the strong correlation between
at-tacks by al-Shabaab on the one hand, and its revenues and atat-tacks carried out by AQAP on
the other. The workings of terrorist organisations have already been documented in
quali-tative analyses (see Zimmermann, 2013; for instance). We provide a quantiquali-tative analysis of
these links. As such, the paper contributes on the growing literature on the determinants of
violence, like economic conditions (Miguel et al., 2004), colonial history (Michalopoulos and
Papaioannou, 2016) and ethnic composition (Amodio and Chiovelli, 2017), commodity prices
(Br¨uckner and Ciccone, 2010; Dube and Vargas, 2013; Bazzi and Blattman, 2014; Berman
et al., 2017; Ciccone, 2018) and donations (Limodio, 2018), social insurance (Fetzer, 2014) and unobserved coalitions between factions (Trebbi and Weese, forthcoming).
After first describing the context and data sources used, we estimate in Section 3 the
causal effect of terrorist attacks on school enrolment. In Section 4, we bring additional data
to the analysis to investigate the mechanisms driving the estimated reduced form effects.
Finally, Section 5 presents the structurally estimated behavioural model together with its
2
Background and data
The setting for our analysis is Kenya, which experienced a sharp increase in terrorist activity.
The majority of attacks were carried out from 2010 onwards by al-Shabaab in Kenya’s
northeastern region, bordering Somalia.
2.1
Terrorism in Kenya
Information on terrorist attacks is drawn from the Global Terrorism Database (GTD). The
GTD defines a terrorist attack as the use ofillegal force and violence by a non-state actor to
attain a political, economic, religious, or social goal through fear, coercion, or intimidation.2
For each incident in the data, the GTD collects information on, among other things, the geographic coordinate of the incident’s location, the target, number of casualties and injuries,
the weapons used and the group responsible.
The vast majority of terrorist attacks in Kenya are carried out by al-Shabaab, an Islamist
terror organisation based in Somalia with the aim of overthrowing governments in the Horn
of Africa region and to install Islamic rule. The organisation traces its origins back to the
early 2000s, when radical young Islamists merged with a group of sharia courts, the Islamic
Courts Union, to serve as a youth milita. During the last two decades, al-Shabaab has been
present in large parts of Somalia.3
Al-Shabaab is an affiliate of al-Qaeda with particularly strong ties to al-Qaeda in the Arabian Peninsula (AQAP). Al-Qaeda operates in a network structure with al-Qaeda core,
led directly by the “emir”, at its centre along with sets of affiliates. Closest to the core
are the regional affiliates, such as al-Qaeda in Iraq, al-Qaeda in the Islamic Maghreb and
al-Qaeda in the Arabian Peninsula. Next, are affiliates, which are organisations subscribing
to al-Qaeda’s ideology and influence. These are officially recognised by al-Qaeda core, have
pledged allegiance to the “emir”, and al-Shabaab is one of them. Furthest away are associates
that have not been publicly recognised as al-Qaeda but are close in terms of ideology. These
include, for instance, Boko Haram in Nigeria or the so-called Movement for Tawhid and
Jihad in West Africa. See Zimmermann (2013) for a detailed description of the al-Qaeda network.
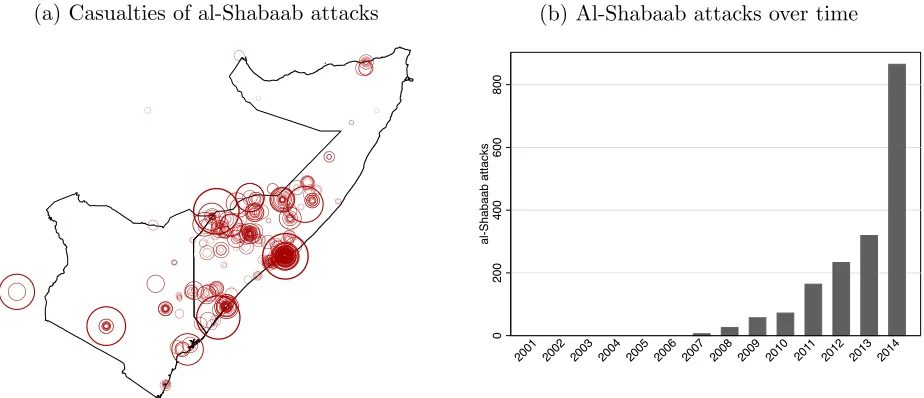
Figure 1 shows the geographical and temporal distributions of terrorist attacks carried
out by al-Shabaab from the early 2000s onwards. The vast majority occur in Mogadishu and
in the southwest of Somalia. A smaller number are carried out in other countries, mainly
Kenya, but also Uganda. Attacks increase sharply from the late 2000s onwards.
2The data are available under
https://www.start.umd.edu/gtd/about/.
Figure 1: Attacks of al-Shabaab
(a) Casualties of al-Shabaab attacks
(
(
(
(
(
(
(
(
(
(
(
(
(
(
(
(
(
(
(
(
(
(
(
(
(
(
(
(
(
(
(
(
(
(
(
(
(
(
(
(
(
(
( (
(
( (( ( (( ( ( ( ( ( ( ( ( ( ( ( (( ( ( ( ( ( ( ( ( ( (( ( ( ( ( ( ( ( ( ( ( ( ( ( ( ( ( ( ( ( ( ( ( ( ( ( ( ( ( ( ( ( ( (( ( ( ( ( ( ( ( ( ( ( ( ( ( ( ( ( ( ( ( ( ( ( ( ( ( ( ( ( ( ( ( ( ( ((( ( ( ( ( ( ( ( (( ( ( ( ( ( ( ( ( ( ( ( ( ( ( ( ( ( ( ( ( (( ( ( ( (((( ( ( ( ( ( ( ( ( ( ( ( ( ( ( ( ( ( ( ( ( ( ( ( ( ( ( ( ( ( ( ( ( ( ( (( (( ( ( ( ( ( ( (( ( ( (( ( ( ( ( ( ( ( ( ( ( ( ( ( ( ( ( ( ( ( ((((( ( ( ( ( ( ((( ( ( ( ( ( ( ( (( ( ( ( ( ( ( ( ( ( ( ( ( ( ( ( ( ( ( ( ( ( ( ( ( ( ( ( ( ( ( ( ( ( ( ( ( ( ( ( (( ( ( ( ( ( ( ( ( ( ( ( ( ( ( ( ( ( ( ( ( ( ( ( ( ( ( ( ( ( ( ( ( ( ( ( ( ( ( ( ( ( ( ( ( ( (( ( ( ( ( ( ( ( ( ( ( ( ( ( ( ( ( ( ( ( ( ( ( ( ( ( ( ( ( ( ( ( ( ( ( ( ( ( ( ( ( (( ( ( ( ( ( ( (((( ( ( ( ( ( ( ( ( ( ( (((( ( ( ( ( ( ( ( ( ( ( ( ( ( ( ( ( ( ( ( ( ( ( ( ( ( ( ( ( (( ( ( ( ( ( ( ( ( ( ( ( ( ( ( ( ( ( ( ( ( ( ( ( (( ( ( ( ( ( ( (( ( ( ( ( ( ( ( ( ( ( ( ( ( ( ( ( ( ( ( ( ( ( ( ( ( ( ( ( ( ( ( ( ( ( ( ( ( ( ( ( ( ((( ( ( ( ( ( (( ( (( ( ( ( ( (( ( ( ( ( ( ( ( ( ( ( ( ( ( ( ( ( ( (( ( ( ( ( ( ( ( ( ( ( ( ( ( ( ( ( ( ( ( ( ( ( ( ( ( ( ( ( ( ( ( ( ( ( ( ( ( ( ( ( ( ( ( ( ( ( ( ( ( ( ( ( ( ( ( ( ( ( ( ( ( ( ( ( ( ( ( ( ( ( ( ( ( ( ( ( ( ( ( ( (( ( ( ( ( ( ( ( ( ( ( ( ( ( ( ( ( ( ( ( ( ( ( ( ( ( (( ( ( ( ( ( ( ( ( ( ( ( ( ( ( ( ( ( ( ((( ( ( ( ( ( ( ( ( ( ( ( ( ( ( ( ( ( ( ( ( ( ( ( ( ( ( ( ( ( ((((((( ( ( ( ( ( ((((( ( ( (( ( ( (( ( ( ( ( (( ( ( (( ( ( ( ( ( (( ( ( ( ( ( ( ( ( (((( ( ( ( ( ( ( ( ( ( ( ( ( ( ( ( (( ( ( (( ( ( ( ( ( ( ( ( ( (((( ( ( (((((( ( (( ( ((((( ( ( ( (( ((( (( ((( ( ((((((((( ( ( ( ( ( ( ( ( ( ((( ( ( ( ( ( ( ( ( ( ( ( (( ( ( ( ( ( ( ( ( ( ( ( ( ( ( ( ( ( ( ( ( ( ( (( ((((((( ( ( ( ( ( ( ( ( ( ( ( ( ( ( ((b) Al-Shabaab attacks over time
0 200 400 600 800 a l-Sh a b a a b a tt a cks
2001 2002 2003 2004 2005 2006 2007 2008 2009 2010 201 1
2012 2013 2014
Notes: The figure reports total number of casualties and attacks by al-Shabaab during the years 2001-2014; radii indicate number of casualties per attack; Source: Global Terrorism Database; own calculations.
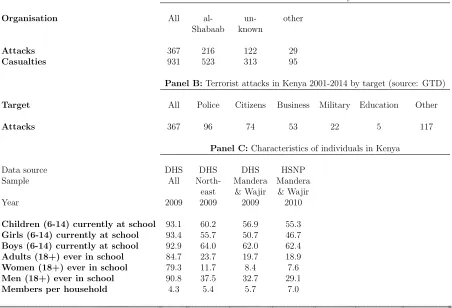
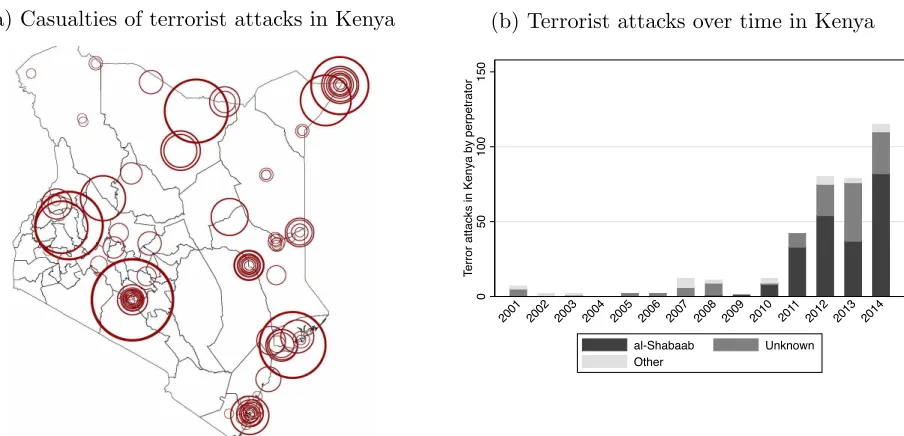
Between the years 2001 and 2014, Kenya experienced 367 terrorist attacks (see panel
A of table 1). Figure 2a reports the geographical distribution terrorist attacks in Kenya.
Most attacks are concentrated in the three northeastern counties of Kenya, which border
Somalia.4 The two largest towns, Nairobi and Mombasa also experience considerable number
of attacks. Figure 2b shows the temporal variation in terrorist attacks. Between the years
2001 and 2007, Kenya experienced relatively few attacks. From then onwards, the intensity
increases sharply, reaching 82 attacks in 2014. The maps in Appendix B further show the
geographical distribution of attacks over time for the years 2010 to 2014.
In contrast to Boko Haram in Nigeria and favourable to our purposes, al-Shabaab barely
targets educational institutions (see panel B of table 1). The most common targets for
al-Shabaab are the police (96 attacks), citizens (74 attacks), businesses (53 attacks) and the
military (22 attacks). Between 2001 and 2014, educational institutions were targeted only 5
times, corresponding to 1.4 percent of all attacks.
In fact, al-Shabaab attacks are only a relatively small proportion of violent incidences
occurring in Kenya. Armed Conflict Location & Event Data (ACLED) reports that
al-Shabaab attacked 215 times between 2001 and 2014. Over the same time period there were
3,759 other types of violent events.
Table 1: Summary Statistics
(1) (2) (3) (4) (5) (6) (7)
Panel A:Terrorist attacks in Kenya 2001-2014
Organisation All al- un- other
Shabaab known
Attacks 367 216 122 29
Casualties 931 523 313 95
Panel B:Terrorist attacks in Kenya 2001-2014 by target (source: GTD)
Target All Police Citizens Business Military Education Other
Attacks 367 96 74 53 22 5 117
Panel C:Characteristics of individuals in Kenya
Data source DHS DHS DHS HSNP
Sample All North- Mandera Mandera
east & Wajir & Wajir
Year 2009 2009 2009 2010
Children (6-14) currently at school 93.1 60.2 56.9 55.3
Girls (6-14) currently at school 93.4 55.7 50.7 46.7
Boys (6-14) currently at school 92.9 64.0 62.0 62.4
Adults (18+) ever in school 84.7 23.7 19.7 18.9
Women (18+) ever in school 79.3 11.7 8.4 7.6
Men (18+) ever in school 90.8 37.5 32.7 29.1
Members per household 4.3 5.4 5.7 7.0
Notes: Panel A: reports the total number and casualties of terrorist attacks by organisation in Kenya occurring 2001 to 2014; Source: Global Terrorism Database; own calculations. Panel B: reports the total
number of terrorist attacks by target of attack in Kenya occurring 2001 to 2014; Source: Global Terrorism Database; own calculations. Panel C: reports characteristics of respondents; column 1 is drawn from the 2009
DHS for the whole of Kenya; column 2 is drawn from the 2009 DHS for the northeast of Kenya (Mandera,
Figure 2: Terrorist attacks in Kenya
(a) Casualties of terrorist attacks in Kenya (b) Terrorist attacks over time in Kenya
0
50
100
150
T
e
rro
r
a
tt
a
cks
in
Ke
n
ya
b
y
p
e
rp
e
tra
to
r
2001 2002 2003 2004 2005 2006 2007 2008 2009 2010 201 1
2012 2013 2014 al-Shabaab Unknown
Other
Notes: The figure reports total number of casualties and attacks in Kenya by perpetrator during the years 2001-2014; radii indicate number of casualties per attack; Source: Global Terrorism Database; own
calculations.
2.2
Education in Kenya and summary statistics
Data on education in Kenya: We measure school enrolment in three different ways using
three distinct and independent data sources. First, we employ two rounds of the Kenyan
Demographic Health Surveys (DHS), 2009 and 2014, two nationally representative surveys of
Kenyan households.5 The 2009 and 2014 rounds of the Kenyan DHS interviewed all members
of 9,057 and 36,430 households, respectively (Kenya National Bureau of Statistics, 2009,
2014). In addition to many other subjects, the questionnaires collect extensive information
on educational enrolment and years spent in school.
We complement these data with official information on the total number of children
enrolled in primary school for each county from the Kenyan Ministry of Education. We
digitised these figures from the Statistical Abstract published annually by the Kenya National
Bureau of Statistics.
Finally, we use a household panel dataset collected to evaluate the Hunger Safety Net
Programme (HSNP) to focus on Mandera and Wajir, where a disproportionately high number of terrorist attacks occur. In order to evaluate the HSNP, data were collected on 2,436
households in the counties Mandera, Marsabit, Turkana and Wajir (see Appendix A for a
map of these) over three years between August 2009 and November 2012. This dataset also
5The data are publicly available at
records children’s major activity (school attendance, work or staying at home), and thus
allows us to assess how other activities are affected by the presence of terrorist attacks.
It further lets us confirm the estimated effects not only for school enrolment, but also for
attendance.
The educational situation in Kenya: Children enrol in primary school at age 6, and
the school year runs from January to November. At the end of each year, children
auto-matically advance to the next year. We use retrospective information on school enrolment
contained in the DHS to construct a panel for Kenya’s 47 counties as follows. We consider
children who at the time of the interview were below 14 years old. For each child, we use
information on time spent in school to construct a dummy variable taking the value 1 if the
child enrolled in school at age 6.6 For each year and county, we then match the fraction
of children to which this applies to the number of terrorist attacks in the same year and
county.7
For children turning 6 between 2010 and 2014, 79.2 percent enrolled by the age of 6. Our
figure tallies with other measurements of education for similar years. The World Bank, for
instance, reports a net primary school enrolment rate of 81 percent in 2012 (the last year
available).8
Summary statistics: With 60.2 percent, enrolment in 2009 is considerable lower in the
northeast than in Kenya as a whole, see panel C of table 1. Whilst for the whole country, gender gaps in enrolment are small, the northeastern regions show female disadvantages.
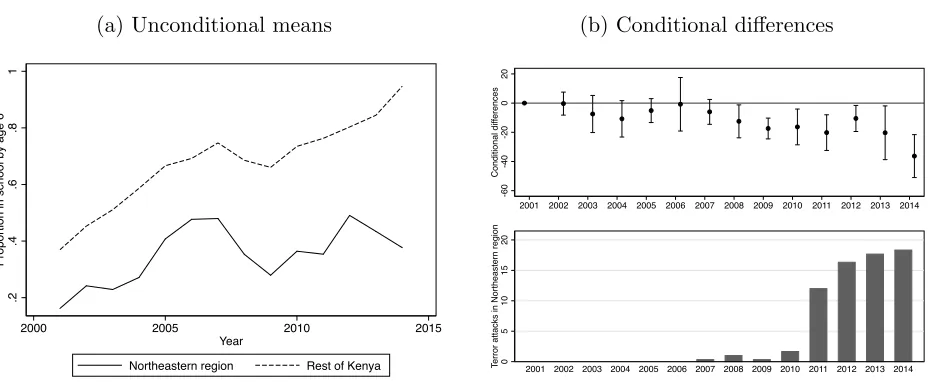
Panel A of figure 3 plots the dependent variable over time for the northeastern counties and
the rest of Kenya. The estimates show a clear parallel trends before 2008 and divergence
afterwards, when terrorist attacks increase.
3
The effect of terrorism on schooling
Before examining in detail the role of expectations and individuals’ perceptions in their re-sponse to terrorist threats, this section estimates the causal effect of terrorism on school
en-rolment. For this, we provide evidence from three completely different data sources described
in the previous section. We employ a range of estimators including difference-in-differences,
instrumental variables and household fixed effects estimations.
6We include children aged 7 at the time of interview since these children may have turned 7 between
enrolling in school and being interviewed by the DHS.
7We drop the small percentage (6%) of children who either dropped out of school or repeated (despite
it being banned), since for them we cannot correctly calculate the age at which they enrolled.
8Data were downloaded from
https://data.worldbank.org/; accessed November 2018. Net enrolment
is defined as the ratio of children of official school age who are enrolled in school to the population of the
Figure 3: Terrorist attacks and schooling over time
(a) Unconditional means
.2 .4 .6 .8 1 Pro p o rt io n i n sch o o l b y a g e 6
2000 2005 2010 2015 Year
Northeastern region Rest of Kenya
(b) Conditional differences
-6 0 -4 0 -2 0 0 20 C o n d it io n a l d iff e re n ce s
2001 2002 2003 2004 2005 2006 2007 2008 2009 2010 2011 2012 2013 2014
0 5 10 15 20 T e rro r a tt a cks in N o rt h e a st e rn re g io n
2001 2002 2003 2004 2005 2006 2007 2008 2009 2010 2011 2012 2013 2014
Notes: Panel a reports proportion of children enrolling in school by age 6 for northeastern Kenya (Mandera, Wajir and Garissa) and the rest of the country by year; Panel b reports conditional yearly differences in the proportion of children enrolling in school by age 6 between northeastern Kenya (Mandera, Wajir and
Garissa) and the rest of the country; lower panel shows number of attacks carried out in northeastern Kenya
by year; Sources: Demographic Health Surveys and Global Terrorism Database.
3.1
Difference-in-differences and OLS estimations
We start by comparing—over time—counties hardest hit by terrorist attacks to the rest of
the country using the following difference-in-differences specification
enrolmentct =α postt×af f ectedc+γc+τt+uct, (1)
where we control for unobserved heterogeneity across counties c in factors determining the
level of enrolment, as well as country-wide variation in aggregate conditions over time t.
To ensure that our results are not driven by an arbitrary specification, we vary both the
definitions of regions experiencing terrorism (af f ectedc) and of the time period when terrorist
attacks occur (postt). In particular, we vary the cutoffs forpostt= 1 between 2007 and 2011.
Similarly, we defineaf f ectedc= 1 for the three northeastern regions, and alternatively also
add Nairobi and Mombasa. We estimate equation (1) at the county level.
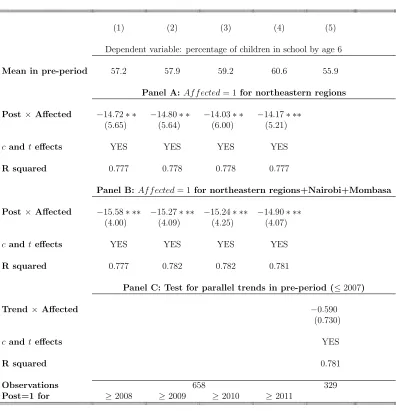
Table 2 reports the estimates for the difference-in-differences specifications. The data
used are drawn from the DHS and the dependent variable is the percentage of children
en-rolling in school on time, i.e. by age 6. The estimated effect is economically and statistically
significant, with a reduction in school enrolment of about 14 percentage points in regions
experiencing terrorist attacks compared to those that do not. In column (5) we test for a
Table 2: Effect of terrorism on school enrolment: difference-in-differences
(1) (2) (3) (4) (5)
Dependent variable: percentage of children in school by age 6
Mean in pre-period 57.2 57.9 59.2 60.6 55.9
Panel A: Af f ected= 1for northeastern regions Post× Affected −14.72∗ ∗ −14.80∗ ∗ −14.03∗ ∗ −14.17∗ ∗∗
(5.65) (5.64) (6.00) (5.21)
candteffects YES YES YES YES
R squared 0.777 0.778 0.778 0.777
Panel B:Af f ected= 1for northeastern regions+Nairobi+Mombasa Post× Affected −15.58∗ ∗∗ −15.27∗ ∗∗ −15.24∗ ∗∗ −14.90∗ ∗∗
(4.00) (4.09) (4.25) (4.07)
candteffects YES YES YES YES
R squared 0.777 0.782 0.782 0.781
Panel C: Test for parallel trends in pre-period (≤2007) Trend× Affected −0.590
(0.730)
candteffects YES
R squared 0.781
Observations 658 329
Post=1 for ≥2008 ≥2009 ≥2010 ≥2011
Notes: The table reports difference-in-differences estimates comparing the northeast (Mandera, Wajir and Garissa) to the rest of Kenya; dependent variable is the county average of children enrolled in school by
age 6; data structure is a panel for the 47 counties for the years 2001-14; post = 1 for years after (and
including) 2008 (column 1), 2009 (column 2), 2010 (column 3) and 2011 (column 4); Af f ected = 1 for
northeasterN Kenya (Mandera, Wajir and Garissa) in panel A and Nairobi, Mombasa, Mandera, Wajir and
[image:13.612.111.507.146.557.2]We also use this difference-in-differences framework to quantify and statistically test the
effect suggested in panel A of figure 3. For this, we substitute the postt dummy in equation
(1) with dummies for each year between 2002 and 2014. Panel B of figure 3 plots the yearly
differences in enrolment rates between the northeastern regions and the rest of the country
for each year. The results confirm large and statistically significant differences, which start
to appear only from 2007 onwards. Before that year, the trend appears parallel, which tallies
with our estimates from column (5) of table 2.
In order to quantify the effect of a single terrorist attack and to incorporate the fact that
some counties not located in the northeast also experience terrorist attacks, albeit not many,
we estimate a similar specification,
enrolmentct =δ attacksct+κc+θt+vct, (2)
where attacksct denotes the number of terrorist attacks occurring in county c in yeart. We
estimate equation (2) both at the county level, and using individual data that allow us to
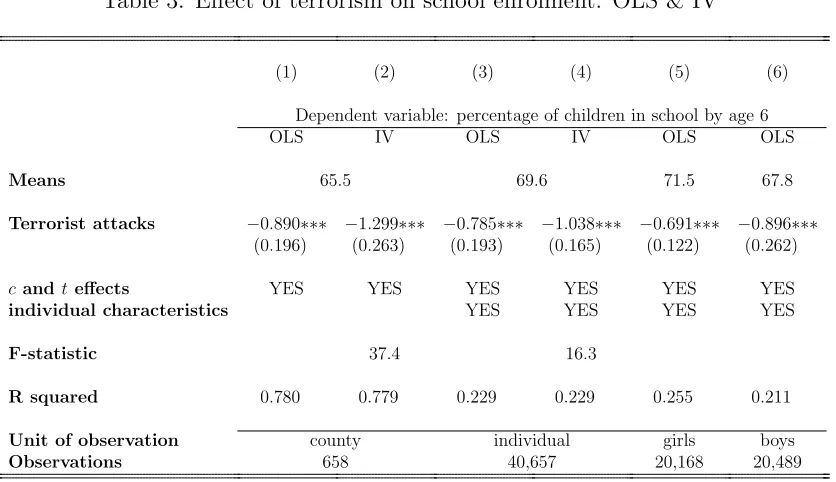
control for household and child characteristics. Results in both cases, reported in columns (1) and (3) of table 3, are very similar, and suggest that each attack decreases the share of
children enrolling in time by 0.8-0.9 percentage points. This also lines up with the
difference-in-differences estimates, as affected counties experience about 15 attacks per year. We also
distinguish by gender of the child in columns (5) and (6), but find no significant differences.
3.2
Instrumenting terrorist attacks
Although we do not find evidence for a violation of the parallel trend assumption required
for consistency of the difference-in-differences estimates, the estimator would be biased if
al-Shabaab targets areas that experience shocks which are correlated with enrolment decisions.
One possible concern might be that it is al-Shabaab’s strategy to target areas experiencing
positive economic shocks, possibly in order to maximise impact and social distress. This
would induce an upward bias in estimates of the effect of terrorism on school enrolment. Another possibility is related to findings by Limodio (2018), who documents the importance
of donations for the funding of Islamist organizations in Pakistan. If al-Shabaab can raise
higher donations in more affluent areas and is more active there, this would again induce an
upward bias.
We address these concerns by exploiting some unique features of the context in which
al-Shabaab operates in order to instrument its choice of both timing and location of attacks. To
predict the geographical location of terror incidences, we show that the probability of attacks
Table 3: Effect of terrorism on school enrolment: OLS & IV
(1) (2) (3) (4) (5) (6)
Dependent variable: percentage of children in school by age 6
OLS IV OLS IV OLS OLS
Means 65.5 69.6 71.5 67.8
Terrorist attacks −0.890∗∗∗ −1.299∗∗∗ −0.785∗∗∗ −1.038∗∗∗ −0.691∗∗∗ −0.896∗∗∗
(0.196) (0.263) (0.193) (0.165) (0.122) (0.262)
cand teffects YES YES YES YES YES YES
individual characteristics YES YES YES YES
F-statistic 37.4 16.3
R squared 0.780 0.779 0.229 0.229 0.255 0.211
Unit of observation county individual girls boys
Observations 658 40,657 20,168 20,489
Notes: The table reports the effect of terrorist attacks on school enrolment;Terrorist attacksis the number of attacks classified as terrorist per county and year; Columns 1-2: dependent variable is the county average of
children enrolled in school by age 6; data structure is a panel for the 47 counties for the years 2001-14; column 2 uses 3 instruments: interaction of 1/distance and attacks by AQAP, Yemen’s exports of hydrocarbons in
previous year and coal imports by United Arab Emirates in previous year; Columns 3-6: dependent variable
takes value 100 if a child is enrolled in school by age 6; data structure is one observation per child; individual controls include indicators for gender, rural community, electricity at dwelling, radio in household, television
in household; column 4 uses 3 instruments: interaction of 1/distance and attacks by AQAP, Yemen’s exports
[image:15.612.101.519.203.444.2]which influence the timing of attacks but are plausibly exogenous to the Kenyan context:
al-Shabaab’s affiliation to al-Qaeda, and revenue streams arising from hydrocarbon and coal
exports, both known to be major sources of revenues for these terrorist organisations. With
three resulting instruments, we have over-identification and can test instrument validity.
Location of attacks — Distance to Somali border: Carrying out terrorist attacks
is expensive9 and this cost is likely to increase with the distance from the area controlled
by the organisation in question. In the Kenyan case, this corresponds to distance from the
Somali border. An additional factor decreasing the costs of attacks close to the border in our
setting derives from the population in the border region being primarily of Somali ethnicity,
implying a lower cost for maintaining network structures and carrying out attacks. Distance to border has also been used in other contexts as an instrument for terrorist attacks (Rehman
and Vanin, 2017).
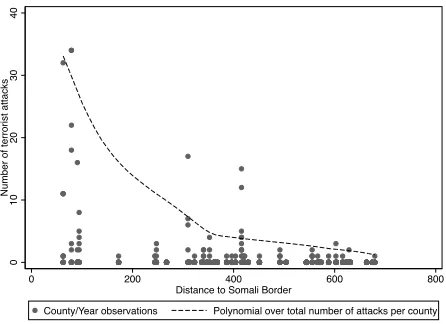
We illustrate the predictive power of distance to the border by plotting the total number
of terrorist attacks each county experienced between 2001 and 2014 against the distance
between that county’s centroid and the Somali border. Figure 4 shows a clear negative
correlation and a hyperbolic shape. We provide further evidence on the importance of
distance to the border controlling for other county characteristics in Appendix C, confirming
[image:16.612.196.419.445.607.2]that distance to border is by far the strongest predictor for the location of terrorist attacks.
Figure 4: Terrorist attacks and distance to Somali border
0
10
20
30
40
N
u
mb
e
r
o
f
te
rro
ri
st
a
tt
a
cks
0 200 400 600 800
Distance to Somali Border
County/Year observations Polynomial over total number of attacks per county
Notes: The figure shows total number of attacks occurring in each of the 47 counties of Kenya between 2001 and 2014 by distance between the county and the Kenyan/Somali border; Source: Global Terrorism
Database.
To predict terrorist attacks in spacetime, we combine distance to border with three factors
9See, for instance:
https://www.cfr.org/backgrounder/tracking-down-terrorist-financing
that affect the timing of al-Shabaab attacks. We interact each of these with distance to the
Somali border as follows
attacksct =φ timingt/distancec+λc+ιt+wct,
where distancec is the aerial distance between county c’s centroid and the closest point on
the Somali border. For timingt we use three separate instruments that we detail in turn.
Timing of attacks (I) — Al-Shabaab’s affiliation to al-Qaeda: We use al-Shabaab’s
position in the al-Qaeda network to obtain plausibly exogenous variation in the timing of
ter-rorist attacks carried out by al-Shabaab in Kenya. Al-Shabaab is an affiliate of al-Qaeda with
particularly strong ties to al-Qaeda in the Arabian Peninsula (AQAP). With encouragement
of al-Qaeda core, AQAP established and maintained close links with al-Shabaab (Rollins,
2011; Zarif, 2011). In practice, AQAP supports al-Shabaab in several ways. First, AQAP
provides al-Shabaab with financial help and it is believed that access to al-Qaeda’s resources
was one of the reasons for al-Shabaab’s loyalty pledge (Keatinge, 2014). Second, AQAP
pro-vides al-Shabaab directly with weapons and military training (Zimmermann, 2013). Third, AQAP shares personnel with al-Shabaab. It is known, for instance, that fighters have crossed
the gulf of Aden to Somalia (Hansen, 2013). AQAP itself carries out attacks mainly in Yemen
and Saudi Arabia.
Unsurprisingly, there is no systematic data on the documented financial, material and
training support between terrorist organisations. Nonetheless, we do observe data patterns
that are highly consistent with the qualitative evidence provided in the literature. The strong
degree of coordination between the two organizations is supported by the high correlation
in the timing of attacks that we highlight in figure 5a, which reports the frequency of
al-Shabaab and AQAP attacks, grouped into 4 week intervals. Given its global standing, the hierarchy plausibly puts AQAP above al-Shabaab in this relation (see also Lahoud, 2012;
Zimmermann, 2013).
To investigate the correlations between attacks of both organisations further, we construct
a weekly time series and regress the number of al-Shabaab attacks on attacks carried out
by AQAP.10The latter operates in a completely different geographical region to al-Shabaab,
almost exclusively in the Arabian peninsula, and never in Africa.11 The parameter estimates
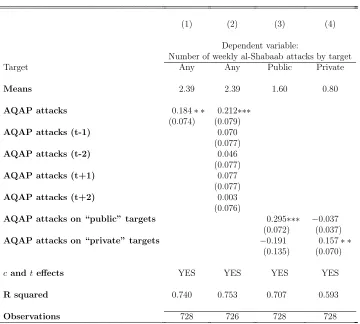
in table 4 show strong correlations, which are robust to different fixed effects. Moreover,
column (2) highlights that al-Shabaab attacks are correlated to AQAP attacks in the same
10We carry out Dickey-Fuller tests using various lags and reject the hypothesis of non-stationarity
through-out.
11The only terrorist incidences outside the Arabian peninsula attributed to AQAP were in the United
Figure 5: Natural gas, coal and terrorist attacks by AQAP and al-Shabaab
(a) Attacks by AQAP and al-Shabaab
0 40 At ta cks b y AQ AP 0 100 At ta cks b y a l-Sh a b a a b
2005 2010 2015
Attacks by al-Shabaab Attacks by AQAP
(b) Yemen’s gas exports and AQAP attacks
0 100000 200000 300000 400000 T e ra jo u le s o f liq u id n a tu ra l g a s e xp o rt e d 0 100 200 300 N r o f AQ AP a tt a cks
2000 2005 2010 2015
Year
AQAP attacks Yemen' liquid natural gas exports
(c) UAE’s coal imports and al-Shabaab attacks
0 500 1000 1500 2000 C o a l imp o rt s b y U AE (ki lo t o n n e o f o il e q u iva le n ts) 0 200 400 600 800 N r o f a l-Sh a b a a b a tt a cks
2000 2005 2010 2015
Year
AQAP attacks United Arab Emirates coal imports
Notes: Panel a shows attacks by al-Shabaab and AQAP for 4 week time periods; Panel b shows attacks by AQAP for each year and terajoules of natural liquid gas exported by Yemen; Panel c shows attacks by
week but not in previous or successive weeks. Yet more strikingly, when we distinguish
between private and public targets, we find that when AQAP attacks public (private) targets,
[image:19.612.130.490.155.479.2]so does al-Shabaab (columns 3 and 4).
Table 4: Attacks by AQAP and al-Shabaab
(1) (2) (3) (4)
Dependent variable:
Number of weekly al-Shabaab attacks by target
Target Any Any Public Private
Means 2.39 2.39 1.60 0.80
AQAP attacks 0.184∗ ∗ 0.212∗∗∗
(0.074) (0.079)
AQAP attacks (t-1) 0.070 (0.077)
AQAP attacks (t-2) 0.046 (0.077)
AQAP attacks (t+1) 0.077 (0.077)
AQAP attacks (t+2) 0.003 (0.076)
AQAP attacks on “public” targets 0.295∗∗∗ −0.037 (0.072) (0.037)
AQAP attacks on “private” targets −0.191 0.157∗ ∗
(0.135) (0.070)
candteffects YES YES YES YES
R squared 0.740 0.753 0.707 0.593
Observations 728 726 728 728
Notes: The table reports correlations between al-Shabaab and al-Qaeda in the Arabian Peninsula (AQAP) activity, measured as the total number of attacks carried out by al-Shabaab and AQAP per week; public
targets are police, military, governments and educational institutions; private tagets are civilians, religious leaders and businesses; data are drawn from Global Terrorism Database.
Timing of attacks (II) — Natural gas exports from Yemen: Our second source of
plausibly exogenous variation in the timing of terrorist attacks carried out by al-Shabaab in Kenya is the volume of Yemen’s exports of liquid natural gas. Besides ransom and extortions,
AQAP derives a large part of its income from those exports (Fanusie and Entz, 2017a). Since,
as mentioned before, AQAP provides financial assistance to al-Shabaab, part of these gas
revenues may indirectly be channelled to al-Shabaab. This financial resource channel is
particularly important since terrorist organisations cannot easily save or borrow over time
(Limodio, 2018). The pipeline to Balhaf from where natural gas from Yemen is exported in
Figure 5b illustrates the strong correlation between attacks by AQAP and liquid natural
gas exports. In 2014, less than 0.01 percent of Yemen’s natural gas are exported to Africa, so
that we can rule out any direct link with outcomes in Kenya.12 Our second instrument thus
predicts the timing of attacks by using Yemen’s exports of natural gas in hepta tons. We
use exports in year t−1 to predict attacks in year t to account for a lag in AQAP actually
extracting funds from gas exports.
Timing of attacks (III) — Coal imports by the United Arab Emirates:
Ex-porting and trading charcoal is one of the largest sources of funding for al-Shabaab, which
generated an estimated USD 83 million per annum between 2012 and 2014 (Fanusie and
Entz, 2017b; United Nations Security Council, 2012). Gulf Countries are the main destina-tion for Somali charcoal, with around 33 percent of Somali exports going the United Arab
Emirates (UAE) as one of the largest importers.13 Due to the close link between coal
ex-ports and al-Shabaab’s revenues, United Nations Security Council (2012) Resolution 2036
banned coal exports from Somalia in 2012. Despite this resolution, however, Somali coal
ex-ports continue illicitly and remain a major source of income for al-Shabaab (United Nations
Security Council, 2018).
We use imports of coal to the UAE as an exogenous shift in the demand for Somali
coal and thus for al-Shabaab’s finances. Figures from the United Nations Conference on
Trade and Development (UNCTAD) show that between 2001 and 2012 Somalia accounted for around 75 percent of all coal imported to the UAE. Again, demand for coal in the UAE
is arguably driven by factors exogenous to school enrolment choices by parents in Kenya.
Figure 5c shows a very strong correlation between coal imports to the UAE and al-Shabaab
attacks. The timing between the two figures further lends credence to a causal effect: coal
imports to the UAE tend to increase a few months before al-Shabaab attacks also rise.
In columns (2) and (4) of table 3 we use all three instruments simultaneously. The slightly
more negative 2SLS coefficients may point to the suspected upward bias in OLS estimates,
though the bias appears modest. The high F-statistics suggest that our three instruments
have a strong predictive power. Moreover, we cannot reject the validity of our instruments. In appendix D we use all three instruments separately. The very similar estimates obtained
using our three different instruments are reassuring.
12Trade data reported in the section are retrieved from UNCTAD webpagehttps://unctadstat.unctad.
org. Own calculations. Accessed February 2019.
13Made from acacia trees growing abundantly across the Horn of Africa, this charcoal is particularly
3.3
Robustness
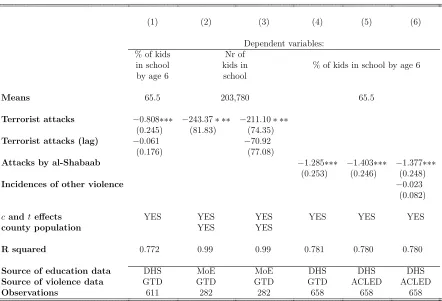
Lags and an alternative measure of education: In table 5 we scrutinize our specification
in more detail. In column (1), we add the one year lag of attacks as an additional explanatory
variable. The estimates suggest that lagged attacks are not important conditional on attacks
in the same year. This supports our focus on contemporary attacks as the main explanatory
variable. In columns (2) and (3) we re-estimate the effect of terrorism on education using an alternative data source. We digitised the total number of children in each county enrolled in
primary school from reports by the Kenyan Ministry of Education. Column (2) shows that
each attack decreases the number of pupils by 243 (controlling for the total population).
Column (3) confirms that for this data source, the lag of attacks is not important either.
Distinguishing between perpetrators and types of violence: The GTD cannot
attribute every attack unambiguously to an actor or organisation. As shown in figure 2, for
some attacks the perpetrators are unknown. To illustrate the effect of attacks attributable
to al-Shabaab only, we use only confirmed attacks. Column (4) of table 5 shows a negative
effect, the magnitude of which exceeds the corresponding one for all attacks shown in column (1) of table 3 above. In column (5) we compare these estimates with conflict data from the
ACLED project. The ACLED reports actors of incidences of violence and we select
al-Shabaab attacks only. The estimates are remarkably similar across both data sources. In
column (6) we use information on other incidences of violence contained in the ACLED to
compare the effect of terrorism to that of other types of violence. The estimates show that
once we control for terrorist attacks, other incidences of violence have a very small impact
on schooling.
The effect of terrorism on migration: To investigate whether the increase in terrorist
activity led individuals to migrate out of affected areas, we use information contained in the 2014 DHS on past migration. The survey reports the number of years respondents have been
living at their current residence. Using this information, we create a panel for each woman,
where the dependent variable takes the value 100 if she moved to her current residence in
any given year t. Regressing this on the number of attacks within the same county and
year shows that terrorist attacks have no impact on in-migration (see Appendix E). As
an alternative measure, we digitised county populations from official records for the years
2001 to 2014. The estimates show no significant effect of terrorist attacks on the number of
residents either.
Government responses to terrorist attacks and other robustness checks: We
further digitised data from official government reports to investigate the robustness of our
results with respect to two different types of expenditure. First, since Kenya provides a
Table 5: Effect of terrorism - robustness
(1) (2) (3) (4) (5) (6)
Dependent variables:
% of kids Nr of
in school kids in % of kids in school by age 6
by age 6 school
Means 65.5 203,780 65.5
Terrorist attacks −0.808∗∗∗ −243.37∗ ∗∗ −211.10∗ ∗∗
(0.245) (81.83) (74.35)
Terrorist attacks (lag) −0.061 −70.92
(0.176) (77.08)
Attacks by al-Shabaab −1.285∗∗∗ −1.403∗∗∗ −1.377∗∗∗
(0.253) (0.246) (0.248)
Incidences of other violence −0.023 (0.082)
candteffects YES YES YES YES YES YES
county population YES YES
R squared 0.772 0.99 0.99 0.781 0.780 0.780
Source of education data DHS MoE MoE DHS DHS DHS
Source of violence data GTD GTD GTD GTD ACLED ACLED
Observations 611 282 282 658 658 658
Notes: The table reports the effect of terrorist attacks on school enrolment;Terrorist attacksis the number
of attacks classified as terrorist per county and year;Terrorist attacks (lag)is the number of attacks classified
as terrorist per county in previous year; Attacks by al-Shabaab is the number of attacks attributed to
al-Shabaab per county and year; Incidences of other violence is the number of incidences of violence not
attributed to al-Shabaab per county and year; data structure is a panel for the 47 counties for the years
2001-14; all standard errors are clustered at county level; Column 1: dependent variable is the percentage
of children enrolled in school per county and year; data structure is one observation per county and per year; Columns 2 and 3: dependent variable is the total number of children in school per county and year;
data structure is one observation per county and per year, data drawn from Ministry of Education (MoE);
[image:22.612.89.531.172.473.2]expenditure on security. Second, we explore education expenditure. Including measures for
both does not change our results. Moreover, we estimate specifications where we drop the
two largest cities (Nairobi and Mombasa), use only the years 2009 to 2014 from the 2014
DHS, and include a separate time trend for the three northeastern counties. These results
are reported in appendix E and show that the effect of terrorist attacks persists throughout.
3.4
Panel estimates
Finally, we re-estimate the effect of terrorism using disaggregate data from the Hunger
Safety Net Programme (HSNP) household panel. This allows us to focus on variation within
a subset of affected counties, controlling for unobserved household characteristics.
In panel C of table 1 we compare characteristics of children and adults from the HSNP in
2010 (its baseline) with individuals drawn from the 2009 round of the representative Kenyan DHS. Although the HSNP was not designed as a representative sample of the counties it
sur-veyed, the characteristics of its respondents are remarkably similar to the overall populations
in those counties.
The HSNP reports the location of respondents’ residence. We use this information to
de-fine a location to beaffected by terrorism if it is located within 25km of an attack. Appendix
A shows attacks as red points, affected municipalities in yellow and unaffected ones in green.
We estimate a model based on equation (2), for which we count the number of attacks in
the 12 months prior to interview. The estimation sample includes children aged 6 to 14 at
the time of interview and the dependent variable takes the value 100 if the child is currently attending school. This dataset allows us to corroborate our results for attendance rather
than enrolment, which we have used so far. Notice that given our focus on within-household
variation, here we consider school attendance of children of any age.
The parameter estimates in columns (1) and (2) of table 6 show a significant negative
impact of terrorism of a magnitude comparable to the DHS estimates in table 3. Columns
(3) and (4) further show that the effect persists even conditional on household fixed effects.
Before turning to the mechanisms explaining the observed negative effect of attacks on
enrolment, we can use this household panel to investigate whether this coincides with an
increased share of children working. The dataset lets us distinguish whether children go to school, stay at home or work outside, categories that we explicitly incorporate in the
behavioural model of Section 5. Columns (5) to (8) of table 6 repeat the estimations for
working as the outcome variable. In our definition ”working” excludes unpaid domestic work.
The effect is estimated equally precisely, though closer to zero. It suggests that rather than
Table 6: Effect of terrorism on child activities: household panel data from northeastern Kenya
(1) (2) (3) (4) (5) (6) (7) (8)
Dependent variable = 100 if child is currently
Enrolled in school Working outside house
Means 61.3 15.2
Terrorist attacks −1.229∗∗∗ −1.215∗∗∗ −0.928∗ ∗ −0.885∗ ∗ 0.041 0.075 −0.054 −0.064
(0.333) (0.321) (0.325) (0.326) (0.242) (0.236) (0.203) (0.197)
candteffects YES YES YES YES YES YES YES YES
R squared 0.016 0.092 0.021 0.094 0.000 0.061 0.000 0.064
Covariates no yes no yes no yes no yes
Cluster FE yes yes no no yes yes no no
Household FE no no yes yes no no yes yes
Observations 7,077
Notes: The table reports the effect of terrorism on primary school attendance and child labour; terrorist attacks denote the number of terrorist attacks in the last 12 months wihtin a 25km radius of the municipality in which the child resides in; data are drawn from Hunger Safety Net Programme (HSNP) for counties
Mandera and Wajir; columns 1-4: dependent variable takes 100 if child reports to be currently enrolled in
school; columns 5-8: dependent variable takes 100 if child reports to be currently working outside the house; sample consists of children aged 6-14 at time of interview; all standard errors are clustered at municipality
[image:24.612.79.542.252.470.2]due to terrorist attacks coincides with an increase in the number of children staying home.
Thus, the reduction in school enrolment is unlikely to be driven by economic needs. In the
next section, we explore the mechanisms behind the observed effects in more detail.
4
The importance of expectations and perceptions
Terrorism differs from other types of violence, such as civil war or gun crime, in as much as its
direct effect on infrastructure and casualties is relatively low. Yet, its economic impact can
be severe. In a commentary for the Wall Street Journal, Becker and Murphy (2001) predicted terrorism to only have a limited economic impact, due to the small share of capital stock it
destroys. Abadie and Gardeazabal (2008) instead provide evidence for a more substantial
effect. They contend that terrorism affects expectations, which in turn may lower foreign
direct investment and hamper economic growth.
We extend this logic to human capital investment. Rather than through a direct physical
impact, terrorism primarily alters expectations about the risks and returns associated with
schooling. Nonetheless, the reduced form effects of terrorism based on equations (1) and (2)
capture the sum of suchindirect effects and a potentialdirect physical impact that terrorism
shares with other forms of violence. A key empirical challenge is to disentangle these two. In this section we provide three pieces of evidence which all point towards a crucial role
of expectations in households’ schooling decisions. First, we find that attacks occurring not
in the immediate vicinity of Kenyan children’s residence or on their way to school have a
significant effect on school enrolment. For children in the border region, we document an
effect even for attacks carried out in Somalia. Second,threats made by terrorist organisations
and media coverage of terrorist attacks, which by themselves do not affect infrastructure or
school personnel directly, are strongly and negatively associated with enrolment. Third,
terrorism is found to affect self reported attitudes towards violence but has no impact on
violence actually experienced.
4.1
Geographical location of attacks
In this section we first shed light on the importance of indirect factors by examining the proximity of attacks to respondents’ homes and the way to the closest primary school. A
second set of results rules out any direct effect by examining the effect of attacks on Somali
soil on education outcomes in Kenya.
Both sets of estimations show the same pattern: Attacks in close proximity to individuals
not on the way to the closest primary school retain a strong and significant negative impact,
even if they are located in a different administrative area. The latter shows that indirect
channels, such as changes in expectations, have an effect that cannot be explained by direct
physical impacts.
Attacks in Kenya (I) - distance to respondents: We begin by considering attacks
within a given radius around the geographic coordinate of respondents’ residence. This
approach is similar to the one adopted in a recent study by Bertoni et al. (2018). The
estimates in column (1) of table 7 show that terrorist attacks within 10km have a strong
negative impact.
Crucially for our argument, however, column (2) shows a significant effect also of terrorist attacks that occur further away in the county (denoted as “Anywhere else in county”). The
estimated effects are smaller than the ones for attacks within the 10km radius. This is to be
expected, as the effect of attacks in the vicinity of children includes both direct and indirect
effects of terrorism, and indirect effects plausibly increase with proximity. Nonetheless, the
magnitude of attacks not located close to individuals is sizeable, around 0.6 percentage points
per attack.
Attacks in Kenya (II) - way to school: To focus more closely on the effect on
education, we isolate attacks occurring along and at a distance from each childs way to
school. For this, we follow the methodology proposed by Koppensteiner and Menezes (2018), who use detailed information on children’s way to school to estimate the effect of gun violence
in Rio de Janeiro. Urban gun crime typically is highly localised, with a rather direct impact
on children. Our emphasis on theindirect effects of terrorism differs from this and mandates
that we focus on attacks without an immediate effect, and thusnot on the way to school.
To measure which attacks occur on the way to school, we overlay the geographic
coor-dinates of children’s residences with the coorcoor-dinates of all 31,231 primary schools in Kenya,
provided by the Kenya Open Data Initiative (KODI) Primary Schools dataset.14 See
ap-pendix A for a map of the DHS clusters and of Kenya’s primary schools. For each child, we
identify the closest school. The mean distance to the closest school is 1.98km. To account for possible detours on the way to school, we create a corridor of 5km around the shortest
connecting line between each child and the closest school. This corridor includes a 5km
ra-dius around the school, and thus captures any attacks occurring in the vicinity of the school.
As before, we add a variable counting the number of terrorist attacks occurring in the same
administrative unit the child reside in but not on its way to school (denoted as ”Anywhere
else in county”).
Column (3) of table 7 suggests that attacks occurring along the way to school have a
14Available under
strong effect, with each attack decreasing the probability of a child enrolling by 1.1 percentage
points. In column (4) we add the number of terrorist attacks in the same county but not
falling between a child’s residence and the closest primary school. As before, the coefficient
estimate has a significant magnitude of around -0.7 percentage points. Columns (5) and (6)
show that these effects are stronger for children living further than 2km from the nearest
school. A possible explanation is that longer journeys to school make terrorist attacks a
stronger concern. To allow for spatial dependence amongst children, we compute Conley
standard errors (Conley, 1999). The results remain robust and are available upon request.
Table 7: Effect of terrorist attacks for different distances from child and on way to school
(1) (2) (3) (4) (5) (6)
Dependent variable = 100 if child in school by age 6
Mean 69.6 75.5 45.1
Nr of terrorist attacks by location:
≤10km from child −1.176∗∗∗ −1.284∗∗∗
(0.181) (0.116)
Between child and closest school −1.116∗∗∗ −1.222∗∗∗ −1.082∗∗∗ −1.836∗ ∗
(0.230) (0.141) (0.150) (0.741)
Anywhere else in county −0.649∗∗∗ −0.695∗∗∗ −0.539∗∗∗ −0.853∗ ∗
(0.234) (0.240) (0.335) (0.215)
candteffects YES YES YES YES YES YES
individual characteristics YES YES YES YES YES YES
Distance to closest school <2km ≥2km
R squared 0.228 0.230 0.228 0.230 0.187 0.187
Unit of observation Child
Observations 40,657 32,727 7,930
Notes: The table reports the effect of terrorist attacks on school enrolment by precise geographical location
of attacks; Terrorist attacks (≤ 10km) is the number of attacks within 10km from each child per year;
Between child and closest school is the number of attacks occurring between each child and the closest
school per year; Anywhere else in county is the number of attacks per year that occur within the county
of residence of the child but not within 10km (in column 2) and not between child and nearest school (in
column 4); data are drawn from 2009 and 2014 round of DHS; all standard errors are clustered at county
level.
Attacks in Somalia (I) - Kenyan border counties: The above results confirm that
attacks do not have to occur on the way to school to affect education. It is strong evidence
[image:27.612.86.537.247.529.2]fact that the provision of education changes discretely at international borders. We focus
on north-eastern Kenya, and estimate whether attacks occurring in Somalia but close to the
border have an effect on enrolment in Kenya. An effect of terrorist attacks in Somalia on
Kenyan infrastructure or education personnel is improbable. However, given the geographic
proximity and shared ethnicity in the border region, Kenyans likely are well aware of violent
events across the border.15 We count the annual number of terrorist attacks in the two
Somali provinces sharing a border with Kenya,16 and interact this number with an indicator
for the three Kenyan counties that share a border with Somalia.17 By adding this interaction
to the specification in equation (2), we can test whether the impact of terrorist attacks in
Somalia on enrolment is larger in Kenyan border regions than in the rest of the country. The effect of Somali attacks on the whole of Kenya is absorbed by the time fixed effects. Column
(1) of table 8 shows that each attack in the Somali border region decreases enrolment by 0.1
percentage points more in Kenyan border regions than the rest of the country. This holds
despite the fact that we control for attacks carried out in each county. Column (2) considers
Kenyan counties located in the east of the country only (highlighted in yellow in map (g) of
Appendix A).18 The estimates remain robust.
Attacks in Somalia (II) - different distances from Kenyan children: Finally, to
estimate the direct, rather than the relative, effect of Somali terrorist attacks, we focus on
individuals. Using respondents’ geographic coordinates, we count, for each year, the number
of attacks which occurred within a given radius around each child and which were carried
out on Somali soil. To again condition on attacks in each county, we add this variable to
equation (2).
Columns (3) and (4) of table 8 show that Somali attacks have a large and significant
negative effect on school enrolment among Kenyan children living within 250km and 100km
from the attack. Each attack decreases the probability of enrolling in school on time by 0.2
percentage points and 0.5 percentage points respectively. As would be expected, for both
radii the effect is considerably smaller than the effect of attacks occurring in the child’s
own county. Columns (5) and (6) select only children living in eastern Kenya; as before, highlighted in yellow in Appendix A. The estimates remain strong and significant for this
sub-sample.19
15Overlaying Kenyan administrative boundaries with ethnographic maps based on the classical Soviet
Atlas Narodov Mira shows that the three northeastern regions fall into the ethnic homeland of Somalis,
which make up almost all of Somalia as well (Weidmann et al., 2010).
16These are Jubbada Hoose and Gedo.
17These are Mandera, Wajir and Garissa.
18We use counties in the three regions: Northeast, East and Coast
19We also estimate the same specification using a radius of 50km around each child and the results remain
Table 8: Effect of terrorist attacks inSomalia on education in Kenya
(1) (2) (3) (4) (5) (6)
Dependent variables
% in school by age 6 Dummy for child in school by age 6
Means 65.5 60.9 69.6 69.6 61.5 61.5
Attacks in Somalia×NE dummy −0.096∗∗∗ −0.098∗ ∗
(0.033) (0.035)
Attacks in Somalia≤250km −0.190∗∗∗ −0.190∗ ∗
(0.068) (0.076)
Attacks in Somalia≤100km −0.479∗∗∗ −0.481∗ ∗
(0.130) (0.179)
Attacks in same county −0.660∗∗∗ −0.507∗∗∗ −0.624∗∗∗ −0.746∗∗∗ −0.514∗∗∗ −0.631∗∗∗
(0.203) (0.156) (0.114) (0.169) (0.105) (0.161)
candteffects YES YES YES YES YES YES
R squared 0.781 0.784 0.230 0.229 0.229 0.231
Unit of observation county Child
Sample all East all all East East
Observations 658 238 40,657 40,657 15,204 15,204
Notes: The table reports the effect of terrorist attacks in Somalia on educational enrolment in Kenya;
Terrorist attacks is the number of attacks classified as terrorist per county and year;Attacks in Somalia are
total number of attacks in the two most western provinces of Somalia per year;NE dummy is an indicator
taking the value 1 for the three northeastern Kenyan counties bordering Somalia (Mandera, Wajir and
Garissa);Attacks in Somalia≤250kmare attacks on Somali soil occurring within 250km of childiper year;
[image:29.612.83.527.219.489.2]4.2
Threats of terrorism and media coverage of terrorist attacks
As a further corroboration of the importance of expectations, we analyse the role of two
factors for which we can plausibly rule out any direct effect on infrastructure or the number
of casualties. First, we considerthreats made by terrorist organisations. A common strategy
among these organisations is to issue threats of attacks or violence with reference to more
or less precisely stated target locations. We find a strong relation between terrorist threats made about a particular area and primary school enrolment in that region. These persist
even after we control for any terrorist incidences actually occurring in the region. Second, we
estimate the role of media coverage of terrorist attacks. Again, we find a negative relation,
which is robust to the inclusion of the number of attacks actually carried out.
The data for this analysis are drawn from the Global Database of Events, Language, and
Tone (GDELT) project. The GDELT monitors media outlets such as print, broadcast and
web news worldwide, and provides information on organisations, people, themes, quotes,
images and many more in almost real time.20 For Kenya, the GDELT records to which of
the country’s 8 regions an event refers (see map in Appendix A). We use this information to construct a region/year panel, which we then match with primary school information on
the 47 counties used so far, which are sub-strata of the 8 regions.
The GDELT keeps a record of threats made. These are defined as exclusively verbal
acts. The two sub-categories of threats most relevant for the present purpose are threats of
“unconventional forms of violence”, which the GDELT stipulates include terrorist threats,
and threats of “unconventional forms of mass violence”. Using this information, we sum
all terrorist threats per region/year and include it to the OLS specification of equation (2).
Figure 6 shows the evolution of terrorist threats and media coverage of terrorist attacks for
Kenya and Somalia.
Panel A of table 9 shows the correlation between threats made to a particular area of
Kenya and the number of actual attacks carried out in that area, net of time and county
effects. The coefficient estimate is small and not statistically different from zero, suggesting
a rather weak correlation between threats and actual occurrence of attacks. Panel B
in-vestigates the relationship between terrorist threats and educational enrolment. Column (1)
shows a strong negative relationship between threats and the percentage of children in school
by age 6. Column (2) highlights that this relation remains robust even after we control for
attacks carried out in that particular region. This suggests an association of threats with
educational outcomes above and beyond the number of attacks actually carried out in a given region. We also test whether terrorist threats made regarding Somalia affect behaviour in
the authors upon request.
20The data are freely available under