Effect of Free Basic Education on Improving Quality of Life in
Kenya: Evidence from Machakos County
Joshua M. Ngelu*1 Dr. Jane Omwenga2 Dr. Joseph Mungatu3 Dr. Mike Iravo3
1. PhD Candidate, College of Human Resource Development, JKUAT 2. Jomo Kenyatta University of Agriculture and Technology, COHRED
3. Jomo Kenyatta University of Agriculture and Technology, COPAS Abstract
This study investigates the effect of free basic education on improving quality of life in Kenya - evidence from Machakos County. Probit model was applied to model the empirical analysis. The findings of the study affirm that free primary and secondary education have increased school enrolment among the households in Machakos County. Regarding effect on the quality of life, primary school enrolment and completion rate following the introduction of free primary education is more likely to improve the quality of life albeit insignificantly. On the contrary, secondary school enrolment and completion rate are both more likely to improve the quality of life among the households in Machakos County.
Keywords: Free basic education, and probit model JEL Classification: C32, C53
1.0 Introduction
Since 2001 the Government of Kenya intensified its efforts to fight poverty as indicated by the policy documents such as the Poverty Reduction Strategy Paper (PRSP), (Republic of Kenya, 2001). The PRSP outlines priorities and strategies to be taken to reduce poverty in Kenya. The PRSP is therefore one of the strategies in the reduction of poverty as outlined in the National Poverty Eradication Plan, the UN Millennium Development Goals (MDGs) and 2030 Agenda, Sustainable Development Goals (SDP). Based on the PRSP Kenya prepared its Medium-Term Expenditure Framework (MTEF) budget system in 2001/2002, which aimed at improving the quality of expenditure by shifting resources towards pro-poor activities and programmes. In 2003/2004 Kenya developed its Medium-Term Plan which was called “Economic Recovery Strategy for Wealth and Employment Creation “(ERC) (Republic of Kenya, 2003). The ERC created the following pro-poor activities, first the free primary education, secondly the Constituency Development Fund (CDF), and thirdly the Local Authorities Transfer Fund (LATF). It can be noted that both CDF and LATF go directly to local levels, therefore providing the people at the grassroots the opportunity to access social assistance programmes.
Kenya National Bureau of Statistics (KNBS), in its report of 2006, the Kenya Integrated Household Budget Survey (KIHBS), estimated the level of absolute poverty incidence at 45.9%, while the absolute rural poverty stood at 49.1% (Republic of Kenya, 2007). In 2008 the Government of Kenya launched the Vision 2030 as a long-term development plan (Republic of Kenya, 2008). Within the Vision is a proposed package of pro-poor programmes included in the education and health sectors, effectively supporting activities that provide social protection and development of human capital. According to the 2009 Population and Housing Survey, the population of Kenya stood at 38 million, 46% of whom live below the poverty line level of one dollar a day. Among these, 19 percent live in extreme poverty. Of the population 20.6 million people are aged below 18 years of age hence children comprising over 53% of the total population (KNBS, 2010). It is estimated that 2.4 million children are orphans, with 2% of these children having lost both parents. Besides poverty, Kenya is also a very unequal country where the gap between the rich and the poor has continued to increase over time which is evidenced by high GINI coefficient hence the disparities between rural and urban areas, disparities in incomes and access to education, health and other basic needs like water, adequate housing and sanitation.
However, despite there being various poverty reduction strategies since independence, there has been a marked increase in the number of poor and vulnerable people in Kenya (Tegemeo, 2009). The hardest hit among these are children and the elderly. Owing to this realization, the Government of Kenya has intensified the fight against poverty through the implementation of the above poverty reduction strategies.
Machakos County is one of the 47 counties in Kenya with 10 Constituencies. The County has 59.6% of the population living below poverty line with 58% and 27% of the population having attained primary and secondary levels of education respectively, while 17% and 32% of households are connected to electricity and clean drinking water respectively. It’s clearly evident that poverty levels in the County are above the national poverty levels. Given this scenario, the study will investigate the effect of free basic education on improving the quality of life in Kenya- evidence from Machakos County. The findings will inform the policy-makers at both the national and county level towards the realization of the poverty reduction agenda.
2.0 Overview of free basic education in Kenya
In Kenya free primary education was introduced in 2002 as result of the international community agreement on the 8 Millennium Development Goals (MDG) in which education for all was one of the goals. Later in 2008 free secondary education was introduced so that the basic education was made free in Kenya.
In the primary education sub-sector pupils’ enrolment increased from 8.8 million to 9.86 million in 2010 and 2011 respectively, while the transition rate from primary to secondary schools increased from 66.9% in 2009 to 72.5% in 2010 and further rose to 73.3% in 2011. In the case of secondary education sub-sector where the free education brought on board grants disbursement and school infrastructure development disbursement, funds disbursed rose to KSh 17.7 billion in 2011/2012 disbursed to 1.7 million students, while enrolment increased from 1.18 million students in 2007 to 1.5 million students in 2009. This increased further to 1.7 million and 1.8 million students in 2010 and 2011 respectively. On overall Gross Enrolment Rate (GER) rose from 45.3 % in 2009 to 47.8% in 2010 and further soared to 48.8% in 2011.
Generally, there is common agreement that education is core in development of the human capital via instilling skills among the learners which increases their productivity and hence better livelihood in the long run. This is ascertained in the economic literature on the link between human capital development and economic growth. The importance of education and human capital formation in promoting economic growth and development of developing countries cannot be overemphasized. Schultz (1961), Dickens & Tebbs (2006) have shown that education and skills acquisition has positive effects on economic growth and development. As such, investments in children’s education is the main avenue for human resource development and capital accumulation required for building long- term productive capacity of a country. It is, therefore, essential that a country provides perfect environment for unfettered access to knowledge and skills that would increase the future productivity of children.
Since nearly its inception, the study of economic growth has focused on the importance of education. This argument is based on the belief that education is core in human capital development. As such, primary school and secondary school enrolment positively contribute to better quality of life via improved human capital that comes from acquisition of skills and knowledge that ultimately leads to increased national output. Solow (1957) described growth of national income as resulting from three sources: increases in the stock of physical capital (machines and buildings that are used to produce goods and services), increases in the size of the labour force, and a residual representing all other factors. This residual contributed considerably more to per capita growth than the increase in the capital stock. Solow dubbed the residual “technical progress” and noted that increasing levels of education was one of the factors that contributed to its growth. Using the same basic approach as Solow, but taking explicit account of the role of education, Edward (1985) estimated that between 1929 and 1982, increasing levels of education accounted for 16 percent of the growth of total potential output in non-residential business. A more recent study by Dale Jorgenson and Kevin Stiroh (2000) puts the contribution of education to economic growth at 8.7 percent of total growth over the recent period 1959 to 1998 and 13 percent of growth in output per worker.
Neo-classical economists expanded the Solow growth model to treat education as a separate factor of production. In the expanded model the “stock” of human capital is measured in a way similar to the stock of physical capital. The expanded model tries to endogenize human capital to be determined within the model. This is done by the years taken to acquire education upon enrolment. A person year of education is valued at the cost of producing it and all the person years are added up to get the stock. Increases in the stock of human capital, or in any other specific factor of production, are assumed to produce less than proportional increases in output since the various factors must be combined to obtain an increase in output. Specifically, a one percent increase in the stock of human capital is assumed to cause somewhat less than a half a percent increase in national income.
In the Solow framework the impact of a one percent change in the stock of a factor of production is equal to its share in national income. A one percentage point increase in the capital stock causes only about a third of a percentage point increase in output because capital’s share of national income is only about a third. Labour gets most of the other two-thirds, and typical studies attribute two-thirds of that to human capital as opposed to raw labour. Thus increases in the number of workers, with no change in the total number of years of education, would have an impact smaller than an equal proportional increase in the stock of physical capital. But an equal proportional increase in the stock of human capital (person years of education) would have an effect twice that size. Some other theories of how education affects output suggest the gain could be even larger than this. Moreover, empirical work by Hina et al (2015) asserts that primary education is instrumental in raising economy in Pakistan. They therefore recommend that primary education must be imparted at levels indiscriminately by the government for fostering the economic growth pace in Pakistan
.
3.0 Methodology
skills and knowledge. The dialogue is based on the enrolment in primary and secondary schools and the completion rates in primary and secondary schools. On the education front, literature reviewed clearly demonstrates that provision of basic education is core in improving the quality of life among the poor via increased income, household expenditure and savings. This is because education impacts the skills among the learned, leading to development in the human capital, this in turn increases labour productivity which ultimately results into increased national income, increased savings given that savings is a function of income. In addition, given that expenditure is an increasing function of income, therefore a rise in income levels following increased human capital development through education implies increased household’s expenditure.
Schultz (1961), Dickens & Tebbs (2006) have shown that education and skills acquisition has positive effects on economic growth and development. As such, investments in children’s education is the main avenue for human resource development and capital accumulation required for building long- term productive capacity of a country. It is, therefore, essential that a country provide perfect environment for unfettered access to knowledge and skills that would increase the future productivity of children. As such, primary school and secondary school enrolment positively contribute to better quality of life via improved human capital that comes from acquisition of skills and knowledge that ultimately leads to increased national output. Also, Jorgenson and Stiroh (2000) assert that the contribution of education to economic growth is 8.7 percent of total growth over the 1959 to 1998 period and 13 percent growth in output per worker.
A study by OECD (2012) concludes that early school leavers have lower income jobs than secondary school graduates and pay fewer taxes since low-skilled labour earns lower wages, which represents lower income tax revenues. According to Basic Education Coalition (2004) and USAID (2005) each year of schooling “increases individual output by 4 -7 percent, and countries that improve literacy rates by 20-30 percent have seen increases in gross domestic product (GDP) of 8-16 percent. As such increased income level, savings and expenditure would be an ideal measure of improved quality of life. OECD (2012), assert that early school leavers have lower income jobs than secondary school graduates and pay fewer taxes since low-skilled labour earns lower wages, which represents lower income tax revenues. Belfield and Levin (2007) estimate for California that each additional high school graduate produces a net fiscal gain for the total public sector during the lifetime of the graduate of about USD 169 000. A study in Canada (Canadian Council on Learning, 2009) showed that students who have not completed upper secondary education make up 42.7% of all welfare recipients and that 85% of income assistance, including welfare and other support, is spent on people who have not completed secondary education (high school).
According to Basic Education Coalition (2004) and USAID (2005) , each year of schooling “increases individual output by 4-7 percent, and countries that improve literacy rates by 20-30 percent have seen increases in Gross Domestic Product (GDP) of 8-16 percent.” Education builds the human capital that is needed for economic growth. In addition, it also produces significant improvements in health, nutrition, and life expectancy, and countries with an educated citizenry are more likely to be democratic and politically stable. In fact, Levine et al. (2003) points out that if primary school enrollment and completion rates are high, then education offered confers the skills and knowledge that are the source of the hoped-for greater earnings, better health, and more engaged citizenship.
3.2 Target population and Sample Size
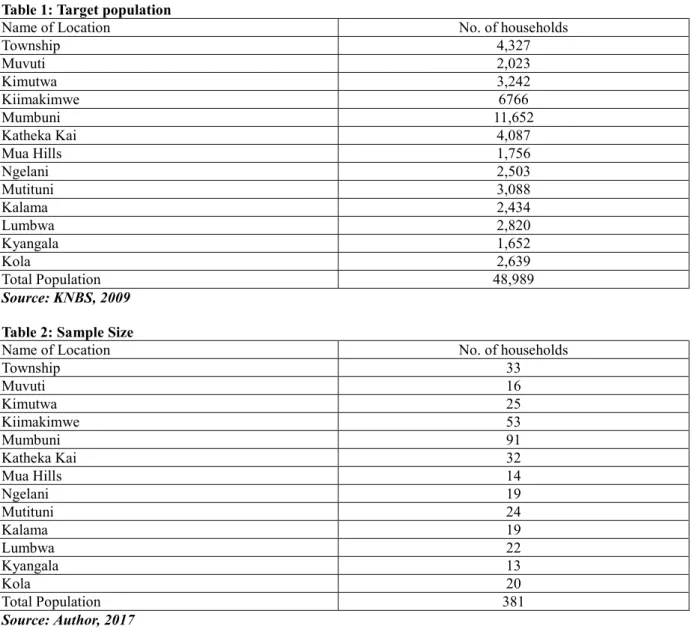
The study targeted the entire population of Machakos Town Constituency (MTC) which currently stands at 48,989 households distributed across 13 locations according to 2009 national census and is shown in Table 1. A combination of probabilistic and non-probabilistic sampling was applied in choosing the sample size. First the population was clustered into the administrative units implying that there are 13 clusters since MTC has 13 locations. Secondly, simple random sampling was then applied to select the household to be interviewed. From the target population a sample size of 381 households was obtained using the following formula:
(
+
−
1
)
∗
=
N
X
X
N
n
(
)
2 2 21
E
p
p
Z
X
=
α∗
∗
−
Where,Zα/2 is the critical value of the Normal distribution at α/2 (for a confidence level of 95%, α is 0.05 and the critical value is 1.96), E is the margin of error, p is the sample proportion, and N is the population size. It should be noted that a Finite Population Correction has been applied to the sample size formula. The study applies 95% confidence interval in selecting the sample implying that the E is 5%.
Table 1: Target population
Name of Location No. of households
Township 4,327 Muvuti 2,023 Kimutwa 3,242 Kiimakimwe 6766 Mumbuni 11,652 Katheka Kai 4,087 Mua Hills 1,756 Ngelani 2,503 Mutituni 3,088 Kalama 2,434 Lumbwa 2,820 Kyangala 1,652 Kola 2,639 Total Population 48,989 Source: KNBS, 2009
Table 2: Sample Size
Name of Location No. of households
Township 33 Muvuti 16 Kimutwa 25 Kiimakimwe 53 Mumbuni 91 Katheka Kai 32 Mua Hills 14 Ngelani 19 Mutituni 24 Kalama 19 Lumbwa 22 Kyangala 13 Kola 20 Total Population 381 Source: Author, 2017 3.3 Model specification
Given that the data from the field was qualitative, the data was coded into binary data implying that binary probabilistic models were fit for analysis. More specifically, the probit model was applied. The general representation of the model is specified as follows:
( )
1
.... ... ... ... ... ... ... ... k X k β ... ... ... 2 X 2 β 1 X 1 β 0 β Y = + + + + i iβ
ε
X
Y
=
+
Where: Y represents increase in household’s income levels; Xi represents the various cash transfer programmes and household characteristics;
β
0,β
1,...
...
β
k are estimable parameters andε
is the error term. From the general representation, of the specific probit model for the study is specified as follows:( )
2
...
...
...
i
ε
8
X
8
β
7
X
7
β
6
X
6
β
5
X
5
β
4
X
4
β
3
X
3
β
2
X
2
β
1
X
1
β
0
β
Y
=
+
+
+
+
+
+
+
+
+
+
WhereX1 is primary school enrolment X2 is secondary school enrolment X3 is primary school completion rate X4 is secondary school completion rate X5-8 are household characteristics
i
secondary education. This looked into the enrolment rate at both the primary and secondary school level at the household level. In addition the school completion rate at both the primary and secondary schools was captured. 3.4 Sources of data
The study utilized the primary data in its analysis. The data was collected using the self-administered structured household questionnaire. The tool was pretested in one of the locations within Machakos County but outside the study area to check on the reliability and the validity of the tool prior to the actual data collection task. 4.0 Empirical findings and discussion
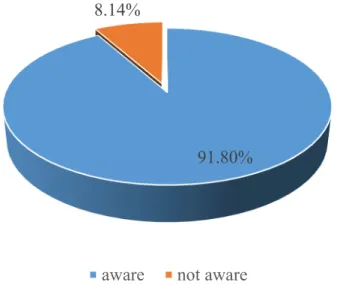
The data collection tool focused on four variables of basic education namely, primary school enrolment, second school enrolment, primary school completion rate and secondary school completion rate in Machakos County. Majority of the respondents were aware of the free primary and secondary education, representing 91.8%. This is depicted in Figure 1.
According to the respondents the main benefits from the free education are first, the reduced burden of school fees, second, opportunity to invest in other projects and third, opportunity to complete school. This information is described by Table 3.
Figure 1: Awareness of free education (primary and secondary) Table 3: Benefits from free education
Benefits n Percent
Completion of school 14 3.67
Increased school enrolment 8 2.10
Investing in other projects 45 11.81
Reduced school fees burden 251 65.88
None 63 16.54
Sample size (n) 381 100.00
In terms of enrolment in primary schools, 153 households did not have any boy child enrolled in primary while 178 households had only one boy enrolled representing 40.16 and 46.72% respectively, as shown in Table 4. In the case of girls’ enrolment in primary school 42.52% of households did not have a girl child in school while 44.36% of households had only one girl enrolled for school as shown in Table 5.
Table 4: Boys enrolled in primary school
Number of boys n Percent
0 153 40.16 1 178 46.72 2 40 10.50 3 4 1.05 4 6 1.57 Sample size (n) 381 100.00
91.80%
8.14%
Table 5: Girls enrolled in primary school
Number of girls n Percent
0 162 42.52 1 169 44.36 2 43 11.29 3 6 1.57 4 1 0.26 Sample size (n) 381 100.00
The transition from primary to secondary school for both boys and girls had a similar trend to the enrolment in primary school as indicated in Tables 6 and 7. For instance, households which did not enrol either a boy or girl child in secondary school had the highest frequency standing at 61.15 and 62.20% respectively followed by households that enrolled only one boy child or girl child.
Table 6: Boys enrolled in Secondary School
Number of boys n Percent
0 283 61.15 1 117 30.71 2 26 6.82 3 3 0.79 4 and above 2 0.52 Sample size (n) 381 100.00
Table 7: Girls enrolled in Secondary School
Number of girls n Percent
0 237 62.20
1 115 30.18
2 28 7.35
3 1 0.26
Sample size (n) 381 100.00
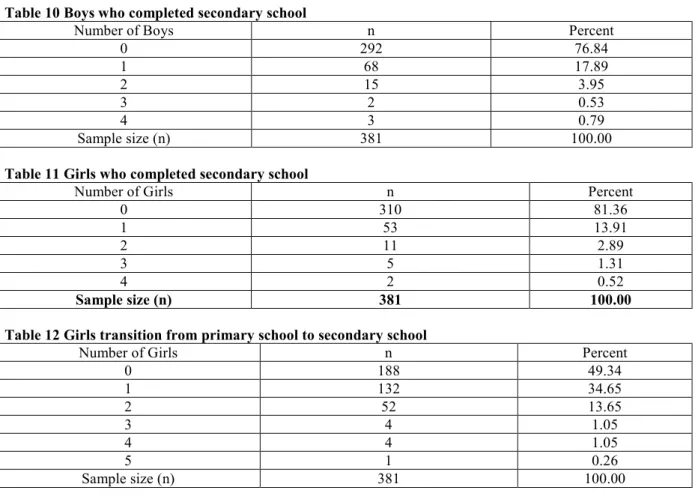
It was also observed that households recorded higher completion rates for girls than boys in primary school in the catchment area while in secondary school the completion rate was higher for boys than that of girls. This is shown by Tables 8, 9, 10 and 11. The transition rate of girl child from primary to secondary school was recorded as 50.66% as shown Table 12.
Table 8: Boys who completed primary school
Number of Boys n Percent
0 211 55.38 1 96 25.20 2 60 15.75 3 8 2.10 4 2 0.52 5 4 1.05 Sample size (n) 381 100.00
Table 9 Girls who completed primary school
Number of Girls n Percent
0 193 50.66 1 125 32.81 2 55 14.44 3 5 1.31 4 3 0.78 Sample size (n) 381 100.00
Table 10 Boys who completed secondary school
Number of Boys n Percent
0 292 76.84 1 68 17.89 2 15 3.95 3 2 0.53 4 3 0.79 Sample size (n) 381 100.00
Table 11 Girls who completed secondary school
Number of Girls n Percent
0 310 81.36 1 53 13.91 2 11 2.89 3 5 1.31 4 2 0.52 Sample size (n) 381 100.00
Table 12 Girls transition from primary school to secondary school
Number of Girls n Percent
0 188 49.34 1 132 34.65 2 52 13.65 3 4 1.05 4 4 1.05 5 1 0.26 Sample size (n) 381 100.00
4.1 Modelling the relationship between the Basic Education and the Quality of Life
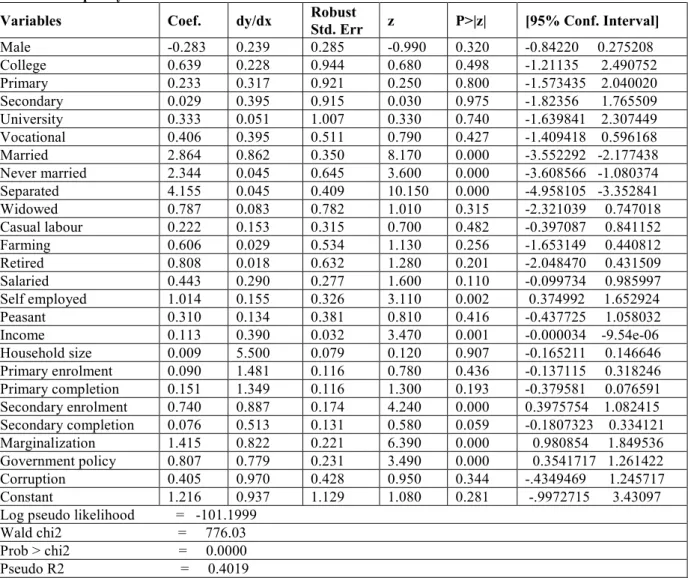
To achieve this specific objective, a probit model was run using the primary school enrolment, primary school completion, secondary school enrolment and secondary school completion as the measures of free primary and secondary education beneficiaries.
From the results in Table 13, it was observed that free primary and secondary education have increased school enrolment among the households in Machakos County. Looking at the primary school enrolment and primary school completion rate following the introduction of free primary education, it was noted that it is more likely to improve the quality of life. However the effect is insignificant as indicated by the probability values which are greater than 5 percent significance level. This observation is confirmed by other studies that primary school leavers have lower income jobs than secondary school graduates OECD (2012). This implies that the effect of free primary school is less than the effect of free secondary school in improving quality of life. This is supported by the observations from Table 13 that the secondary school enrolment and completion are both more likely to improve the quality of life among the households in Machakos County. Free secondary education as captured by secondary school enrolment and completion is more likely to improve the quality of life with the secondary school enrolment likely to improve life quality by 0.887 chances while secondary school completion being more likely to improve life quality among the households by 0.513 percent. Basic Education Coalition (2004) and USAID (2005) reveal the contribution of education in development and improvement of quality of life. Also Levine, et al (2003) underscores that high primary school enrolment and completion rates indicators as the attainment of greater earnings, better healthcare and more engagement in citizenship activities, implying improvement in the quality of life.
Table 13: Probit model regression for the effect of free primary and free secondary education on household’s quality of life.
Variables Coef. dy/dx Robust Std. Err z P>|z| [95% Conf. Interval]
Male -0.283 0.239 0.285 -0.990 0.320 -0.84220 0.275208 College 0.639 0.228 0.944 0.680 0.498 -1.21135 2.490752 Primary 0.233 0.317 0.921 0.250 0.800 -1.573435 2.040020 Secondary 0.029 0.395 0.915 0.030 0.975 -1.82356 1.765509 University 0.333 0.051 1.007 0.330 0.740 -1.639841 2.307449 Vocational 0.406 0.395 0.511 0.790 0.427 -1.409418 0.596168 Married 2.864 0.862 0.350 8.170 0.000 -3.552292 -2.177438 Never married 2.344 0.045 0.645 3.600 0.000 -3.608566 -1.080374 Separated 4.155 0.045 0.409 10.150 0.000 -4.958105 -3.352841 Widowed 0.787 0.083 0.782 1.010 0.315 -2.321039 0.747018 Casual labour 0.222 0.153 0.315 0.700 0.482 -0.397087 0.841152 Farming 0.606 0.029 0.534 1.130 0.256 -1.653149 0.440812 Retired 0.808 0.018 0.632 1.280 0.201 -2.048470 0.431509 Salaried 0.443 0.290 0.277 1.600 0.110 -0.099734 0.985997 Self employed 1.014 0.155 0.326 3.110 0.002 0.374992 1.652924 Peasant 0.310 0.134 0.381 0.810 0.416 -0.437725 1.058032 Income 0.113 0.390 0.032 3.470 0.001 -0.000034 -9.54e-06 Household size 0.009 5.500 0.079 0.120 0.907 -0.165211 0.146646 Primary enrolment 0.090 1.481 0.116 0.780 0.436 -0.137115 0.318246 Primary completion 0.151 1.349 0.116 1.300 0.193 -0.379581 0.076591 Secondary enrolment 0.740 0.887 0.174 4.240 0.000 0.3975754 1.082415 Secondary completion 0.076 0.513 0.131 0.580 0.059 -0.1807323 0.334121 Marginalization 1.415 0.822 0.221 6.390 0.000 0.980854 1.849536 Government policy 0.807 0.779 0.231 3.490 0.000 0.3541717 1.261422 Corruption 0.405 0.970 0.428 0.950 0.344 -.4349469 1.245717 Constant 1.216 0.937 1.129 1.080 0.281 -.9972715 3.43097 Log pseudo likelihood = -101.1999
Wald chi2 = 776.03 Prob > chi2 = 0.0000 Pseudo R2 = 0.4019
5.0 Conclusion and policy implications
From the results of the study, it can be observed that free primary and secondary education have increased school enrolment among the households in Machakos County. In terms of the primary school enrolment and primary school completion rate following the introduction of free primary education, it was observed that it is more likely to improve the quality of life. However the effect is insignificant as indicated by the probability values which are greater than 5 percent significance level. This observation was confirmed by other studies that have shown that primary school leavers have lower income jobs than secondary school graduates OECD (2012). This implies that the effect of free primary school is less than the effect of free secondary school in improving quality of life.
This finding is supported by the observations from regression results indicating that secondary school enrolment and completion rate are both more likely to improve the quality of life among the households in Machakos County. Free secondary education as captured by secondary school enrolment and completion rate is more likely to improve the quality of life with the secondary school enrolment likely to improve life quality by 0.887 chances while secondary school completion rate being more likely to improve life quality among the households by 0.513 percent. Basic Education Coalition (2004) and USAID (2005) reveal the contribution of education in development and improvement of quality of life. Also Levine, et al (2003) underscores that high primary school enrolment and completion rates indicate the attainment of greater earnings, better healthcare and more engaged citizenship implying improvement in the quality of life.
From these results it was observed that only the secondary school enrolment is significant at 5% level. Therefore the null hypothesis was rejected and the alternative hypothesis accepted under secondary school enrolment. This means that secondary school enrolment significantly influences poverty reduction among households in Machakos County. In terms of the primary school enrolment, primary school completion rate and secondary school completion rate it is concluded that all these factors are insignificant in influencing poverty
level. In this case the null hypothesis was accepted meaning the primary school enrolment; primary school and secondary school completion rates do not affect poverty reduction among households in Machakos County.
This conclusion is supported by studies such as Levine, et al (2003) who point out that if primary school enrolment and completion rates are high, then education offered confers the skills and knowledge that are the source of the hoped-for greater earnings, better health, and more engaged citizenship. This implies that the primary school enrolment and completion rate have not been high enough to influence the improvement of quality of life.
References
Belfield, C.R., & H.M. Levin. 2007. The price we pay: The economic and social costs of inadequate education. Washington, DC: Brookings Institution.
Economic Recovery Strategy for Wealth and Employment Creation (2003), Republic of Kenya. Poverty Reduction Strategy Paper (2001), Republic of Kenya.
Kenya National Bureau of Statistics (2006) Report Kenya National Bureau of Statistics (2010) Report
Levine, R., N. Birdsall, A. Ibrahim, and P. Dayal. (2003). Background paper of the Task Force on Education and Gender Equality: Achieving universal primary education by 2015: Washington, D.C: United Nations. Dickens W. T., Sawhill I., & Tebbs J. (2006). The effects of investing in early education on economic growth.
Policy Brief No. 153. Brookings Institutions. Washington, DC.
Denison, Edward F (1985) Trends in American Economic Growth, 1929-1982. Washington, DC: Brookings Institution.
Jorgenson, Dale W., Kevin J. Stiroh, Robert J. Gordon, and Daniel E. S. (2000). Raising the Speed Limit: U.S. Economic Growth in the Information Age. Brookings Papers on Economic Activity, no.1: 125–235.
OECD (2012), equity and Quality in Education Supporting Disadvantaged Students and schools, OECD Publishing.
Solow, R. M. (1957). Technical Change and the Aggregate Production Function. Review of Economics and Statistics, 39: 312-20.
Schultz, T. W. (1961). Investment in Human Capital. American Economic Review, 51, 1-17.
Tegemeo Institute of Agricultural Policy and Development, (2009). Rural Incomes, Inequality and Poverty Dynamics in Kenya, WPS 30/2008.