City, University of London Institutional Repository
Citation
:
Kharlamov, E., Skjaeveland, M., Hovland, D., Mailis, T., Jimenez-Ruiz, E.
ORCID: 0000-0002-9083-4599, Xiao, G., Soylu, A., Horrocks, I. and Waaler, A. (2018).
Finding Data Should be Easier than Finding Oil. In: 2018 IEEE International Conference on
Big Data (Big Data). . UNSPECIFIED. ISBN 978-1-5386-5035-6
This is the accepted version of the paper.
This version of the publication may differ from the final published
version.
Permanent repository link:
http://openaccess.city.ac.uk/id/eprint/22925/
Link to published version
:
Copyright and reuse:
City Research Online aims to make research
outputs of City, University of London available to a wider audience.
Copyright and Moral Rights remain with the author(s) and/or copyright
holders. URLs from City Research Online may be freely distributed and
linked to.
City Research Online:
http://openaccess.city.ac.uk/
[email protected]
Finding Data Should be Easier than Finding Oil
Evgeny Kharlamov
University of Oxford, UK University of Oslo, Norway
Martin Skjæveland
University of Oslo, Norway
Dag Hovland
University of Oslo, Norway
Theofilos Mailis
National Technical Uni. of Athens, Greece
Ernesto Jimenez-Ruiz
University of Oslo, Norway
Guohui Xiao
Free University of Bozen-Bolzano, Italy
Ahmet Soylu
Norwegian Uni. of Science and Technology; SINTEF Digital, Norway
Ian Horrocks
University of Oxford, UK
Arild Waaler
University of Oslo, Norway
Abstract—The competitiveness of modern enterprises heavily depends on their ability to make the right business decisions by relying on efficient and timely analysis of the right business critical data. In large and data intensive companies such as Equinor, a Norwegian multinational oil and gas company with more than 20,000 employees, gathering such data is not a trivial task due to the growing size and complexity of corporate information sources. As a result, the data gathering task is often the most time-consuming part of the decision making process, in particular when it comes to the work processes of Equinor’s exploration geologists that should find in a timely manner new exploitable accumulations of oil or gas in given areas by analysing data about these areas. In this work we present our experience in addressing this data challenge tast at Equinor. We have developed and deployed at Equinor a semantic data access system that relies on the Ontology Based Data Access (OBDA) approach. Our system is based on our solid theoretical contributions and has been extensively evaluated at Equinor.
I. INTRODUCTION
The competitiveness of modern enterprises heavily de-pends on their ability to make therightbusiness decisions by relying on efficient and timely analysis of therightbusiness critical data. Equinor ASA, is a Norwegian multinational oil and gas company headquartered in Stavanger, Norway. It is a fully integrated petroleum company with operations in thirty-six countries. One of the factors determining the competitiveness of Equinor is the ability of its exploration geologists to find in a timely manner new exploitable accu-mulations of oil or gas in given areas by analysing data about these areas. Gathering such data is not a trivial task due to the growing size and complexity of corporate information sources. As a result, the data gathering task is often the most time-consuming part of the decision making process.
Indeed, Equinor geologists often require data that is stored in multiple complex and large data sources that include EPDS, Recall, CoreDB, GeoChemDB, OpenWorks, Compass, and NPD FactPages (see Section II for more details). These DBs are mostly Equinor’s corporate data stores for exploration and production data and Equinor’s interpretations of this data. Some of these DBs has been created long time ago, can hardly be accessed by geologists without a help from IT personnel due to the complexity of their schemata, e.g., EPDS currently has about 3,000
tables with about 37,000 columns, and a common informa-tion need of a Equinor geologist corresponds to an SQL query with hundreds to thousands of terms and 50–200 joins. Moreover, the majority of EPDS table names are not meant to be read by end-users, e.g., EXTOBJIND_BKUP,
RCA_GRDENS, andSSRF_RCK_SEGare such table names, while the semantics of a very few others is more understand-able, e.g.,DOCUMENT,WELLBORE, andCORE. Construction of queries over such schemata is not possible for Equinor geologists and thus they have to pass their information needs to IT specialists who then turn the needs into SQL queries. This drastically affects the efficiency of finding the right data that should back decision making.
Ontology Based Data Access (OBDA) [1] is a prominent approach to data access in which anontology [2]1 is used to mediate between data consumers and data sources (see a general diagram of OBDA in Figure 1). The ontology provides ‘a single point of semantic data access’ for data consumers, and allows either to export data in a semantic format or to pose queries over the integrated data sources in terms of a user-oriented conceptual model that abstracts away complex implementation-level details typically en-countered in database schemata. Domain experts are thus able to express information needs in their own terms without any prior knowledge about the way the data is organised at the source, and to receive answers in the same intelligible form. The ontology is connected to the data via a set of
mappings: declarative specifications that relate ontological terms with queries over the underlying data. OBDA systems automatically translate ontological queries, i.e., expressed in the SPARQL query language2, into database queries, i.e.,
expressed in SQL, and delegate execution of SQL queries to the database systems hosting the data. OBDA is a natural fit to address the Equinor data access challenges described
1An ontology us a semantically rich conceptual model of the problem
domain that captures the domain in terms of classes and binary properties that relate entities that populate classes and assign data values to these entities. In the last decade a number of standardised machine processable ontology languages have been developed, where the most popular are W3C standardised RDF (w3.org/RDF/), OWL 2 (w3.org/TR/owl2-overview/). Ontologies have been successfully used in many applications, including Web search [3], Medicine [4], E-commerce [5], Media [6], etc.
Table Name Attribute Attribute Attribute Attribute Attribute Attribute Attribute Attribute Attribute Attribute Attribute Attribute Table Name Attribute Attribute Attribute Attribute Attribute Attribute Attribute Attribute Table Name Attribute Attribute Attribute Attribute Domain Ontology Metadata, Database Schemata Mappings Semantic Data Access Data Sources Attribute Attribute Attribute Attribute Table Name Table Name Attribute Attribute Attribute Attribute Attribute Attribute Attribute Attribute Attribute Attribute Attribute Attribute Table Name Attribute Attribute Attribute Attribute Table Name Attribute Attribute Attribute Attribute Table Name Table Name Attribute Attribute Attribute Attribute Attribute Attribute Attribute Attribute Attribute Attribute Attribute Attribute Table Name Attribute Attribute Attribute Attribute Attribute Attribute Attribute Attribute Table Name Attribute Attribute Attribute Attribute Attribute Attribute Attribute Attribute Table Name RDF Data Export Applications Users Data Consumers
Figure 1. General scheme of the OBDA approach.
above: if complex database schemata are presented to users via an ontology, then they can formulate queries in terms of classes and properties in an object-centric fashion, e.g., asking for allwellbores penetratingarock layerof a specific
geological age. Moreover, OBDA is a so-called virtual
approach, providing an access layer on top of databases while leaving the data in its original stores. Thus, OBDA has the potential to improve data access with a minimal change to existing data management infrastructure.
OBDA has recently attracted a lot of attention and a number of systems have been developed, e.g., [7], [8], [9], [10], [11]. However, to the best of our knowledge, the following three critical problems have attracted only limited attention and in isolation:
(i) How to createontologies and mappings for a deploy-ment of an OBDA system in a company?
(ii) How to ensure that OBDA query processing isefficient
in practice, that is, comparable to the user’s expecta-tions or comparable to the query processing time over company’s database backends?
(iii) How to ensure that the target users are actually able to efficiently express their information needs against an OBDA system?
These problems have high practical importance for OBDA systems in general and in particular for effective and effi-cient deployment and use of an OBDA system in Equinor. Indeed, deployment of an OBDA system comes with a high modelling cost due to the complexity of the domain and of the database schemata. Moreover, unoptimised OBDA query processing may become impractical when the on-tology and/or database are large [12]. Finally, expressing information needs over an OBDA system as a query written in a query language, e.g., SPARQL, is error prone and requires substantial training which significantly limits the usability of an ODBA system in a company.
In this paper we report our experience from a large scale 4-years long project with Equinor where we addressed the aforementioned OBDA limitations, developed our own OBDA platform, deployed and evaluated it at Equinor.
In particular, we developed (i)novel semi-automatic tech-niques to bootstrap (extract) new ontologies and mappings from relational databases and to integrate existing ones, and (ii) novel optimisation techniques to improve query processing by producing compact and efficient SQL queries, and then by carefully planning their query execution strategy over one or several federated DBs. (iii) a novel OBDA oriented visual query formulation interface. We then imple-mented these techniques and developed an OBDA deploy-ment, query optimisation, and query formulation systems which were integrated in an end-to-end Euqinor semantic access platform.
We deployed and evaluated our platform at Equinor in order to improve the data gathering routine of Equinor’s geologists. The deployment was done over seven prominent, complex, and large data sources: EPDS, Recall, CoreDB, GeoChemDB, OpenWorks, Compass, and NPD FactPages. These DBs are mostly Equinor’s corporate data stores for ex-ploration and production data and Equinor’s interpretations of this data, and they are heavily used by Equinor geologists. We then evaluated our platform over the aforementioned seven DBs using three metrics:
• qualityof the system’s deployment,
• efficiency of the system’s query processing, and
• effectiveness and efficiency of the system’s query for-mulation support.
In order to objectify the measure of success and facilitate all three metrics, we gathered a catalogue of queries collected from Equinor geologists. These queries cover a wide range of typical information needs, and they are hard to formulate over Equinor databases.
In order to show the quality of our semi-automatic deploy-ment, we showed that the system enables formulation of the queries in the catalog, i.e., it provides enough ontological terms to do so, it covers a wide range of commonly used ontological terms from the geological domain, and the ontology and mappings in combination reflect expectations of geologists, that is, the answers to queries from the catalog correspond to expectations of geologists.
In order to show the efficiency of our platform’s query processing, we conducted a number of experiments. Most of our experiments showed that our platform can handle queries from the Equinor’s catalog reasonably well, that is, in time comparable to the time reported by existing Equinor’s systems.
In order to show the effectiveness of our platform’s query formulation support we showed that the semantic queries that geologists have to formulate are much simpler than the data queries over the Equinor databases behind our OBDA deployment. We also conducted a series of user studies to show that the Equinor’s catalog queries can be formulated by Equinor’s target personnel in a reasonably short time.
platform with ArcGIS3 and Petrel4 in order to show query results computed by the platform on geological maps.
The paper is organised as follows: in Sec. II we explain why findding data at Equinor is hard; in Sec. III we present our system for semantic data access; in Sec. IV we explain how we prepared our system for deployment at Equinor by developing ontologies and mappings; in Sec. V we present how we deployed and evaluated our system at Equinor. This paper reports our experience in the Optique project [13], [14], [15], [16], [17], [18], [19], [20], [21], [22].
II. FINDINGDATA IS ASHARD ASFINDINGOIL
The main task of exploration geologists in oil companies like Equinor, is to find exploitable deposits of oil or gas in given areas and to analyse existing deposits. This is typically done by investigating how parts of the earth crust are composed in the area of interest. By combining infor-mation from wellbores, seismic investigations, and general geological knowledge, geologists can, for example, assess what types of rock are in the reservoir and intersected along the wellbore. The geologist does this typically in two steps:
(i)find relevant wellbore, seismic, and other data in Equinor DBs,(ii)analyse these data with specialised analytical tools. Equinor has a number of databases of different formats and sizes that have different content and provided by differ-ent vendors and that geologists have access to and need to analyse: (i) Exploration and Production Data Store (EPDS)
is the Equinor’s central repository of geological data of the type described above, i.e., for exploration, production data, and its interpretations. EPDS is stored in an Oracle database. It was created about 15 years ago and it currently has about 3,000 tables and views that have about 37,000 columns all together; (ii) Core DB contains information about samples taken from the wellbore, and measurements done on them
(iii) Openworks is a project database that contains work in progress. (iv) Recall contains wellbore logs, that is, measurements made down along the wellbore, both during drilling, and on later occasions; (v) GeoChem contains, mostly spectrometry, measurements from the wellbore in the field of geochemstry; (vi) Compass has geometric and geographic information about wellbores; (vii) Norwegian Petroleum Directorate FactPages (NPD FP) is an external data source governed by the NPD, which reports to the Norwegian Ministry of Petroleum and Energy.
Equinor geologists typically access data via a variety of query interfaces and data extraction tools, such as geograph-ical information system (GIS) tools and specialised data manipulation tools, that we shall collectively refer to as
access points. The flexibility of the access points is limited and in general users can control them only by inserting values for certain query parameters. When information needs cannot be satisfied with any of the available access points, geologists, possibly with the help of IT staff, try to combine
3https://www.arcgis.com/
[image:4.612.317.568.56.197.2]4https://www.software.slb.com/products/petrel
Figure 2. Each box in this FME diagram describes a data manipulation
task. The contents of the boxes are blurred for privacy reasons.
answers obtained from several access points. In some cases, geologists have to contact IT staff to provide a new access point. Since access points are typically based on materialised special purpose database views, to make a new view or to modify an existing one, IT staff typically use external tools, such as Feature Manipulation Engine (FME).5 The
process of making such view consists of the three ETL steps (extracting, transforming, and loading data) Building such ETL processes that establishes an access point for a complex information need consists of a myriad of data access and processing steps, many of which require deep knowledge of the data that is being processed and how it is represented. Figure 2 shows an excerpt of an FME process that establishes an access point for gathering the information for the information need about overlapping core samples that we took from Equinor and anonymised.
It is common that Equinor geologist have to involve IT staff for data access especially when geologists need to ‘explore’ the data, e.g., in the case when the concrete information need is not clear and depends on the available data or when a new access point has to be created. Thus, IT staff become the de facto mediators between geologists and databases and this is the case not only for Equinor but for large and data intensive companies in general [23]. In practice, it is often the case that the availability of IT personnel that both understand the information need of the geologist and the inner workings of the data sources and tools necessary to answer the information need is scarce, and such people are often overloaded. Moreover, development of a new access points is a very time consuming process and may take up to several weeks; e.g., in Equinor it commonly takes up to several days to produce an access point that completely answers the required information need. The concrete time of course depends on the complexity of the query task and the degree of the involvement of the IT staff. As the result, the IT staff involvement became the (time) bottleneck of the data access.
There are around 900 geologists and geophysicists in Equinor and accessing data is their routine. Currently, if the access is done via existing access points, then the data can
be extracted relatively fast, while the average turnaround for new access points is about four days. Reducing this time from several days to several hours would potentially bring a significant saving by improving the effectiveness of Equinor’s exploration department, which is key to their overall competitiveness and profitability.
III. SEMANTICDATAACCESS FOREQUINOR
One way to reduce the data access time is to provide Equinor geologists with a way to express their information needs to the system directly, without an intervention of the IT staff. We now describe the Ontology Based Data Access (OBDA) approach that aims such directsemanticaccess.
The main idea behind OBDA [1] is to provide the user with access to the data store via the use of a domain specific vocabulary of classes, i.e., unary predicates, and properties, i.e., binary predicates, that the user is familiar with. This vocabulary is related to the database schema via view defini-tions, calledmappings; thus, technical details of the database schema are hidden from end-users. The user formulates queries in terms of the classes and properties in an object-centric fashion. Queries over the domain vocabulary are then unfolded into queries over the database schemas and exe-cuted over the data by DBMS. An important feature of the OBDA approach is that the domain vocabulary is enhanced with a set of formal axioms that constitute an ontology, In contrast to database constraints, ontological axioms can be exploited to enrich query answers with implicit information. Enrichment of answers is done via logical reasoning: a user queryQover the domain vocabulary can be rewritten into a new query over this vocabulary that is logically equivalent to Q w.r.t. the ontology and ‘absorbs’ a fragment of the ontology relevant for answeringQ.
In our project we decided to apply OBDA in Equinor but this required from us to address the following challenges: C1. The first challenge is to obtain the required components
to install an OBDA system, i.e., ontologies and map-pings. To overcome this we developed a bootstrapper that is able to extract ontologies and direct mappings from relational schemata.
C2. The second challenge is to guarantee that our OBDA system is able to process semantic queries over massive amounts of data, as in Equinor. Since query processing in OBDA requires rewriting, unfolding, and query ex-ecution with an RDBMS, this is not a trivial task. C3. The third challenge comes with the assumption that
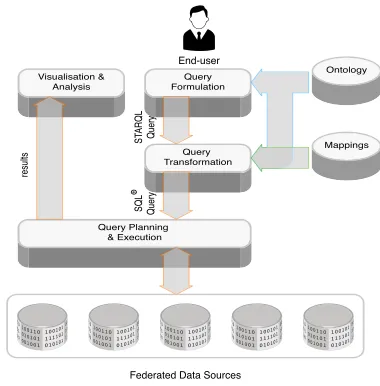
the users can formulate queries over the ontological vocabulary. SPARQL is the standard query language over ontologies; however, it is not end-user oriented. Thus we need to develop a query language tailored for users that are not familiar with formal query languages. In order to address these Equinor challenges we developed a semantic data access platform and its high level architec-ture is in Figure 3. The platform has two user roles: the end-user, in our case typically a geoscientist that wants some specific access to data, and the IT-expert, whose job it is
End-user
[image:5.612.340.530.58.251.2]Federated Data Sources
Figure 3. Architecture of our Semantic Platform.
in part to provide such end-users with access to data. The platform consists of various components that are integrated in a common framework. Ontologies, mappings, queries and other specifications, like SPARQL repository settings, are stored in a central repository that all components can access. In the following we describe the different modules of the Semantic Equinor platform along with the challenges they address in parenthesis:
A. Deployment Support
Our platform equips the IT-expert with interfaces to setup and maintain the platform and its artefacts, in particular our deployment module can construct ontologies and map-pings over the data sources using the data schemas as input [24]. We now give a short overview of what our deployment support can do. To this end, recall that an OBDA specification [1] is defined as a 4-tuple composed by an ontology vocabulary V, a set of axioms, i.e., an ontologyO, a set of mappingsMand a database schemaS. An OBDA instance is an OBDA specification where the database schema S is replaced by D, a database instance for S, that satisfiesO andM[1]. The deployment module supports the following tasks for bootstrapping ontologies and mappings from RDBs in order to create an OBDA instance.
(i) Bootstrapping: Given a relational database D, generate an instance(D,V,O,M). This task can be naturally divided into two sub-tasks. Vocabulary and Ontology generation: Given D, create a vocabulary V and an ontology O over
V. Mapping generation: Given D, V, and O create a set of mappings M relating D with V. (ii) Importing: Given an instance (D,V,O1,M) and an ontology O2, return an
instance (D,V,O,M), where O is the alignment of O1
and O2. The bootstrapping is based on information from
the database schema and statistics on database instances and addresses Challenge C1 above.
B. Query Transformation, Planning, and Execution
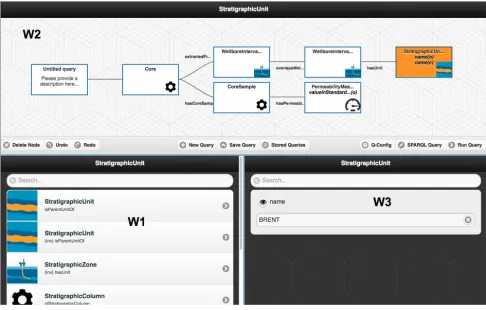
Figure 4. Our visual query formulation tool.
transformation and planning module, and then executed by our execution component. They addresses Challenge C2 above and we refer the reader to [14] for technical details that are out of the scope of this paper.
The query tranformation module considers the informa-tion in the ontology, mappings, data source schemas, and additional optimisation settings, to transform the SPARQL query into an optimised federated SQL query over all the sources connected to the platform. The module performs several optimisations that address the following: (i) redun-dancy in SPARQL queries where SPARQL fragments may be subsumed by other SPARQL fragments within the same query;(ii)inefficiency of rewriting that is in the worst case exponential in the ontology size. Additional optimisations are performed on the unfolding of SPARQL queries to SQL queries that address: (i) redundant unions caused by redundancies in the bootstrapped ontology and mappings;
(ii) redundant joins originating from the fact that database
n-ary relations are mapped to RDF ternary relations. The SQL query created in the previous step is passed on to our query planning and execution module that deconstructs the SQL query and orchestrates the evaluation of the query parts to the correct underlying data sources. The data sources evaluate the query parts as any other SQL query and return the results back to query execution module, which assembles the query answering results of the sources to form the final result of the end-user query. In order to perform cost estimation of different query plans, data statistics are obtained for all external tables that are referenced in the mappings. A transformation-based optimiser has been devel-oped, that takes into consideration common subexpressions coming from different parts of a query in order to find an efficient execution plan. The option to push specific operators, like joins, to external databases is considered as a post-optimization step. After the final execution plan has been chosen, data transfer operators import external data. An intermediate result caching mechanism has also been implemented, so that a different eviction policy can be specified per data source. Existence of temporary results in this mechanism is taken into consideration during optimiza-tion and can lead to important improvements by avoiding execution the the external sources.
C. Query Formulation
The end-user interacts primarily with our visual query formulation tool that addresses the above Challenge C3 and that allows to formulate SPARQL queries over the ontological vocabulary without any prior knowledge of SPARQL: by iteratively combining visual components and setting filters [19], [15]. Such queries are then sent to the query transformation module described above. The client side interface of our query formulation tool is driven by information in the ontology, and this information is fed to the client by a server side part that can also exploit ranking using query logs to improve the user’s efficiency and user experience. Our visual query formulation tool is composed of communicating widgets that offer flexibility, modularity, and adaptability, see Figure 4 for an example Equinor query formulated in our tool. In Equinor’s case five widgets are adopted for: (i) navigating through the concepts and roles of an ontology (widget W1 in Figure 4);
(ii)visual representing the query as a directed graph (widget W2);(iii)performing selection and projection operations on attributes of a concepts (widget W3);(iv)presenting sample results;(v)constraining attributes by value selection from a wellbore map.
IV. ONTOLOGIES ANDMAPPINGS FOREQUINOR
The use of our OBDA platform at Equinor required the development of appropriate ontologies and mappings. We now present Equinor requirements for ontologies and mappings and then explain how we developed them.
A. Practical Requirements to Ontologies and Mappings
Clearly, the main requirement is that our OBDA solution should enable efficient formulation of information needs from Equinor geologists. In order to achieve this, we con-ducted interviews with Equinor geologists and IT experts who support them by creating access points. This gave us a few hundreds of information needs expressed in English, that look as follows:
1) In my area of interest, e.g., the Gullfaks field, return wellbores penetrating a specific chronostratigraphic unit, and information about the lithostratigraphy and the hydrocarbon content in the wellbore interval pene-trating this unit.
2) Show all core samples overlapping with Brent Group. 3) Show all permeability measurements in Brent.
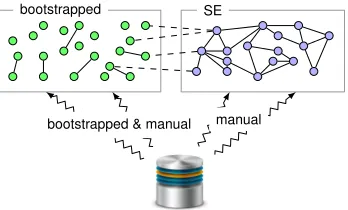
bootstrapped
bootstrapped & manual SE
[image:7.612.90.264.60.165.2]manual
Figure 5. How we create an OBDA instance over a given database.
as we verified with domain experts, the Equinor query cat-alogue provides a good coverage of topics that are typically of interest for Equinor geologists. From this we derived the first natural minimum requirement for the ontology and mappings:
Requirement 1:The ontology should enable for-mulation of queries from the Equinor query cata-log and mappings should enable answering these queries.
To fulfil Requirement 1, the ontology must contain all the terms occurring in the catalogue. For example, the example information need 1 presented above contains the terms well-bores, penetrating, chronostratigraphic unit, lithostratigra-phy,hydrocarbon content, and wellbore interval. All in all the catalogue contains more than 150 relevant domain terms. As we verified with Equinor geologists, the terms occurring in the catalogue are important, but, as expected, do not provide a sufficient domain coverage; that is, geologists need many more domain specific terms for expressing their information needs. Via interviews with geologists, we deter-mined six domains that should be reflected in the ontology: geospatial, geometrical, enterprise, production, seismic and oil related facilities, which gave the following requirement:
Requirement 2: The ontology should cover a wide range of geological domain terms including the ones from the catalogue and the six relevant domains.
A desired requirement of the ontology and mappings is, not only to cover the necessary vocabulary to enable the formulation of queries, but also to enable the correct answering of these queries.
Requirement 3: The ontology and mappings should lead to the expected query results in the OBDA solution.
B. Development of Ontologies and Mappings
In order to meet the aforementioned requirements, the ontology developed for Equinor consists of two parts. The fist part was bootstrapped from the Equinor databases us-ing our bootstrappus-ing module. For example, runnus-ing the bootstrapper over the EPDS database extracted an ontology comprising 3,329 classes, 68,737 properties, and 139,037 axioms from explicit and implicit constraints. See Table I for the complete list of ontology metrics. The second part of the ontology was manually developed by us together wit the
Equinor engineers. It is called the Subsurface Exploration (SE) ontology and it covers parts of the petroleum subsurface exploration domain with a special focus on the information needs (i.e. query catalog) to meet Requirement 1. This includes concepts and relations for describing, e.g., fields, wells, wellbores, and subsurface conditions and environ-ments. The SE ontology contains 106 classes, 49 object properties, 42 datatype properties, and 520 logical axioms.
Figure 5 shows an overview of the resulting OBDA instance for each of the Equinor databases together with the (imported) SE ontology. Next we provide more details about the creation of the OBDA instance.
The bootstrapped part helps us to meet both Require-ment 1 and RequireRequire-ment 2 in order to include a broader set of terms which may be relevant for future information needs covering the six indentified domains. The bootstrapped ontologies and the SE ontology were aligned using the tech-niques described in Section III (see column Align in Table I). Special care was taken to avoid introducing unwanted con-sequences: for instance the alignment techniques will avoid adding alignment axioms that would lead to inconsistencies, or faulty consequences like W ellvW ellBorethat are not supported by the input ontologies [25] and would prevent meeting Requirement 3.
Most of the axioms in the ontologies, including all boot-strapped axioms, fall in the OWL 2 QL profile, which is required for OBDA to guarantee correctness in the query rewritting (see Table I). Examples of OWL 2 QL axioms
are NaturalGasLiquidvPetroleum(natural gas liquids are
a sort of petroleum),Wellborev ∃hasLicense(each wellbore has a license associated to it), andCompanyv ∃hasName
(each company has a name). The SE ontology contains a few non-OWL 2 QL axioms, which we approximated in OWL 2 QL using the techniques of [26].
In order to fulfil Requirement 3, the SE ontology was manually linked via R2RML mappings to the data sources: EPDS, OpenWorks, Recall, CoreDB and GeoChemDB and a total of 75 mappings were created. The bootstrapped mappings were also complemented with manually create complex mappings since there were cases where the boot-strapped mappings did not sufficiently reflect their relation to the correspondent database in order to meet the information needs. See Table II for metrics about the manually created and bootstrapped mappings.
The column Federated contains mappings where the source SQL query touches more than one database. These mappings are only usable in a federated OBDA setting. All the other mapping rules have SQL queries that each selects data only from a single database.
Table I
ONTOLOGY METRICS FOR THESUBSURFACEEXPLORATION(SE)ONTOLOGY,AND FOR ALL BOOTSTRAPPED(BOOT)ONTOLOGIES,WHICH ARE ALSO ALIGNED(ALIGN)WITH THESEONTOLOGY. THE METRICS ARE CALCULATED BY THEOWLAPI JAVAAPI. ZERO-AND FALSE-VALUES ARE
REMOVED FROM THE TABLE TO INCREASE READABILITY.
SE EPDS Recall GeoChemDB CoreDB OpenWorks Boot Align Boot Align Boot Align Boot Align Boot Align
Overview
Axioms 759 433 624 434 545 15 358 16 263 73 024 73 929 1 140 2 046 212 609 213 519 Logical axioms 520 139 037 139 576 4 895 5 419 22 280 22 804 363 888 63 666 64 195 Classes 106 3 329 3 435 35 141 136 242 16 122 1 472 1 578 Object properties 49 5 560 5 609 17 66 15 64 21 70 3 734 3 783 Data properties 42 63 177 63 219 1 853 1 895 9 329 9 371 117 159 34 581 34 623
Individuals 6 1 8 1 7 1 7 1 7 1 7
Imports 1 1 1 1 1 1 1 1 1 1 1
Profiles
OWL2 X X X X X X X X X X X
OWL2 QL X X X X X
OWL2 EL X X X
OWL2 RL
Class Axioms
SubClassOf 150 12 034 12 187 122 275 442 595 46 199 4 988 5 141
Equivalent 16 1 1 2 6
Disjoint 188 188 188 188 188 188
GCI count
Hidden GCI Count 24 1 2 3 11
Max. superclasses 2 2 2 2 2 2
Avg. superclasses 1.019 1.0 1.001 1.0 1.014 1.0 1.008 1.0 1.016 1.0 1.001
Multiple inheritance 21 21 21 21 21 21
Object Property Axioms
SubPropertyOf 20 5 001 5 021 10 30 2 22 9 29 1 647 1 667 Equivalent
Inverse 12 12
Disjoint
Functional 9 9 9 9 9 9
InverseFunctional Transitive
Symmetric 1 1 1 1 1 1
Asymmetric Reflexive Irrefexive
Domain 37 3 506 3 543 14 51 14 51 17 54 1 916 1 953 Range 38 3 256 3 294 17 55 15 53 21 59 2 124 2 162 SubPropertyChainOf
Data Property Axioms
SubPropertyOf 12 32 041 32 053 1 421 1 433 5 878 5 890 53 65 14 262 14 274 Equivalent
Disjoint
Functional 15 15 15 15 15 15
Domain 24 40 376 40 400 1 458 1 482 6 600 6 624 100 124 18 143 18 167 Range 20 42 823 42 843 1 853 1 873 9 329 9 349 117 137 20 574 20 594
Annotation Property Axioms
Annotations 39 222 510 222 687 8 547 8 724 41 253 41 430 612 789 109 145 109 322 Domain
RangeOf
Individual Assertions
Class 6 6 6 6 6 6
ObjectProperty DataProperty NegativeObjectProperty NegativeDataProperty SameIndividual DifferentIndividuals
more than one database. This implies that each single SQL query also should only be towards a single database. Future work is to explore the implementation of SWRL rules to replace these federated mappings.
Together with Equinor geologists we manually evaluated sample classes and properties form the constructed ontolo-gies. As the result 44% of the classes in the query catalog have a good (lexical) match (greater or equal 0.8) with terms of the bootstrapped ontology; furthermore, 29% of the
classes are fully (lexically and structurally) covered (i.e., true positives), while 19% of the matches are semi-true positives.
V. DEPLOYMENT ANDEVALUATION ATEQUINOR
Table II
MAPPING METRICS. EACH COLUMN REPORTS NUMBERS FOR ONE MAPPING COLLECTION,WHICH EACH TARGET ONE DATA SOURCE. UNLESS LABELEDBoot.(BOOTSTRAPPED),THE MAPPING COLLECTION IS MANUALLY CONSTRUCTED.
Datasource: SE EPDS Recall CoreDB GeoChemDB Open Works Federated Boot. Boot. Boot. Boot
Mappings
rr:TriplesMap 75 3111 5 34 17 15 11 135 10 1303 1
rr:sqlQuery 75 0 4 0 15 0 11 0 9 0 1
rr:tableName 0 3111 0 34 0 15 0 135 0 1291 0
rr:TermMap 189 0 14 0 39 0 18 0 25 0 2
rr:PredicateMap 0 0 0 0 0 0 0 0 0 0 0
rr:ObjectMap 114 43882 9 1472 22 117 7 6614 15 20071 1
rr:GraphMap 0 0 0 0 0 0 0 0 0 0 0
rr:PredicateObjectMap 114 43882 9 1472 22 117 7 6614 15 20071 1 rr:RefObjectMap 0 137 0 0 0 0 0 0 0 181 0
rr:Join 0 0 0 0 0 0 0 0 0 0 0
rr:subject 0 0 0 0 0 0 0 0 0 0 0
rr:predicate 48 43882 7 1472 12 117 7 6614 12 20059 1
rr:object 0 0 0 0 0 0 0 0 0 0 0
rr:class 26 3111 0 34 7 15 5 135 6 1279 0
Database
Sum tables 150 3111 4 34 29 15 39 135 15 1291 3 Sum distinct tables 44 3111 1 34 7 15 9 135 7 1291 3 Min. joins per triplemap 0 0 0 0 0 0 0 0 0 0 2 Max. joins per triplemap 6 0 0 0 4 0 3 0 3 0 2 Avg. joins per triplemap 1.0 0.0 0.0 0.0 0.933 0.0 2.545 0.0 0.667 0.0 2.0
Ontology
Sum distinct ontology terms 74 46993 7 1506 19 132 12 6749 18 21338 1
Figure 6. Our Semantic Platform at Equinor
A. Integration in Equinor’s Infrastructure
Equinor has made available ten servers exclusive to our project. Our servers communicate with Equinor databases using the ordinary Java Database Connectivity (JDBC) inter-face. Equinor users interact with the platform via hypertext transfer protocol (HTTP/HTTPS) and may be authenticated through an lightweight directory access protocol (LDAP) service. An overview of the system architecture of these servers can be seen in Figure 6.
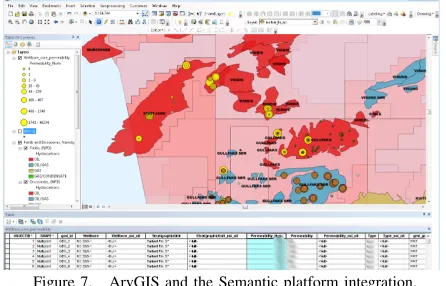
Moreover, our platform is integrated with GIS client tools at Equinor using the Linked Open Data for Web Feature Services Adapter (LOD4WFS)6[27]. The adapter is used to
translate the result of SPARQL SELECT queries into Web Feature Services (WFS) that may be directly read by GIS tools. The adapter installed at Equinor is set up to synchro-nise with the queries in the collection of queries registered in our OBDA platform that contain geographical data. Equinor users may hence use our visual query formulation tool to formulate queries that output geographical data, save the
6https://github.com/jimjonesbr/lod4wfs
[image:9.612.82.331.86.468.2]query to this collection, and then immediately execute the query from the GIS client tool where the results of the query will be displayed. Figure 7 shows a screenshot that illustrates how results of querying from a GIS client tool look like. The list of available queries/WFS layers that may be fetched from our OBDA platform are also available directly from the GIS tool. This usage pattern shows how our platform platform can be used to efficiently share queries across the enterprise. Figure 8 shows a screenshot of how our semantic platform is integrated with the Petrel system.
B. Evaluation of Visual Query Formulation
Since the goal of our OBDA deployment is to make gathering of data from EPDS more efficient; this leads us to the next requirement:
Requirement 4: Queries from the Equinor cat-alogue should be expressible in our visual query system. Moreover, these queries expressed over the ontology should be much simpler than the data queries in the corresponding access points.
Figure 7. ArvGIS and the Semantic platform integration.
various widgets including a map widget. Currently, 67% of the queries in the query catalogue are supported, that is, tree-shaped conjunctive queries and queries with aggregation (i.e., excluding queries with negation).
Expressing Equinor catalog queries over the ontology requires from 3 to 13 ontological terms, and the longest query contains 23 terms. These queries are quite simple and contain 8 and 13 terms only. At the same time, the Equinor access points corresponding to such queries are based on complex SQL queries that involve not less than dozen of tables, not less than 25 statements in the WHERE clause with not less than 11 technical statements of the form ‘T.A is not null’ that ensure correctness of query execution, and not less than 10 joins. This provides clear evidence that the catalogue queries over the ontology are much simpler than the corresponding access point queries. Moreover, expressing catalogue queries over the ontology is relatively easy and could be done quite quickly by Equinor geologists—during user studies they did it in one day.
C. Evaluation of Query Processing
The final requirement is about the system’s efficiency: Requirement 5: Execution time of queries from the Equinor catalogue over our OBDA deployment should be similar to the data extraction time of the corresponding access points even in the case of data federation scenario.
We conducted extensive experiments to evaluate the exe-cution time of our system in several scenarios over Equinor databases. We now give only a summary of the performance evaluation results, see details in [14]. Our first set of exper-iments aimed at showing how our query optimisations lead to significant reduction of query processing time over one DB. To this end we focused on the most complex Equinor DB available for our experiments, EPDS, and showed how our optimisations affect query execution time for queries from the Equinor catalog. Since EPDS is not a public DB, we conducted the same experiments over NPD FactPages, a public Equinor DB. Since NPD FactPages is small, about 105 MB, we developed and applied a procedure to scale this data in such a way that the resulting DB respects the important structural characteristics of the original DB. Finally, we conducted experiments over federated databases in order to show practical benefits of our distributed query planning component. In Table III we give statistics about
Figure 8. Petrel and the Semantic platform integration.
executing queries from the Equinor catalog over EPDS. In short, our OBDA solution at Equinor currently covers most information needs with average execution times of about two minutes for the federation setup, and under one minute for the EPDS setup. This is a huge improvement in comparison to the time needed in order to setup a new access point for Equinor geologists, but it is also comparable to the time needed for end users to get information from existing access points, with parameterized queries for example. As effort to cover all the remaining information needs is ongoing, we believe that execution times for the rest will not be much different from the existing ones.
VI. CONCLUSION ANDDIRECTIONS
In this paper we presented our practical experience with addressing the challenge of finding the right data when it comes to big data of a large and data intensive company Equinor. We developed and deployed a systems that enables Equinor geologists to find the right data and eventually oil faster than with the conventional ETL-based data access points that they currently use at Equinor. Our approach is semantic in the sense that it is based on the ontology-based data access paradigm.
[image:10.612.63.286.48.191.2]Table III
STATISTICS FROM EXECUTING THE QUERY CATALOGUE OVEREPDS
Mean Median Max Min
SPARQL query size (num chars) 462 456 1110 89 SQL query size (num chars) 4283 2547 37788 0 Unfolding time, ms (with timeouts) 23 15 145 0 DB exec time, s (with timeouts) 89 1.3 3600 0 Total time, s (with timeouts) 147 4.2 3600 0.1 Unfolding time, ms (w/o timeouts) 20 13 131 0 DB exec time, s (w/o timeouts) 36 0.8 508 0 Total time, s (w/o timeouts) 58 2.9 1238 0.1
Acknowledgements: This work is partially funded by the EU projects Optique (FP7-ICT-318338) and TheyBuy-ForYou (H2020-780247), by the EPSRC projects MaSI3, DBOnto, ED3, and by the SIRIUS Centre, Norwegian
Re-search Council project number 237898.
REFERENCES
[1] A. Poggi, D. Lembo, D. Calvanese, G. De Giacomo, M. Lenz-erini, and R. Rosati, “Linking data to ontologies,”J. on Data Sem., vol. 10, pp. 133–173, 2008.
[2] I. Horrocks, “Ontologies and the semantic web,” Commun. ACM, vol. 51, no. 12, pp. 58–67, 2008.
[3] R. V. Guha, D. Brickley, and S. Macbeth, “Schema.org: evolution of structured data on the web,” Commun. ACM, vol. 59, no. 2, pp. 44–51, 2016.
[4] D. Lee, R. Cornet, F. Y. Lau, and N. de Keizer, “A survey of SNOMED CT implementations,” Journal of Biomedical Informatics, vol. 46, no. 1, pp. 87–96, 2013.
[5] B. Charron, Y. Hirate, D. Purcell, and M. Rezk, “Extracting semantic information for e-commerce,” in ISWC, 2016, pp. 273–290.
[6] G. Kobilarov, T. Scott, Y. Raimond, S. Oliver, C. Sizemore, M. Smethurst, C. Bizer, and R. Lee, “Media meets semantic web - how the BBC uses dbpedia and linked data to make connections,” inESWC, 2009.
[7] D. Calvanese, G. De Giacomo, D. Lembo, M. Lenzerini, A. Poggi, M. Rodriguez-Muro, R. Rosati, M. Ruzzi, and D. F. Savo, “The MASTRO system for ontology-based data access,”Semantic Web J., vol. 2, no. 1, pp. 43–53, 2011.
[8] F. Priyatna, ´O. Corcho, and J. Sequeda, “Formalisation and experiences of R2RML-based SPARQL to SQL query trans-lation using morph,” inWWW, 2014.
[9] C. Bizer and A. Seaborne, “D2RQ - treating non-RDF databases as virtual RDF graphs,” inISWC P&D, 2004.
[10] K. Munir, M. Odeh, and R. McClatchey, “Ontology-driven re-lational query formulation using the semantic and assertional capabilities of OWL-DL,” Knowl.-Based Syst., vol. 35, pp. 144–159, 2012.
[11] J. Sequeda and D. P. Miranker, “Ultrawrap: SPARQL execu-tion on relaexecu-tional data,”J. of Web Sem., vol. 22, no. 0, 2013.
[12] M. Rodriguez-Muro and D. Calvanese, “High performance query answering over DL-Lite ontologies,” inKR, 2012.
[13] I. Horrocks, M. Giese, E. Kharlamov, and A. Waaler, “Using Semantic Technology to Tame the Data Variety Challenge,” IEEE Internet Computing, vol. 20, no. 6, pp. 62–66, 2016.
[14] E. Kharlamov, D. Hovland, M. G. Skjæveland, D. Bilidas, E. Jim´enez-Ruiz, G. Xiao, A. Soylu, D. Lanti, M. Rezk, D. Zheleznyakov, M. Giese, H. Lie, Y. E. Ioannidis, Y. Ko-tidis, M. Koubarakis, and A. Waaler, “Ontology Based Data Access in Statoil,” J. Web Sem., vol. 44, pp. 3–36, 2017.
[15] A. Soylu, E. Kharlamov, D. Zheleznyakov, E. Jim´enez-Ruiz, M. Giese, M. G. Skjæveland, D. Hovland, R. Schlatte, S. Brandt, H. Lie, and I. Horrocks, “OptiqueVQS: A visual query system over ontologies for industry,” Semantic Web, vol. 9, no. 5, pp. 627–660, 2018.
[16] C. Pinkel, C. Binnig, E. Jim´enez-Ruiz, E. Kharlamov, W. May, A. Nikolov, A. S. Bastinos, M. G. Skjæveland, A. Solimando, M. Taheriyan, C. Heupel, and I. Horrocks, “RODI: benchmarking relational-to-ontology mapping gener-ation quality,”Semantic Web, vol. 9, no. 1, pp. 25–52, 2018.
[17] A. Soylu, M. Giese, E. Jim´enez-Ruiz, E. Kharlamov, D. Zheleznyakov, and I. Horrocks, “Ontology-based end-user visual query formulation: Why, what, who, how, and which?” Universal Access in the Information Society, vol. 16, no. 2, pp. 435–467, 2017.
[18] E. Kharlamov, T. Mailis, G. Mehdi, C. Neuenstadt, ¨O. L. ¨
Ozc¸ep, M. Roshchin, N. Solomakhina, A. Soylu, C. Svingos, S. Brandt, M. Giese, Y. E. Ioannidis, S. Lamparter, R. M¨oller, Y. Kotidis, and A. Waaler, “Semantic access to streaming and static data at Siemens,”J. Web Sem., vol. 44, pp. 54–74, 2017.
[19] A. Soylu, M. Giese, R. Schlatte, E. Jim´enez-Ruiz, E. Khar-lamov, ¨O. L. ¨Ozc¸ep, C. Neuenstadt, and S. Brandt, “Querying industrial stream-temporal data: An ontology-based visual approach,”JAISE, vol. 9, no. 1, pp. 77–95, 2017.
[20] M. Arenas, B. C. Grau, E. Kharlamov, S. Marciuska, and D. Zheleznyakov, “Faceted search over RDF-based knowl-edge graphs,”J. Web Sem., vol. 37-38, pp. 55–74, 2016.
[21] E. Kharlamov, D. Hovland, E. Jim´enez-Ruiz, D. Lanti, H. Lie, C. Pinkel, M. Rezk, M. G. Skjæveland, E. Thorstensen, G. Xiao, D. Zheleznyakov, and I. Horrocks, “Ontology Based Access to Exploration Data at Statoil,” inISWC, 2015.
[22] E. Kharlamov, D. Zheleznyakov, and D. Calvanese, “Cap-turing model-based ontology evolution at the instance level: The case of DL-Lite,” J. Comput. Syst. Sci., vol. 79, no. 6, pp. 835–872, 2013.
[23] J. Crompton, “Keynote talk at the W3C workshop on sem. web in oil & gas industry,” 2008.
[24] E. Jim´enez-Ruiz, E. Kharlamov, D. Zheleznyakov, I. Hor-rocks, C. Pinkel, M. G. Skjæveland, E. Thorstensen, and J. Mora, “BootOX: Practical Mapping of RDBs to OWL 2,” in ISWC, 2015, pp. 113–132.
[25] A. Solimando, E. Jim´enez-Ruiz, and G. Guerrini, “Detecting and correcting conservativity principle violations in ontology-to-ontology mappings,” inISWC, 2014.
[26] M. Console, V. Santarelli, and D. Savo, “Efficient approxi-mation in DL-Lite of OWL 2 ontologies,” inDL, 2013.