DO WE REALLY DRIVE AS WE FEEL?
¹N. Kinnear, ²S. Kelly, ²J. Thompson & ¹S. Stradling.
1Transport Research Institute Napier University
Edinburgh EH11 4BN
2Department of Psychology Strathclyde University
Glasgow G1 1QE.
INTRODUCTION
Learning to drive has been conceptualised as a series of stages which take the learner from mastery of the basic mechanics of driving, through anticipation of other road user’s behaviour, to the development of a driving style consistent with the skill achieved in the first two stages (Parker & Stradling, 2002). Deery (1999) suggests that hazard perception is one of the main skills to be acquired in the second stage and that this skill is poorly developed in the inexperienced (and usually young) driver.
While strategic deliberation has an obvious role to play in general decision making, and more specifically, in hazard perception, Damasio (1994, 2004) has suggested that a complementary emotional learning system also influences behaviour independently from conscious strategic processes. For example, if a situation were to develop that could advance into something threatening or dangerous, a feeling of unpleasantness would be produced in the body (i.e. – a gut feeling) and this bodily feeling will be marked against the developing scenario so that the organism will learn that should this scenario begin to be built up again, the body can respond earlier (Damasio, 1996). The process has been labelled the Somatic Marker Hypothesis (SMH) (Damasio, 1994).
Damasio writes:
“Somatic markers (SM) are a special instance of feelings generated from secondary emotions. Those emotions and feelings have been connected by learning to predicted future outcomes of certain scenarios. When a negative SM is juxtaposed to a particular future outcome the combination functions as an alarm bell…SMs may operate covertly (without coming to consciousness)” (Damasio 1994, page 174)
threat/punishment and gain/reward has been demonstrated to operate in laboratory settings through the Iowa Gambling Task (Bechara et al, 1994, 1997). Whilst these findings support the Somatic Marker Hypothesis, unsurprisingly, the SMH as a neurological framework has been the focus of debate (Maia & McClelland, 2004; Dunn, Dalgleish & Lawrence, 2006). Responses to most critiques have been given by Damasio and supporters and a revision of the somatic marker hypothesis thus states that:
“the central feature of the somatic marker hypothesis is not that non-conscious biases accomplish decisions in the absence of conscious knowledge, but rather that emotion-related signals assist cognitive processes even when they are non-conscious” (Bechara et al, 2005, p.159).
Experiencing traumatic/hazardous situations while driving, even when not resulting in injury, has been shown to be associated with negative affect and increased concern for personal safety (Lucas, 2003). Such development of substantial fear and anxiety in a real-life situation, which may have dramatic consequences for individuals, would intuitively be exactly the type of situation where emotional learning would have an influential role in guiding behaviour. It may be the case that development of an emotional learning response / somatic marker to various situations of potential risk while driving is a critical component of becoming an ‘experienced’ driver and guides safer driving behaviour in conjunction with improved strategic hazard perception.
The current paper describes two laboratory experiments that were set up to explore whether the principals behind the Somatic Marker Hypothesis can be applied to the realm of driver behaviour. Experiment 1 examined the Skin Conductance Response (SCR) of experienced and inexperienced drivers to three types of still images. These still images were of ‘safe’, ‘hazardous’ and ‘developing hazard’ situations. Subjective judgements of how hazardous the situation appeared to be were also collected. It is predicted that experienced and inexperienced drivers will not differ in their emotional response to safe and hazardous scenarios. However, if there is emotional learning via experience then experienced drivers should be more likely than inexperienced drivers to demonstrate a SCR to a picture portraying a potential hazard. Such a difference could be explained by inexperienced drivers failing to appreciate the potential risk inherent in the depicted situation. If this were the case then subjective ratings of danger should also show a difference by experience level. However, if the ratings of danger are similar then this would support the idea of an emotional system that operates independently of a cognitive appraisal system.
* - The Driving Standards Agency (DSA) is not involved with the current research. Any views reported here are those of the researchers alone and are not representative of those of the Driving Standards Agency (DSA).
EXPERIMENT 1
METHOD
Eighteen inexperienced (held UK licence for under 3 years) and 17 experienced drivers (held UK licence for over 3 years) viewed 15 still images of road situations (5 safe, 5 hazardous and 5 ‘developing hazards’) taken from a commercially available CD-ROM. The images were presented for 5 seconds each. After each clip, participants were asked to rate on a scale of 1-7 (Safe to Hazardous) how hazardous the situation appeared. Respiration and SCR data were recorded throughout the experiment. The images were randomly presented full screen on a 19” computer monitor. A button box was used to record participants ratings. The psychophysiological measurements were taken using Biopac 10 software and associated hardware.
RESULTS AND DISCUSSION
Table 1 shows the mean cognitive ratings for how hazardous each still image was judged to be. As can be seen, both the experienced and inexperienced drivers gave similar ratings to the Hazards and Developing Hazards. A Kruskal-Wallis test shows that only the ratings for the safe images were significantly different with experienced drivers giving higher ratings than inexperienced. However, the crucial comparison is that of ‘developing hazard’ and it can be seen that not only do the two ratings not differ in statistical significance, they are also numerically very similar.
TABLE 1
Mean hazard ratings for still images
| |Safe |Developing Hazard |Hazard | |Inexperienced |1.58 (.32) |3.36 (.76) |4.81 (.77) | |Experienced |2.18 (.97) |3.49 (1.26) |4.40 (1.51) | |?2 |4.78* |.11 |.40 |
* p < .05
TABLE 2
Mean percentage of responses showing a SCR to the stimulus item
| |Safe |Developing Hazard |Hazard | |Inexperienced |21.1 (20.0) |14.4 (20.4) |24.4 (22.3) | |Experienced |28.2 (23.5) |34.1 (27.2) |32.9 (30.8) | |?2 |.68 |5.74* |.47 |
* p < .05
In summary, no difference was found for cognitive ratings of danger for ‘developing hazard’ stimuli between drivers of differing experience yet these stimuli did show a significantly different number of emotional responses for experienced and inexperienced drivers. This lends support to the idea of an emotional learning system that is separate from a cognitive decision making system. The inexperienced drivers knew that the developing hazards were riskier situations to encounter than safe situations but they did not appear to feel that they were riskier. In contrast, the experienced drivers treated developing hazards as emotionally identical to the actual hazards while cognitively recognising them as less risky than a hazardous scene. Experiment 1 also supports the idea that experience is necessary for the formation of these emotional markers. If emotional learning plays a crucial role in safe driving then this component appears to be lacking in the inexperienced driver. The results of experiment 1 call for replication using stimuli with enhanced ecological validity to further explore the effect of experience on the emotional appraisal of developing hazards.
EXPERIMENT 2
METHOD
Participants
Eleven learner drivers (m=5; f=6), 21 inexperienced (m=9; f=12) and 18 experienced drivers (m=10; f=8) took part. Inexperienced drivers were defined as having held a driving licence for less than 3 years (mean = 13.33 months, std dev = 8.86, range 1-29) and experienced drivers as having held their licence for over 3 years (mean = 86.22 months, std dev = 43.63, range 36-168).
The learner driver group had a mean age of 21.7 years (std dev = 2.9, range 17.6-27.3); the inexperienced driver group had a mean age of 21.7 years (std dev = 3.6, range 17.8-33.8); and the experienced driver group had a mean age of 25.4 years (std dev = 2.9, range 20.3-31.0)
Materials and Apparatus
dynamically responded throughout the duration of the clip by using a slider to rate how hazardous the scene was. The slider was labelled ‘Safe’ at one end to ‘Hazardous’ at the other. Psychophysiological measurements were taken using Biopac 10 software and hardware.
Procedure
Participants were seated approximately 60cm from the computer monitor with the slider at a comfortable distance on the desk. Electrodes were attached to the participant’s index and middle finger of their non-dominant hand and they were asked to position a belt attached to a respiratory transducer around their chest. Heart rate was also monitored although this is not reported here. They were asked to take several large breaths in order to check the recording equipment was operational and to provide a comparison respiration trace. Participants were informed that they would see twelve clips of normal driving scenarios and asked to imagine that they were the driver of the vehicle. It was not mentioned that there were any hazards in the scenes they would encounter. In order for participants to become accustomed to the slider and to check the equipment, each participant had a practice trial before they began.
RESULTS
For a SCR to be included in the data, it had to be equal to or exceed 0.05 delta micro Mhos (Dawson, Schell & Filion, 2000). In order to extract data from participants’ continuous SCR response during the HP clips, timing markers were required.
Hazard Start Marker
The start of the hazard was defined using digital video editing equipment. This enabled the HP clips to be broken down into frames with exact timings. The item that eventually became the hazard was defined and analysed for the first frame in which that item occurred. This was therefore the Hazard Start Marker as it was the first moment at which the hazard began to be built up.
This practise was followed for all clips except clip 12 where two bikers ride along a parallel road for a considerable period of time. It is only when the parallel road then joins with the driver’s road that a hazard ensues. For clip 12 the hazard start marker was defined from the moment at which the junction became visible.
Critical Moment Marker
The critical moment was defined as being the moment at which the driver in the HP clip takes avoiding action to the hazard. Avoiding action involved either braking or changing direction. Again, using digital video editing equipment allowed for exact timing of this moment.
Event Period
Moment Marker. The researchers defined this as an Event Response. However, as the critical moment was the final moment at which the driver in the clip responded to the hazard, some drivers demonstrated this event response prior to our defined Critical Moment Marker. To allow for event response variation, a period of time was defined around the Critical Moment Marker. This was termed the Event Period. The Event Period started from 75% of the total hazard time for each clip to 3 seconds after the Critical Moment Marker. All participants’ event responses fell within this period. The three seconds after the Critical Moment was included as three seconds after a stimulus is presented is the normal range for including responses in SCR data (Dawson, Schell & Filion, 2000).
Anticipatory Period
The knock on effect of defining the Event Period meant that an area was defined that started from the Hazard Start Marker to 75% of the total time of the hazard. This area was therefore defined as the Anticipatory Period and any responses within this area would be considered an anticipatory response to the build up of a hazard.
Due to the slight delay of SCR responses (Dawson, Schell & Filion, 2000) any response within one second of the Hazard Start was not included as this may have been caused by something which happened prior to the start of the hazard period. A demonstration of the Anticipatory Period, Event Period and timing markers can be seen in Figure 1.
FIGURE 1
Demonstration of timing markers and areas used to extract SCR data from participants
responses.
[pic]
Anticipatory Score
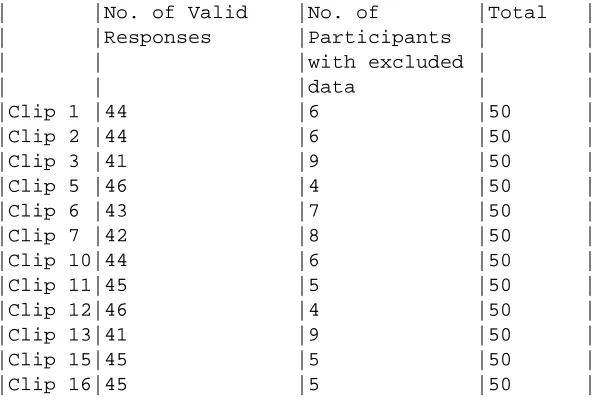
So that the three experience groups could be compared for their frequency of demonstrating an anticipatory response, an overall anticipatory score was produced. The anticipatory score involved collating the number of clips in which a participant demonstrated a valid SCR response within the anticipatory area. If a participant had more than one valid SCR response within the anticipatory area, this was only counted as having demonstrating an anticipatory response for the purpose of the anticipatory score. All participants viewed 12 HP clips and therefore had 12 SCR readings that could be coded using the above definition. However, as SCR is an extremely sensitive measure, interference can cause a change in SCR that compromises the reliability of measuring an emotional response. Irregular respiration (as measured by the respiration belt), sudden movement or a technical fault, were all reasons for excluding some hazard responses from the current sample. Therefore, although a participant had viewed 12 clips they may not have had valid data for all 12 clips. Table 3 summarises the number of excluded cases per clip.
Number of participants per clip who had a valid response or who were excluded from analysis.
| |No. of Valid |No. of |Total | | |Responses |Participants | | | | |with excluded | | | | |data | |
|Clip 1 |44 |6 |50 |
|Clip 2 |44 |6 |50 |
|Clip 3 |41 |9 |50 |
|Clip 5 |46 |4 |50 |
|Clip 6 |43 |7 |50 |
|Clip 7 |42 |8 |50 |
|Clip 10|44 |6 |50 |
|Clip 11|45 |5 |50 |
|Clip 12|46 |4 |50 |
|Clip 13|41 |9 |50 |
|Clip 15|45 |5 |50 |
|Clip 16|45 |5 |50 |
The following equation was used to determine a participant’s Anticipatory Score:
No. of clips with an anticipatory response
Anticipatory Score = --- x 100 No. of clips with a valid response
This therefore gave each participant a percentage score of the percentage of clips that they would demonstrate an anticipatory response.
Anticipatory Score
For the analysis of the Anticipatory Score, four participants were excluded for having valid responses to less than eight of the twelve clips. Of these four participants, one had no valid data; two had valid data for only two clips; and one had valid data for only seven clips. All other participants had data for at least 9 clips. Three of the excluded participants were from the inexperienced group and one was from the experienced group.
Table 4 summarises the anticipatory scores for the 3 experience groups. A difference of mean score can be seen between the learner, inexperienced and experienced groups. Whilst the difference between the mean score of the learner group and the inexperienced group is around 9%, the experienced group score is just over double that of the inexperienced group. Due to a wide range of scores within each group, the median score is also reported and suggests a similar but more extreme trend between the groups.
TABLE 4
|Participant |N |Mean |Median|Min |Max |SD | |Group | |(%) |(%) |Score |Score | | | | | | |(%) |(%) | | |Learner |11 |23.61 |16.67 |0.00 |81.82 |26.20 |
An error bar chart demonstrates that there is a relatively large difference between the experienced group and the inexperienced and learner groups with no overlap of the 95% Confidence Intervals. However, there was overlap of the 95% CIs between the learner and inexperienced groups. A plot of mean scores with 95% confidence intervals can be seen in figure 2.
FIGURE 2
Graph of 95% Confidence Interval of participant group’s Anticipatory Scores. [pic]
A one-way Analysis of Variance was performed and suggested a significant difference between the groups (F(2,43)=9.583; p<.001). Post Hoc Tukey analysis determined that significant differences were found between the experienced group and both the inexperienced group (p=.004) and learner group (p=.002). No significant difference was found between the learner and inexperienced groups.
Due to the potential influence of age, gender and exposure when analysing data related to driving, a Univariate analysis was performed with age, gender and miles driven in the past 12 months as covariates. This demonstrated that there was still a significant overall group effect (F(2,46)=13.554; p<.001) and that age, gender and miles driven were not significant influences at the .05 level.
Inexperienced Drivers
Inexperienced driver responses were further analysed. Breaking this group down by number of years driving (one, two or three years since passing their test) demonstrated no significant difference in anticipatory score. However, a natural gap in exposure was evident within the group, with those who had driven less than 1000 miles in the last 12 months (n=12) and those who had driven more than 1000 miles in the last 12 months (n=6). There was a significant difference in anticipatory score between these two groups (t=-2.456, df=16, p=.026).
The two inexperienced driver groups were compared to the learner and experienced groups. One-way ANOVA demonstrates that there is still a significant overall group effect (F(3,42)=8.647; p<.001) with Tukey post hoc analysis showing a significant difference between experienced drivers and both learners (p=.001) and the less than 1000 miles inexperienced group (p=.001). No significant difference was found between experienced drivers and the over 1000 mile inexperienced group (ns=.713).
(F(3,46)=11.820; p<.001) and that age and gender were not significant influences at the .05 level. However, miles driven in the last 12 months was significant (p=.029).
When these two groups are plotted with all driver groups a pattern emerges whereby inexperienced drivers who have driven less than 1000 miles in the previous 12 months differ little from learner drivers (see figure 3). On the contrary, inexperienced drivers who have driven more than 1000 miles in the last 12 months demonstrate a mid range score between the inexperienced average and that of experienced drivers.
FIGURE 3
Graph of Anticipatory Score by experience group
DISCUSSION
The results of experiment 2 build on those of experiment 1. Experiment 1 demonstrated a significant difference in the proportion of SCRs between inexperienced and experienced drivers to developing hazards. Experiment 2 repeated this finding and found a further relationship when including learner drivers. However, experiment 1 also demonstrated that inexperienced and experienced drivers cognitively rated developing hazards the same therefore suggesting a crucial difference between their cognitive and emotional responses. Unfortunately, similar analysis is not currently available for experiment 2. However, the results do support the hypothesis and the theoretical concept of an emotional learning system.
driver gains UK driving license status, their ability to emotionally anticipate hazards is no better off. Only once active experience of solo driving begins do drivers embark on an apparent learning curve whereby they increase their emotional anticipation of hazards.
Importantly, it was demonstrated that time of having held a license was not important and that only through experience of the task will drivers begin to increase their ability to emotionally appraise developing hazards. Concurrent findings of self-report data suggest that novice driver crash risk reduces dramatically after the first 500 miles of on-the-road solo driving experience (McCartt, Shabanova & Leaf, 2003). This could be comparable to the increase in anticipatory score demonstrated within the current sample when having driven more than 1000 miles.
Driver research also reports that initial solo driver experience is more important than even age as an accident reducing factor (Maycock, Lockwood & Lester, 1991; Forsyth, Maycock & Sexton, 1995). Yet despite this, there is little understanding of the process by which this initial crash risk reduces. During this period, the vast majority of novice drivers are not undergoing any further education or training, yet they are continuing to learn something. The current results would suggest that the driver is learning processes that allow an emotional appraisal of the driving task that facilitates an early warning of potential hazards.
Of course, the role of feelings and emotion in driving is not foundationless (Fuller, 2006; Kinnear, Stradling & McVey, In Press; Vaa, 2005). In support of the Task Capability Interface model, Fuller (2005) and Kinnear et al (In Press) reported finding that drivers rate their feelings of risk in the same way as they rate the difficulty of the task. This suggests that the feedback which drivers receive from the driving scenario may be appreciated through feelings, hence allowing a driver to understand both the difficulty and the risk of the task at the same time. If this were the case then the current results would lend further support for the role of emotions and feelings in the driving task.
CONCLUSION
In conclusion, three important points are of note across the two experiments. Firstly, both experiments have demonstrated a difference in the SCR rate to developing hazards between inexperienced and experienced drivers. Secondly, experiment 1 provided evidence that emotional appraisal of potentially hazardous situations is something that is separate from cognitive judgement of the scenarios. And thirdly, experiment two demonstrated a learning curve in the emotional appraisal of developing hazards which is mediated by driver experience. Therefore the current paper not only provides support for the underlying principles of the Somatic Marker Hypothesis being applied to driver behaviour, but it also suggests that we do drive as we feel.
REFERENCES
Bechara, A., Damasio, A. & Damasio, H. (1994) Insensitivity to future consequences following damage to human prefrontal cortex. Cognition, 50, 7-15.
Bechara, A., Damasio, H., Tranel, D. & Damasio, A. (2005). The Iowa Gambling Task and the somatic marker hypothesis: some questions and answers. Trends in Cognitive Sciences, 9, 159-162.
Damasio, A.R. (1994). Descartes’ Error: Emotion, Reason and the Human Brain. Putnam, New York.
Damasio, A. R. (1996). The somatic marker hypothesis and the possible functions of the prefrontal cortex. Philosophical Transactions of the Royal Society B: Biological Sciences, 351(1346), 1413-1420.
Damasio, A.R. (2004). Looking for Spinoza: Joy, Sorrow and the Feeling Brain. Heinemann, London.
Dawson, M. E., Schell, A. M., & Filion, D. L. (2000). The electrodermal system. In J.T.
Cacioppo, L. G. Tassinary, & G. G. Berntson. (Eds.) Handbook of Psychophsiology. New York:
Cambridge University Press.
Deery, H.A. (1999). Hazard and risk perception among young novice drivers. Journal of Safety
Research, 30, 225-236.
Dunn, B.D., Dalgliesh, T. & Lawrence, A.D. (2006). The somatic marker hypothesis: A critical evaluation. Neuroscience and Neurobehavioral Reviews, 30, 239-271.
Forsyth, E., Maycock, G. & Sexton, B. (1995). Cohort study of learner and novice drivers: Part
3, Accidents, offences and driving experience in the first three years of driving. Project Report
PR111. Crowthorne: TRL Limited.
Fuller, R. (2005). Driving by the seat of your pants: a new agenda for research. In,
Behavioural Research in Road Safety 2005. Department for Transport, London.
Kinnear, N., Stradling, S.G. & McVey, C.J. (In Press). Do we really drive by the seat of our pants? In, L. Dorn (Ed.). Driver Behaviour and Training: Volume III. Ashgate.
Lucas, J. (2003). Drivers’ psychological and physical reactions after motor vehicle accidents.
Transport Research Part F6, 135-145
Maia, T.V. and McClelland, J.L. (2004). A reexamination of the evidence for the somatic marker hypothesis: What participants really know in the Iowa gambling task. PNAS, vol. 101, no. 45, Nov. 9, 2004.
Maycock, G., Lockwood, C. R., & Lester, J. F. (1991). The accident liability of car drivers (No. 315). Crowthorne: Transport Research Laboratory.
Parker, D. & Stradling, S. (2002). Influencing driver attitudes and behaviour. Department of
Vaa, T. (2005). Modelling Driver Behaviour on Basis of Emotions and Feelings: Intelligent transport systems and behavioural adaptations. Driver Behaviour Workshop, Ispra, Italy, May 2005.