Gibson, L.T. (2010) Volatile aldehydes in libraries and archives. Atmospheric Environment, 44 (17). pp. 2067-2073. ISSN 1352-2310
http://strathprints.strath.ac.uk/18738/
This is an author produced version of a paper published in Atmospheric Environment, 44 (17).
pp. 2067-2073. ISSN 1352-2310. This version has been peer-reviewed but does not include the final publisher proof corrections, published layout or pagination.
Strathprints is designed to allow users to access the research output of the University of Strathclyde. Copyright © and Moral Rights for the papers on this site are retained by the individual authors and/or other copyright owners. You may not engage in further
distribution of the material for any profitmaking activities or any commercial gain. You may freely distribute both the url (http://strathprints.strath.ac.uk) and the content of this paper for research or study, educational, or not-for-profit purposes without prior
permission or charge. You may freely distribute the url (http://strathprints.strath.ac.uk) of the Strathprints website.
Title: Volatile Aldehydes in Libraries and Archives
Authors: Ann Fenech1, Matija Strlič1*, Irena Kralj Cigić2, Alenka Levart3, Lorraine T. Gibson4, Gerrit de Bruin5, Konstantinos Ntanos6, Jana Kolar7, May Cassar1
Affiliations: 1 University College London, Centre for Sustainable Heritage, The Bartlett School of Graduate Studies (Torrington Place site), Gower Street, London WCIE 6BT, UK
2 University of Ljubljana, Faculty of Chemistry and Chemical Technology, Aškerčeva 5, 1000 Ljubljana, Slovenia
3 University of Ljubljana, Biotechnical Faculty, Jamnikarjeva 101, 1000 Ljubljana, Slovenia
4 Department of Pure and Applied Chemistry, WestCHEM, University of Strathclyde, Glasgow GI IXL, UK
5 Nationaal Archief, P.O. Box 90520, 2509 LM, The Hague, The Netherlands 6 National Archives, Kew, Richmond, Surrey, TW9 4DU, UK
7 National and University Library, Turjaška 1, 1000 Ljubljana, Slovenia
*Corresponding Author: Matija Strlič
E-mail: [email protected]
Abstract
Volatile aldehydes are produced during degradation of paper-based materials. This may result in their accumulation in archival and library repositories. However, no systematic study has been performed so far. In the frame of this study, passive sampling was carried out at ten locations in four libraries and archives. Despite the very variable sampling locations, no major differences were found, although air-filtered repositories were found to have lower concentrations while a non-ventilated newspaper repository exhibited the highest concentrations of volatile aldehydes (formaldehyde, acetaldehyde, furfural and hexanal). Five employees in one institution were also provided with personal passive samplers to investigate employees’ exposure to volatile aldehydes. All values were lower than the presently valid exposure limits.
The concentration of volatile aldehydes, acetic acid, and volatile organic compounds (VOCs) in general was also compared with that of outdoor-generated pollutants. It was evident that inside the repository and particularly inside archival boxes, the concentration of VOCs and acetic acid was much higher than the concentration of outdoor-generated pollutants, which are otherwise more routinely studied in connection with heritage materials. This indicates that further work on the pro-degradative effect of VOCs on heritage materials is necessary and that monitoring of VOCs in heritage institutions should become more widespread.
1. Introduction
Atmospheric pollutants are known to negatively affect human health (Bernstein et al., 2004; Manahan, 1999), but they also affect the permanence of materials (Kucera and Fitz, 1995). The latter is of particular concern in heritage institutions, where monitoring of traffic-generated pollutants is routinely performed as they became of central interest several decades ago (Thomson, 1965; Grzywacz, 2006). SO2, NOx, and O3 are known to be the main externally generated pollutants causing heritage material degradation (Camuffo et al., 2001; Camuffo et al., 1999). With the decline of concentrations of traffic-generated pollutants as a result of strict environmental regulations in the last decade, in heritage institutions the focus is slowly shifting towards indoor-generated pollutants, particularly organic acids (Ryhl-Svendsen and Glastrup, 2002; Schieweck et al., 2005).
Typical indoor-generated pollutants, also found in libraries and archives, are volatile organic compounds (VOCs) such as organic acids including acetic and formic acid (Blades et al., 2000; Tétreault, 2003) and aldehydes, including acetaldehyde and formaldehyde (Salthammer, 2010). A variety of VOCs are known to be emitted from paper and other cellulose-based materials during degradation (Emsley and Stevens, 1994; Lattuati-Derieux et al., 2004; Lattuati-Derieux et al., 2006; Dupont et al., 2007; Strlič et al., 2007; Ramalho et al., 2009). The resulting VOC emission patterns are known to be complex (Strlič and Kolar, 2008), however, a number of volatile organic compounds were recently identified as specific degradation markers using material degradomics (Strlič et al., 2009).
Moreover, some of the identified VOCs (aldehydes and organic acids) could potentially lead to accelerated degradation of collection materials (Dupont and Tétreault, 2000) if the air exchange rate is not sufficient to remove the emitted VOCs. Additionally, there is limited information on micro-climates inside archival boxes (Dupont and Tétreault, 2000; Wise et al., 2005), particularly in relation to the migration of pollutants into and out of the boxes. So far, most analyses of VOCs in museum environments focussed on measurements of organic acids (Gibson et al., 1997; Srivastava et al., 2000; Ryhl-Svendsen and Glastrup, 2002) and a method development for formaldehyde determination using passive samplers was described (Gibson et al., 2008).
are removed from the sorbent by thermal desorption or solvent extraction. Common collection times for active sampling are either 15 min periods, to determine the short-term exposure limit (STEL), or 8 h for the time-weighted average (TWA) concentration. Increased periods of active sampling can be performed. However it is not always practical to leave pumps running overnight when longer-term averages are needed. In such situations, passive sampling methods are often the preferred method of choice as they typically involve sampling periods of between 7 and 28 days (Gibson et al., 1997; Bruno et al., 2008; Caselli et al., 2009). This longer sampling period is particularly suited to museum studies where a short term sampling measurement might not necessarily reflect the average pollutant concentrations surrounding objects held in enclosed spaces for many years.
This is the first systematic study of volatile aldehydes in institutions housing paper-based collections. The deployment of passive samplers at various locations in four institutions allowed for comparisons of aldehyde concentrations between and within institutions. Formaldehyde, acetaldehyde, furfural and hexanal were the major volatile aldehydes investigated. By comparing the data with health and safety regulations and with the potential effects of the pollutants on heritage materials, the need for corresponding guidelines in archives and libraries could arise. However, further work is needed to understand the effect of volatile aldehydes on the stability of heritage materials.
2. Experimental
2.1 Monitoring Locations
Despite the variety of environments, it turned out that more detailed description of the repositories was not necessary.
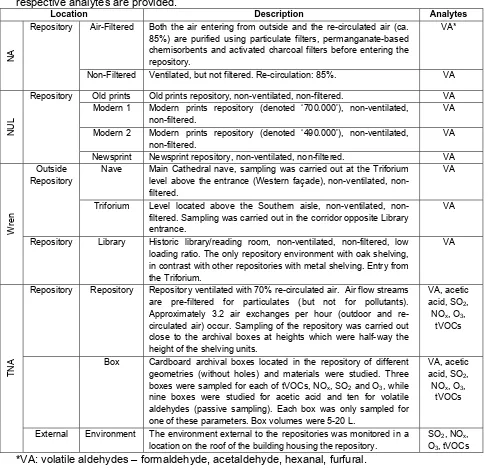
Table 1: Description of locations sampled in the Nationaal Archief, The Hague (NA), St. Paul’s Cathedral, London (Wren), The National Archives, Kew (TNA), and National and University Library of Slovenia, Ljubljana (NUL). Details on measurement locations and the respective analytes are provided.
Location Description Analytes
NA
Repository Air-Filtered Both the air entering from outside and the re-circulated air (ca. 85%) are purified using particulate filters, permanganate-based chemisorbents and activated charcoal filters before entering the repository.
VA*
Non-Filtered Ventilated, but not filtered. Re-circulation: 85%. VA
NUL
Repository Old prints Old prints repository, non-ventilated, non-filtered. VA
Modern 1 Modern prints repository (denoted ‘700.000’), non-ventilated, non-filtered.
VA
Modern 2 Modern prints repository (denoted ‘490.000’), non-ventilated, non-filtered.
VA
Newsprint Newsprint repository, non-ventilated, non-filtered. VA
W
ren
Outside Repository
Nave Main Cathedral nave, sampling was carried out at the Triforium level above the entrance (Western façade), ventilated, non-filtered.
VA
Triforium Level located above the Southern aisle, ventilated, non-filtered. Sampling was carried out in the corridor opposite Library entrance.
VA
Repository Library Historic library/reading room, non-ventilated, non-filtered, low loading ratio. The only repository environment with oak shelving, in contrast with other repositories with metal shelving. Entry from the Triforium.
VA
TNA
Repository Repository Repository ventilated with 70% re-circulated air. Air flow streams are pre-filtered for particulates (but not for pollutants). Approximately 3.2 air exchanges per hour (outdoor and re-circulated air) occur. Sampling of the repository was carried out close to the archival boxes at heights which were half-way the height of the shelving units.
VA, acetic acid, SO2,
NOx, O3,
tVOCs
Box Cardboard archival boxes located in the repository of different geometries (without holes) and materials were studied. Three boxes were sampled for each of tVOCs, NOx, SO2 and O3, while
nine boxes were studied for acetic acid and ten for volatile aldehydes (passive sampling). Each box was only sampled for one of these parameters. Box volumes were 5-20 L.
VA, acetic acid, SO2,
NOx, O3,
tVOCs
External Environment The environment external to the repositories was monitored in a location on the roof of the building housing the repository.
SO2, NOx,
O3, tVOCs *VA: volatile aldehydes – formaldehyde, acetaldehyde, hexanal, furfural.
Personal SKC samplers were also given to five employees at the NA:
‐ Two repository workers: 15 h per week in repository
‐ A researcher: 20 h per week, 12 h of which in repository
‐ An employee working in distribution
Other workers do not work in repositories, but may get in contact with paper-based materials either in the office, distribution or repacking.
The personal samplers were worn and exposed by the workers during working hours, then closed, placed in resealable bags and stored overnight at 4 oC, daily, for four weeks and the total exposure time was calculated.
2.2 Monitoring of Volatile Aldehydes
2.2.1 Determination of Aldehydes Using SKC Passive Samplers
SKC Umex100 formaldehyde samplers (SKC, Blandford, UK) were supplied and used as received, for determination of formaldehyde, acetaldehyde, hexanal and furfural. The samplers, which contain a solid support impregnated with 2,4-dinitrophenylhydrazine (DNPH) that reacts with aldehydes to form their corresponding hydrazones, were exposed to the environment for 7 days to collect any aldehydes in the test environment. Blanks (unopened samplers) were positioned in the vicinity of the samplers measuring the repository environments.
After sampling, the aldehyde derivatives were eluted from the samplers using 10 mL of acetonitrile. Solutions were analysed by reverse-phase high performance liquid chromatography (Waters Alliance 2690 separations module equipped with 2487 Dual wavelength absorbance detector; software: Millenium) using a Phenomenex Gemini C18 column with dimensions of 250 mm × 4.6 mm × 5 µm). Two solutions were used for gradient elution: Solution A contained 45% acetonitrile and 55% acetic acid in water (0.2% v/v); Solution B contained 100% acetonitrile. Starting conditions used 100% of Solution A for 10 min then a linear gradient was applied over 30 min until the eluent contained 10% Solution A and 90% Solution B. This eluent mix was held for a further 15 min. The eluent flow rate was 1 ml/min. Spectrophotometric detection of the DNPH derivatives was performed at 365 nm and quantification was carried out using calibration curves for standard hydrazone solutions (T011/IP-6A Aldehyde/Ketone-DNPH, supplier: Supelco, Bellefonte PA, USA) of each corresponding aldehyde. Linear least square regression was used to calculate sample concentrations (R2 > 0.9995).
different geometries of SKC and Radiello samplers, the sampling ratios for different compounds vs formaldehyde, for the two geometries, were considered to be comparable. The ratios calculated as adjustment factors were as follows: 0.8 for acetaldehyde, and 0.2 for furfural and hexanal, relative to the sampling rate for formaldehyde, for the SKC sampling geometry. While there are no sampling rates available for furfural, we used the correction factor 0.2, by analogy with other aldehydes of similar molecular weight.
Standard deviation was always calculated based on the results obtained from three samplers exposed in the same location (repository), except when these were used as personal samplers, where only one sampler was worn by each member of personnel, or placed in boxes, where one sampler per box was used and the values from different boxes were averaged. Care was taken to open the boxes as little as necessary to insert the samplers. In repositories, the samplers were place on empty shelves in the middle of the repository.
2.2.2 Determination of Hexanal Using Tenax Desorption Tubes
To determine the concentration of hexanal in air, thermal desorption tubes filled with Tenax TA were used as passive samplers (Gradko, Winchester, UK) and deployed for one week in various locations. Other volatile aldehydes of interest in the study (formaldehyde, acetaldehyde, furfural) cannot be determined using this sampling method. The analyses were performed by the same company as a commercial service. Three tubes were used at each location and the measured hexanal concentrations were averaged over the three tubes. The locations were the same as for SKC samplers allowing for direct comparisons.
Cross-validation of the results obtained by using SKC passive samplers and Tenax TA desorption tubes for hexanal showed a satisfactory correlation, y = (0.80±0.04)x - (0.14±0.04), R2 = 0.93; where x = Tenax tube results, y = SKC sampler results. The average RSD of the Tenax method was 23% and that of the SKC method 10%. Despite the indicated systematic error due to the intercept not being 0, this indicates that the SKC sampling method with liquid chromatographic analysis gives comparable results to the accredited method.
2.3 Monitoring of Nitrogen Oxides, Ozone and Sulfur Dioxide
monitored continuously for a week, with readings recorded in 15 min intervals, and daily averages were calculated.
Inside the boxes (after having made a cut in the box and sampled without opening it), the microenvironments were sampled for one parameter only per box (either NOx, O3 or SO2, cf. Table 1). The values obtained after the readings stabilised (approximately 30 s), were averaged and the standard deviation was calculated. Due to the pump flow of 500 mL/min, the readings slowly decreased after 2 min, which is when the measurements were discontinued.
2.4 Monitoring of tVOCs
A ppbRAE 3000 (10.6 eV lamp; RAE Systems, San Jose, USA) portable continuous VOC monitoring instrument was used to measure total VOC (tVOC) concentration. The instrument is calibrated against the calibration gas isobutylene, therefore, all measurements express values of tVOCs in ppb of the calibration gas. tVOCs do not include formaldehyde and acetic acid as VOCs with ionisation energy higher than 10.6 eV cannot be detected using this instrument.
Continuous monitoring at the National Archives (Kew, UK) repository was carried out for a week and readings were taken at 15 min intervals. Microenvironments inside boxes (cf. Table 1) were monitored as described in 2.3 for other pollutants.
2.5 Monitoring of Acetic Acid
Passive acetic acid sampling tubes were prepared and deployed together with blanks at the TNA (cf. Table 1). They were then analysed according to the established method (Gibson et al., 1997). Dimethoxyethane replaced glycerol as the wetting agent during impregnation of filter paper discs, together with 1 M potassium hydroxide. This disc was placed in a 7.1 cm long/1.1 cm diameter polymethylmethacrylate tube and exposed to the environment for 40 days. The obtained extracts were then analysed using ion chromatography.
3. Results and Discussion
3.1 Comparison of Aldehyde Concentrations in Different Institutions
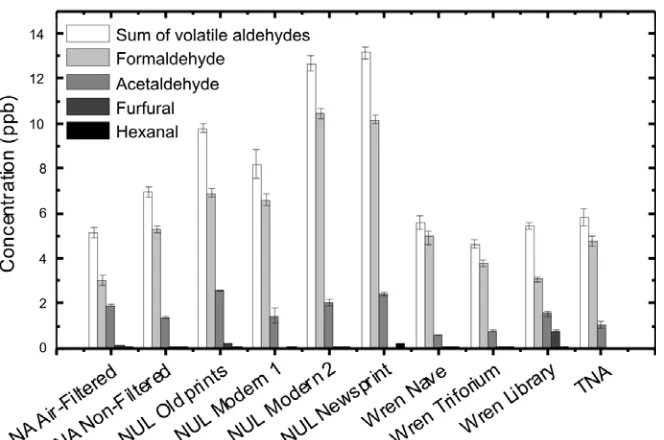
Figure 1: Concentrations of aldehydes in various repositories as determined using SKC samplers. The error bars represent standard deviation for three parallel determinations.
3.1.1 The Repositories
Two different repositories were investigated at the NA. The ‘NA Air-filtered’ repository had a lower sum concentration of the monitored aldehydes (5.1±0.2 ppb) than the ‘NA Non-filtered’ repository (7.0±0.2 ppb). However, a comparison of the individual aldehydes shows that while the concentration of formaldehyde was statistically significantly lower in the repository with air filtration (filtering both incoming outdoor and indoor air) than in the one without, acetaldehyde concentrations were slightly higher. In the repository at TNA, the concentration of volatile aldehydes was quite similar to that found at NA. Both at NA and at TNA, the repositories are ventilated, with high recirculation (Table 1).
Compared to other locations, aldehyde concentrations at NUL were the highest, 13.1±0.3 ppb, particularly in the ‘NUL Newsprint’ repository and in the ‘NUL Modern 2’ repository. Newsprint paper and many contemporary papers may contain high amounts of lignin (Micales and Skog, 1997, Goho, 2004), which leads to higher VOC emissions from these papers (Strlič et al., 2009). None of the NUL repositories are ventilated.
which, as a lignocellulosic material probably contributes to the observed high concentration of furfural, while formaldehyde concentration is comparable to that at ‘NA Air-Filtered’. Measurements were also carried out in the Triforium, which is adjacent to the Library, and in the large open Nave, which connects with the Triforium. Formaldehyde concentrations slightly increased from the library to the Nave while the concentrations of others decreased. Overall, the concentrations of volatile aldehydes at Wren library were the lowest.
All the different locations still exhibit relatively similar concentrations of formaldehyde, with 5.3±2.6 ppb being the average value over all locations measured in all repositories. While not measured, it is highly interesting that any differences in terms of loading ratios, repository sizes, air exchange and filtration and building materials (particularly in the case of St. Paul’s cathedral), do not lead to major differences in concentrations of volatile aldehydes, especially between the NA, TNA and Wren locations.
The observed elevated concentrations in NUL could be the consequence of the absence of ventilation. However, since all the NUL repositories are non-ventilated, the stored library materials must also be of importance, particularly in the ‘NUL Newsprint’ repository, where the highest concentrations were found. In a recent study, the emission of formaldehyde from degrading paper was found to be almost constant over 30 days of accelerated ageing of two types of papers (125 ± 22 ng g-1 h-1 and 685 ± 118 ng g-1 h-1; Ramalho, 2009). Archival and library collections can thus be regarded as a stable source of volatile aldehydes. The higher emission rate of formaldehyde measured by Ramalho et al. was for lignin-containing paper, such as the one contained in newsprint and much of contemporary paper contained in ‘NUL Modern 1’ and ‘NUL Modern 2’.
3.1.2 Archival Box Microenvironments
The microenvironment inside archival boxes is also of major interest as boxes represent a physical barrier to migration of compounds. Volatile aldehydes were measured in a number of archival material-filled cardboard boxes at TNA (Table 1). Archival cardboard boxes of various sizes, but high loading ratios (>50%), and filled with archival folders containing materials of various composition were studied in order to obtain an average picture.
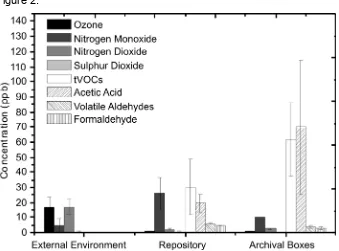
[image:11.595.76.415.347.598.2]In order to be better able to compare microenvironments in boxes with the repository environment, we measured other pollutants in addition to aldehydes: O3, NO, NO2, SO2, tVOCs, and acetic acid. Details on the number of samples are available in Table 1. A cut was made into boxes only in order to allow for the tubing to be inserted during active sampling but not bigger in order not to disrupt or dilute the atmosphere inside the box. The averaged readings obtained for measurements taken inside and outside the repository (externally to the building, ‘External Environment’), as well as inside boxes are shown in Figure 2.
Figure 2: Concentrations of pollutants inside and outside the TNA repository and inside archival boxes at TNA. No measurements of volatile aldehydes and acetic acid were taken outside the repository. The error bars represent standard deviation. For O3, NO, NO2 and SO2, and tVOCs the values for the ‘External Environment’ and the ‘Repository’ represent daily averages and for ‘Archival Boxes’ they represent short-term averages; acetic acid passive samplers were exposed for 40 days, the ones for aldehydes for a week. Cf. Experimental for details.
concentration (except that of NO) was lower than outside which is in line with other studies (Drakou et al., 1998, Chan, 2002, Ekberg, 1996), and is the result of reaction and removal through absorption into material surfaces. NO2 disproportionation in aqueous surfaces may also lead to production of HONO and HNO3, thus posing an additional threat to library and archival materials (Wainman et al., 2001). The concentrations of outdoor-generated pollutants was very low inside archival boxes (10 ppb NO, 2.5 ppb NO2, 0.7 ppb O3), indicating that the boxes provide a degree of protection from these pollutants.
A comparison was also made for volatile organic compounds. No significant concentration of tVOCs was found in the external environment. This is in contrast to the situation inside the repository (~30 ppb) and even higher concentrations of tVOCs were found inside the boxes (~60 ppb). Using passive sampling we further investigated the concentrations of acetic acid and aldehydes, inside and outside the boxes. While the concentration of aldehydes inside the repository and inside the boxes was quite similar, the situation was different for acetic acid which was found to be much more abundant inside the boxes than in the repository.
A comparison of the measurement uncertainties is also of interest. Those of traffic generated pollutants are very low compared to those of volatile aldehydes, of tVOCs and of acetic acid. This indicates that traffic generated pollutant concentrations inside boxes are unaffected by the different geometries, loading ratios, stored archival materials in the boxes, and the time since last opening, which is of interest. In contrast, the very high uncertainties in the concentrations of acetic acid and tVOCs are of high importance and can only be the consequence of the variability of the archival materials stored inside boxes.
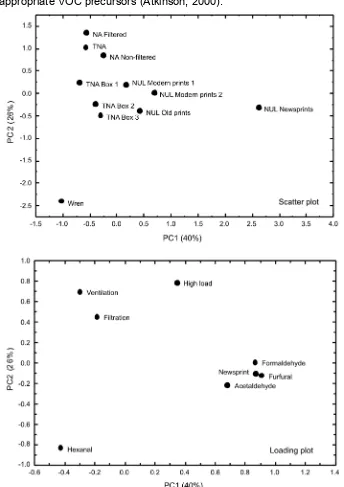
but not hexanal. This is significant and indicates that the high proportions of hexanal in the Wren library may originate from sources other than paper alone, also by oxidation from appropriate VOC precursors (Atkinson, 2000).
Figure 3: Principal component analysis of data (descriptive: high load, ventilation, filtration, newsprints, and quantitative: formaldehyde, acetaldehyde, hexanal, furfural concentration) in various storage environments, including three boxes. Above: Scatter plot, below: Loading plot.
3.2 Exposure
of
Personnel to Volatile Aldehydes
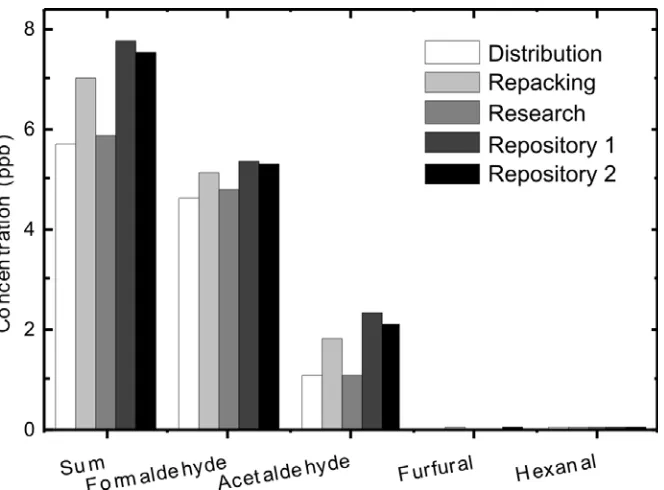
Figure 4: Mean concentrations of aldehydes to which NA workers are exposed in various work situations.
Table 2: Occupational exposure limits for volatile aldehydes (TWA: average value of
exposure over the course of an 8 h work shift that is not to be exceeded; STEL: 15-min TWA exposure that should not be exceeded at any time during a workday). Comparison with both may be meaningful, as workers typically spend less than 8 h and much more than 15 min in a repository, daily.
Country
Formaldehyde Acetaldehyde Furfural
TWA STEL TWA STEL TWA STEL
ppm ppm ppm ppm ppm ppm
Slovenia (Pravilnik, 2007) 0.5 0.5 50 50 5
The Netherlands (DECOS, 2003; van Rooy et al., 2009; International Furan Chemicals, 2003)
1 1.5 20 2
UK (Health &Safety Executive, 2005) 2 2 20 50 2 5
USA-NIOSH (National Institute for Occupational Safety and Health, 2005)
0.016 1 2
USA-OSHA (National Institute for Occupational Safety and Health, 2005)
0.75 2 200 150 5
[image:14.595.69.535.446.624.2]Institute for Occupational Health and Safety (US) regulations for formaldehyde state a TWA of 16 ppb (National Institute for Occupational Safety and Health, 2005), which is still higher than the determined exposure at NA. This indicates that under normal circumstances the exposure of personnel to volatile aldehydes is not of concern, as they are well within health and safety limits. However, some of the repositories at the NUL did come close to a concentration of 16 ppb when considering total volatile aldehydes. It is therefore possible that in repositories with rapidly degrading paper-based materials, especially in non-ventilated ones, the concentration could exceed the TWA limit as set by NIOSH.
3.3 Exposure of Archival Materials to Volatile Aldehydes
The significantly higher content of tVOCs and acetic acid inside boxes is of concern: acetic acid has been found to cause significant reduction in the degree of polymerisation of cellulose in paper (Dupont and Tétreault, 2000). There are also reports available on the effect of volatile aldehydes, particularly formaldehyde, on heritage materials such as colourants, glass, and metals (Raychaudhuri and Brimblecombe, 2000, Williams et al., 1992, Hatchfield and Carpenter, 1986), but possibly depending on the rate of formation of formic acid rather than on the presence of formaldehyde itself. Tétreault (2003) concluded that formaldehyde is probably less of an issue as an indoor pollutant than is often assumed. Yet, studies of the effects of many volatile organic compounds on paper stability still need to be carried out, as oxidation of volatile aldehydes could occur in archival material after absorption, particularly in view of the finding that cellulose also emits H2O2 (Strlič, 2010). Formation of acids could promote acid-catalysed hydrolysis of cellulose. On the other hand, it is also possible that volatile aldehydes promote oxidation of cellulose directly as autoxidation initiators (Strlič and Kolar, 2005). Additionally, studies of multi-pollutant systems may reveal combinations of compounds exhibiting synergistic or antagonistic effects, as indoor environments could act as reaction vessels (Weschler and Shields, 1997).
4. Conclusions
The results of our study show that the concentrations of volatile aldehydes in library and archival environments are in the low ppb region. Remarkably low variation was found in the wide range of repository types, however. The most important conclusions are:
‐ The highest concentrations of volatile aldehydes were recorded in a non-ventilated repository containing newsprint material, probably due to its low stability.
are removed by atmospheric oxidation or surface absorption faster than by forced removal, which could be the reason for the observed very similar concentrations in various repositories, and in addition, very similar to those in closed boxes.
‐ An additional finding supporting the previous conclusion is that the concentration of aldehydes in boxes is similar to the environment outside the boxes, while the concentration of acids is much higher and the concentration of the monitored pollutant gases with an oxidising effect, such as NO2, is lower.
‐ Inside boxes, the concentration of tVOCs and organic acids is significantly higher than outside boxes, and can exceed the concentration of NO2 by 10 times.
‐ The concentrations to which personnel working in archives and libraries are exposed to are well below even the most stringent limits set by health and safety agencies, although the cumulative aldehyde concentration may approach the TWA limit set by NIOSH (16 ppb).
The lack of knowledge about the effect of volatile aldehydes and other VOCs in general, on library and archival materials remains a cause for concern. As yet, no guidelines have been specified for volatile aldehydes in buildings housing heritage materials (Blades et al., 2000, Martin and Blades, 1994). Further research needs to be carried out to increase our understanding of the damage caused by aldehydes on heritage materials inside libraries and archives, including potential synergistic effects with other pollutants. To this end, monitoring of volatile organic pollutants in libraries and archives should become a routine activity.
Acknowledgments
The authors gratefully acknowledge the financial support of the UK AHRC/EPSRC Science and Heritage Programme (project CDA 08/412 additionally supported by the National Archives, UK), of the Slovenian Research Agency (Programme P1-0153, and project PaperVOC additionally supported by Nationaal Archief, The Netherlands), and of St Paul’s Cathedral, where we additionally thank J. Wisdom, S. Carter and T. Heady, for their help and support. Thanks are also due to C. King, University of Strathclyde, who analysed the acetic acid diffusion tubes.
5. References
Atkinson R., 2000. Atmospheric chemistry of VOCs and NOx, Atmos Environ 34, 2063-2101.
Blades N., Oreszczyn T., Bordass B., Cassar M., 2000. Guidelines on Pollution Control in Museum Buildings, In: Martin D. (ed), Museum Practice, Museums Association, London, p. 27.
Brown S.K., 2002. Volatile organic pollutants in new and established buildings in Melbourne, Australia, Ind Air 12, 55-63.
Bruno P., Caselli M., De Gennaro G., Iacobellis S., Tutino M., 2008. Monitoring of volatile organic compounds in non-residential indoor environments, Ind Air18, 250-256. Camuffo D., Brimblecombe P., Van Grieken R., Busse H.J., Sturaro G., Valentino A.,
Bernardi A., Blades N., Shooter D., De Bock L., Gysels K., Wieser M., Kim O., 1999. Indoor air quality at the Correr Museum, Venice, Italy, Sci Tot Environ236, 135-152. Camuffo D., Van Grieken R., Busse H.J., Sturaro G., Valentino A., Bernardi A., Blades N.,
Shooter D., Gysels K., Deutsch F., Wieser M., Kim O., Ulrych U., 2001.
Environmental monitoring in four European museums, Atmos Environ35, S127-S140.
Caselli M., De Gennaro G., Saracino M.R., Tutino M., 2009. Indoor contaminants from newspapers: VOCs emissions in newspaper stands, Environ Res109, 149-157. Chan A.T., 2002. Indoor-outdoor relationships of particulate matter and nitrogen oxides under different outdoor meteorological conditions, Atmos Environ36, 1543-1551. DECOS, 2003. Formaldehyde: Health-Based Recommended Occupational Exposure Limit,
The Hague, Social Affairs and Employment.
Drakou G., Zerefos C., Ziomas I., Voyatzaki M., 1998. Measurements and numerical simulations of indoor O3 and NOx in two different cases, Atmos Environ 32, 595-610.
Dupont A.L., Egasse C., Morin A., Vasseur F., 2007. Comprehensive characterisation of cellulose- and lignocellulose-degradation products in aged papers: Capillary zone electrophoresis of low-molar mass organic acids, carbohydrates, and aromatic lignin derivatives, Carbohydr Polym68, 1-16.
Dupont A.L., Tétreault J., 2000. Cellulose degradation in an acetic acid environment, Stud Conserv45, 201-210.
Ekberg L.E., 1996. Relationships between indoor and outdoor contaminants in mechanically ventilated buildings, Ind Air 6, 41-47.
Emsley A.M., Stevens G.C., 1994. Kinetics and Mechanisms of the Low-Temperature Degradation of Cellulose, Cellulose1, 26-56.
Gair A.J., Penkett, S.A., 1995. The Effects of Wind Speed and Turbulence on the Performance of Diffusion Tube Samplers, Atmos Environ 29, 2529-2533.
Gibson L.T., Cooksey B.G., Littlejohn D., Tennent N.H., 1997. A diffusion tube sampler for the determination of acetic acid and formic acid vapours in museum cabinets, Anal Chim Acta341, 11-19.
Gibson L.T., Kerr W.J., Nordon A., Reglinski J., Robertson C., Turnbull L., Watt C.M., Cheung A., Johnstone W., 2008. On-site determination of formaldehyde: A low cost measurement device for museum environments, Anal Chim Acta 623, 109-116. Goho A., 2004. News that's fit to print - and preserve, Science News165, 24-25.
Gradko Environmental (2006) Technical Data Sheet TDS8: Volatile Organic Compounds. Retrieved from http://www.gradko.co.uk/pdf/Volatile_Organic_Compounds.pdf on 30th August 2009.
Grzywacz C.M., 2006. Monitoring for gaseous pollutants in museum environments, Los Angeles, Getty Conservation Institute.
Grzywacz C.M., Tennent N.H., 1994. Pollution Monitoring in Storage and Display Cabinets: Carbonyl Pollutant Levels in Relation to Artifact Deterioration, Proceedings of Preventive Conservation: Practice, Theory and Research, pp. 164-170. Hatchfield P.B., Carpenter J.M., 1986. The problem of Formaldehyde in Museum
Collections, Intern J Mus Manag Curator5, 183-188.
International Furan Chemicals, 2003. Furfural-Safety Data Sheet IMSDS02EN. Retrieved from http://www.furan.com/_resources/downloads/10195en_rev6.pdf on 6th August 2009.
IRCCS (2006) Radiello - The Radial Diffusive Sampler, Fondazzione Salvatore Maugeri IRCCS. Retrieved from http://www.radiello.com/english/ald_en.htm on 1st September 2009.
Kucera V., Fitz S., 1995. Direct and indirect air pollution effects on materials including cultural monuments, Water Air Soil Pollut 85, 153-165.
Lattuati-Derieux A., Bonnassies-Termes S., Lavedrine B., 2004. Identification of volatile organic compounds emitted by a naturally aged book using solid-phase
microextraction/gas chromatography/mass spectrometry, J Chromatogr A1026, 9-18.
Lattuati-Derieux A., Bonnassies-Termes S., Lavedrine B., 2006. Characterisation of compounds emitted during natural and artificial ageing of a book. Use of
headspace-solid-phase micro extraction/gas chromatography/mass spectrometry, J Cult Herit7, 123-133.
Manahan S.E., 1999. Environmental chemistry, Lewis Publishers, Boca Raton.
Martin G., Blades N., 1994. Cultural Property Environmental Monitoring, in: Proceedings of Preventive Conservation: Practice, Theory and Research, pp. 159-163.
Meyer B., Boehme C., 1997. Formaldehyde emission from solid wood, Forest Prod J47, 45-48.
Micales J.A., Skog K.E., 1997. The decomposition of forest products in landfills, Int J Biodet Biodegrad39, 145-158.
National Institute for Occupational Safety and Health, 2005. NIOSH pocket guide to
chemical hazards, U.S. Dept. of Health and Human Services, Public Health Service, Centers for Disease Control and Prevention, National Institute for Occupational Safety and Health, Cincinnati, Ohio.
Pravilnik, 2007. Pravilnik o varovanju delavcev pred tveganji zaradi izpostavljenosti kemičnim snovem pri delu, Ur.l. RS, št. 100/2001, 39/2005, 53/2007, Slovenia. Ramalho O., Dupont A.L., Egasse C., Lattuati-Derieux A., 2009. Emission Rates of Volatile
Organic Compounds from Paper, e-Preserv Sci6, 53-59.
Raychaudhuri M.R., Brimblecombe P., 2000. Formaldehyde oxidation and lead corrosion, Stud Conserv45, 226-232.
Ryhl-Svendsen M., Glastrup J., 2002. Acetic acid and formic acid concentrations in the museum environment measured by SPME-GC/MS, Atmos Environ36, 3909-3916. Salthammer T., Mentese S., Marutzky R, 2010. Formaldehyde in the Indoor Environment,
Chem Rev DOI: 10.1021/cr800399g.
Schieweck A., Lohrengel B., Siwinski N., Genning C., Salthammer T., 2005. Organic and inorganic pollutants in storage rooms of the Lower Saxony State Museum Hanover, Germany, Atmos Environ39, 6098-6108.
SKC, 2007. UMEx100 Passive Sampler for Formaldehyde Catalog No. 500-100, Vol. 2009, USA, SKC Inc. Retrieved from http://www.skcinc.com/instructions/3760.pdf on 1st September 2009.
Srivastava P.K., Pandit G.G., Sharma S., Rao A.M.M., 2000. Volatile organic compounds in indoor environments in Mumbai, India, Sci Tot Environ 255, 161-168.
Strlič M., Kralj Cigić I., Kolar J., De Bruin G., Pihlar B., 2007. Non-destructive evaluation of historical paper based on pH estimation from VOC emissions, Sensors7, 3136-3145.
Strlič M., Kolar J., 2005. Ageing and Stabilisation of Paper, National and University Library, Ljubljana.
Strlič M., Thomas J., Trafela T., Cséfalváyova L., Kralj Cigić I., Kolar J., Cassar M., 2009. Material Degradomics: on the Smell of Old Books, Anal Chem81, 8617-8622. Strlič M., Menart E., Kralj Cigić I., De Bruin G., Kolar J., Cassar M., 2010. Emission of volatiles and reactive oxygen species during degradation of iron gall ink, Polym Degrad Stab 95, 66-71.
Tétreault J., 2003. Airborne pollutants in museums, galleries and archives: risk assessment, control strategies and preservation management, Canadian Conservation Institute, Canada.
Thomson G., 1965. Air pollution: A review for Conservation Chemists, Stud Conserv10, 147-167.
Van Rooy F.G., Smit L.A., Houba R., Zaat V.A., Rooyackers J.M., Heederik D.J., 2009. A cross-sectional study of lung function and respiratory symptoms among chemical workers producing diacetyl for food flavourings, Occup Environ Med66, 105-110. Wainman T., Weschler C.J., Lioy P.J., Zhang J., 2001. Effects of Surface Type and
Relative Humidity on the Production and Concentration of Nitrous Acid in a Model Indoor Environment, Environ Sci Technol 35, 2200-2206.
Weschler C.J., Shields H.C., 1997. Potential reactions among indoor pollutants, Atmos Environ31, 3487-3495.
Williams E.L., Grosjean E., Grosjean D., 1992. Exposure of Artists' Colorants to Airborne Formaldehyde, Stud Conserv 37, 201-210.