City, University of London Institutional Repository
Citation
:
Chalashkanov, N. M., Dodd, S. J., Dissado, L. A. and Fothergill, J. (2011). Pulse
sequence analysis on PD data from electrical trees in flexible epoxy resins. 2011 Annual
Report Conference on Electrical Insulation and Dielectric Phenomena (CEIDP), pp. 776-779.
doi: 10.1109/CEIDP.2011.6232771
This is the accepted version of the paper.
This version of the publication may differ from the final published
version.
Permanent repository link:
http://openaccess.city.ac.uk/7072/
Link to published version
:
http://dx.doi.org/10.1109/CEIDP.2011.6232771
Copyright and reuse:
City Research Online aims to make research
outputs of City, University of London available to a wider audience.
Copyright and Moral Rights remain with the author(s) and/or copyright
holders. URLs from City Research Online may be freely distributed and
linked to.
Pulse Sequence Analysis on PD data from electrical
trees in flexible epoxy resins
N.M. Chalashkanov, S.J. Dodd, J.C. Fothergill, L.A. Dissado
University of Leicester Department of Engineering
Abstract- The Pulse Sequence Analysis (PSA) was carried on PD data from electrical trees grown in flexible epoxy resins. The samples used for the electrical tree experiments were conditioned in environments with different relative humidity in the range 15-100% prior to the electrical tests and the corresponding moisture content in the samples was between 0.1 and 6.9%. The electrical treeing experiments were carried out at different temperatures in the range 20-70°C. The details of PD dynamics during the electrical tree growth have been found to change significantly with temperature and absorbed moisture. In this paper, it is shown that PSA could be successfully used to discriminate between PD data from electrical trees and runaway breakdown.
I. INTRODUCTION
Electrical treeing is a long-term degradation mechanism in polymeric insulation, which is driven by partial discharge (PDs) activity and may lead to electrical failure of HV insulation systems [1].
It has been found that in epoxy resins above the glass transition temperature, i.e. when the resin is in a flexible state, increasing temperature or moisture content in the samples leads to faster tree growth and tree structures with lower fractal dimension [2]. The observed changes in the treeing mechanism were attributed to an increase in the bulk conductivity of the samples.
The Pulse Sequence Analysis (PSA) was proposed as an alternative approach to the ‘standard’ statistical analysis based on 𝝋-q-n distributions for PD-based diagnostic. In PSA, the PD events are regarded as time series where strong correlation exists between the consecutive events [3]. The basic assumption is that the electrical charges deposited by the previous discharge remain in the vicinity of the discharge site and modify the local electric field. In this way, the ignition conditions for the occurrence of a sequential discharge are affected and as a result the PDs should not be treated as independent events.
In this work, the PD data acquired from the electrical treeing experiments is analyzed using PSA. It is shown that the PSA method can be used to discriminate between the different degradation modes that may occur in a polymeric insulation and it can be used as a viable tool for PD-based diagnostics of the electrical insulation.
II. EXPERIMENTAL
The samples used for electrical treeing experiments had pin-plane geometry with distance between the pin and the pin-plane 2±0.5 mm. Tungsten carbide pins having a shank diameter of 1 mm and pin-tip radius of 3 μm were cast in CY1311 samples epoxy slabs. The samples were stored in sealed containers with a controlled relative humidity of the environment. All samples were tested electrically 10-12 weeks after their manufacturing. The electrical treeing experiments were performed at ac voltage 13.5 kV rms, 50 Hz. The PD amplitudes measured during the tree growth were in the range between 10 pC and 10 nC depending on the length of the electrical tree channels. Throughout each experiment, phase resolved partial discharge activity recorded by the storage oscilloscope was saved for a subsequent analysis. The PD data acquisition time was 1s and data acquisition was repeated every 10 seconds. Hence each partial discharge record consisted of phase and amplitude data for each individual partial discharge over a time period of one second. Concurrently with the acquisition of partial discharge data, images of the emitted light due to the partial discharges and back illuminated images of the electrical tree were recorded on regular basis. The treeing experiments were performed over the temperature range 20-70°C and the moisture content in the samples was between 0.1 and 6.9%. The treeing cell was thermally insulated with polystyrene casing so that constant temperature was maintained in the cell during the tests. Since the glass transition temperature of the resin is 0oC, all treeing experiments were performed above Tg of the resin.
III. RESULTS
[4]. Hence, the PD rates can be used to differentiate between the two modes, electrical treeing and runaway.
Table 1. Average number of discharges per second [s-1] during the entire tree growth
20oC 30oC 40oC 50oC 60oC 70oC
RH15
(0.1%) 691 1164 1821 2715 11670 16850
RH30
(0.6%) 1010 1928 3496
RH44
(1.0%) 1085 3291 18094
RH75
(2.4%) 14258
[image:3.612.43.297.214.400.2]RH100 (6.9%)
Table 2. Average discharge magnitude [pC] during the entire tree growth
20oC 30oC 40oC 50oC 60oC 70oC
RH15
(0.1%) 252 236 226 218 81 5
RH30
(0.6%) 241 182 232
RH44
(1.0%) 336 153 68
RH75
(2.4%) 98
RH100 (6.9%)
IV. DISCUSSION
The differential ratio 𝜟u/𝜟t was chosen as a characteristic parameter for the PSA analysis of the PD data. A typical PSA plot of 𝜟u/𝜟t is shown in Fig. ???. Six clusters can be identified in the scatter plot, which are arbitrary labelled with numerals 1 to 6. Clusters 1 and 4 are comprised of more data points than the others and are oriented approximately along the 45° line shown in the plots. In Fig. ???/ clusters 2 and 5 are aligned parallel to the horizontal axis. Cluster 3 and 6 appear equally distant from the 45° line shown in the Fig.???. The same number of clusters with similar orientation have been found in the case of electrical tree growth in polyethylene .
The similarity of the plots obtained from electrical trees in different materials and their consistency from one data set to another suggests that the 𝜟u/𝜟t scatter plots such as ones shown in Fig. ??? represent the basic dynamics of the PD activity as a result of electrical treeing process.
The origin of the clusters was investigated and a relationship has been found between the cluster numbers, their orientation and the phase of PD occurrence with respect to the applied ac voltage. Clusters 1 and 4 are related to the time (phase) differences between the consecutive discharges that comprise the negative or positive polarity PD distributions respectively, while clusters 2, 3, 5 and 6 occur as a result of the transition between the two distributions. The trajectory, which the consecutive differential ratios 𝜟un/𝜟tn describe, is also
illustrated in Fig. ????. In Fig. ????, the 𝝋-q-n plot of the data used to produce Fig. ??? is shown. If the first discharge occurs during the positive half cycle of the applied voltage, the consecutive discharges take place in a region where the applied voltage increases almost linearly and 𝜟un/𝜟tn is positive, since 𝜟tn is always greater than zero. Hence, the
consecutive ratios 𝜟un/𝜟tn belong to Cluster 1 until the last
discharge on the positive half-cycle takes place. The next discharge will take place either at the negative half-cycle or if a sufficiently large amount of space charge is deposited by the last positive discharge then the following negative discharge can take place even before the polarity reversal of the applied voltage, i.e. (𝝋<180°). The ratio 𝜟un/𝜟tn becomes less than
zero. Then the pair 𝜟un/𝜟tn<0, 𝜟un-1/𝜟tn-1>0 forms Cluster 2.
The following discharges occur at the negative half-cycle of the applied voltage and the ratio 𝜟un/𝜟n remains negative until
the last negative discharge takes place. Since 𝜟tn-1 (between
the last positive and the first negative discharge) is always much greater than 𝜟tn, the ratio 𝜟un-1/𝜟tn-1 is always smaller
than 𝜟un/𝜟tn and Cluster 3 is formed in this way. The
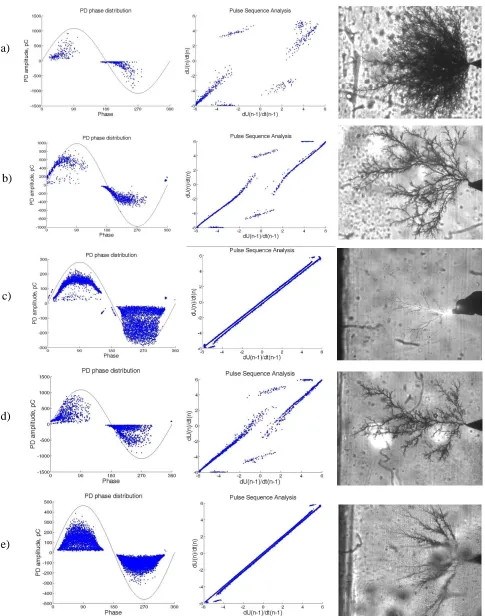
following succession of negative discharges gives rise to Cluster 4. By analogy, the formation of Clusters 5 and 6 can be explained with the transition from negative to positive PDs. Examples of PSA and 𝝋-q-n plots obtained at different levels of absorbed moisture and temperature are shown in Fig.???. The images of the final tree structures from which the PD data were recorded, are also given in Fig. ??. At low moisture and temperature levels, the PSA plots show significant scatter. An example is given in Fig.??a in the case
Fig. ???: PD pulses from electrical treeing in CY1311 epoxy resin; on the left 𝝋-q-n plot and on the right the PSA on the basis of scatter plots of 𝜟u/𝜟t (in Vs−1)
[image:3.612.57.549.560.714.2]of a sample with mass uptake 0.1% and ambient temperature 20°C. Increasing temperature and/or moisture decreased the data scatter and clusters appeared more aligned. Examples are shown in Fig.???b and d). At even higher levels of absorbed moisture and/or ambient temperature quite distinctive 𝜟u/𝜟t pattern has been obtained, which was associated with a runaway regime [4] rather than electrical treeing. Examples of PSA plots in the case of runaway are shown in Fig. ???c and e. In those cases, the breakdown of the sample occurred in less than 30 sec. The PD record for 1s acquisition contained a very high number of PDs, more than 10000 with magnitudes less than 200 pC. The resultant PSA plots are significantly different from the plots characterizing the electrical tree growth. Using the above notations, Clusters 1 and 4 appear aligned and in parallel with the 45° line, the remaining clusters are significantly smaller and with less scatter than.
The 𝝋-q-n plots also show change with increasing temperature and moisture. The phase windows in which PDs take place shift and at high temperature and/or moisture the PDs occur in phase with the applied voltage. Another important difference is the occurrence of discharges after the positive and negative peaks of the applied voltage.
It has been found in [5, 6] that in the case of high temperatures and/or moisture content in the samples, the effective bulk conductivity of the epoxy resins increases significantly. Thus, the charge deposited by the PD activity can be effectively removed by the increased bulk conductivity leading to an electric field enhancement farther away from the tree tips inside the material. Thus, the negative feedback due to the deposited space charge is eliminated and the electrical tree growth is favored in the pin-plane direction, resulting in faster growing trees with smaller fractal dimension. This is reflected in the phase resolved partial discharge measurements with PDs occurring after the voltage peaks and the number of discharges becomes greater as the deposited space charge decays away within a small fraction of one half cycle of the applied voltage. Increased conductivity of the material also has an impact on the observed PSA. Increasing conductivity causes the sequence of PDs to become more coherent with time. The increasing bulk conductivity of the material therefore increases the causal dependence of the time and voltage of occurrence of successive partial discharge as indicated by the reduced scatter of the six clusters.
IV. CONCLUISIONS
A relationship between the 𝝋-q-n and PSA plots has been demonstrated. The PSA method can be used to differentiate between the different degradation modes (electrical treeing and runaway). The 𝜟u/𝜟t plots present a good visualization technique and can be used for PD-based diagnostics of the electrical insulation. An advantage of the PSA representation is the fact that information about the PD magnitudes is not required in the data analysis, while the information about the degradation mode is preserved.
REFERENCES
[1] L. A. Dissado and J. C. Fothergill, Electrical Degradation and Breakdown in Polymers: Peter Peregrinus Ltd., 1992.
[2] N. M. Chalashkanov, S. J. Dodd, J. C. Fothergill, and L. A. Dissado, "On the Relationship between Bulk Charge Transport and Electrical Breakdown Mechanisms in Epoxy Resins," in Nord-IS 11
Tampere, 2011.
[3] M. Hoof and R. Patsch, "Pulse-Sequence Analysis: a new method for investigating the physics of PD-induced ageing," IEE Proc. - Sci. Meas. Technol.,
vol. 142, pp. 95-101, 1995.
[4] L. A. Dissado, S. J. Dodd, J. V. Champion, P. I. Williams, and J. M. Alison, "Propagation of Electrical Tree Structures in Solid Polymeric Insulation," IEEE Trans. Dielectrics and Electrical Insulation, vol. 4, pp. 259-279, 17.12.07 1997. [5] S. J. Dodd, N. M. Chalashkanov, L. A. Dissado, and
J. C. Fothergill, "Influence of Absorbed Moisture on the Dielectric Properties of Epoxy Resins," in 2010 CEIDP West Lafayette, Indiana, USA, 2010.
Fig.? PD patterns from electrical treeing experiments, on the left 𝝋-q-n plots, middle PSA plots and on the right images of the final tree structure, data acquisition period 1s: a)mass uptake 0.1%, temperature 20oC; b)mass uptake 1.0%, temperature 20oC; c) mass uptake 2.4%, temperature 20oC; d)
mass uptake 0.1%, temperature 40oC; e) mass uptake 0.1%, temperature 60oC
![Table 1. Average number of discharges per second [s -1] during the entire tree growth](https://thumb-us.123doks.com/thumbv2/123dok_us/1588285.111529/3.612.43.298.92.238/table-average-number-discharges-second-entire-tree-growth.webp)