DOI: http://dx.doi.org/10.26483/ijarcs.v8i7.4255
Volume 8, No. 7, July – August 2017
International Journal of Advanced Research in Computer Science
RESEARCH PAPER
Available Online at www.ijarcs.info
ISSN No. 0976-5697
ISSN No. 0976-5697
A RESEARCH REVIEW ON COMPARATIVE ANALYSIS OF DATA MINING
TOOLS, TECHNIQUES AND PARAMETERS
Dr. Anil Sharma
Department of Computer Science and Applications, LPU,Phagwara 144411, Punjab
Balrajpreet Kaur
Department of Computer Science and Applications, LPU, Phagwara 144411, Punjab;
Abstract: Data mining is a process of exploring unexplored patterns from huge databases. This acts as a key to knowledge discovery which provides a great support to business world and academia. To make this knowledge discovery happening various data mining tools are developed. These tools provide interface to get data and to retrieve some interesting patterns out of it which are further useful to attain new knowledge. There are variety of parameters defined in the literature which provide base for a tool to perform analysis and different tools are available to perform these analysis. This is quite interesting to perform a comparative analysis of these tools and to observe their behavior based on some selected parameters which will further be helpful to find the most appropriate tool for the given data set and the parameters. In this paper authors did experiment with two different datasets on WEKA tool based on six parameters which illustrate disparity in the value with the type of dataset namely balanced and unbalanced.
Keywords: Data mining; Data Mining Tools; Knowledge Discovery; WEKA; KNIME; Rapid Miner.
1. INTRODUCTION
Data mining is the process of finding patterns from large amount of data by applying some techniques. This is used as an analyzer for knowledge discovery in databases to be used in decision making process. Big organizations use it primarily for finding new ways to increase their profits and to minimize cost. Data mining analyze the data and helps to bring up the hidden factors so that useful patterns and information can be generated. As an instance, business organizations can analyze the customer's behaviour toward specific product by analyzing the historical data and this helps the organization to find the changing behaviour of the customer with the passage of time, like, to find the trends in change, to find the volume of change etc. These kinds of findings is definitely help any organization to take future decisions in relation to that product [1][2]. Data mining
tools are the software which provide automatic
implementation of data mining techniques on the data and provides user interface to apply machine learning algorithms [2]. These tools can handle huge amount of data and provide relevant results efficiently. Various tools are discovered with different parameters according to meet the different types of requirements. The handling of data, user interface, missing values, finding error rate and many more parameters make these tools different from each other. These parameters can be increased or decreased according to the need of user. These tools are having features of handling complex as well as unstructured data [3]. Companies bought data mining tool to build their own customize mining solutions. Many Data Mining tools are available with their strengths and limitations in context to parameters like interfaces, algorithms, accuracy of results, mining techniques, data set size etc. These tools are
further categorized into three categories i.e. Dashboards ,Traditional data mining tools and Text Mining tools.
Traditional data mining tools mostly used by companies for business analytics purpose. These tools work on databases available with the company. There tools apply pre-defined algorithms on data for finding the invisible pattern and results. These tools provide broad data categories to generate readable reports. As an instance, a database of sales can display monthly sales results and reports with the help of traditional data mining tools. These tools are accessible both in Windows and Unix versions of operating systems and are mainly used for Online Analytical Processing (OLAP)[4]. Some of these tools are WEKA , R studio, Rapid Miner, SQL and D2K [5]. Dashboards are installed on computer to monitor database information and reflects the
updates and changes onscreen regarding business
handle structured and unstructured data. There are some text mining tools which are open sourced like orange[11], NLTK[12], Voyant[13] and ALchemy API[14]. IBM company build smarter Apps with ALchemy language[15] for semantic text mining[16] using Natural Language Processing[17]. This application help company to understand worlds conversation, reports and photos. These tools are progressively adding new features to satisfy the fast changing requirements of the user and to handle the data complexity in a better way. It is quite difficult to add all the features in one tool so there are different categories of tools introduced [2][18].
2. DATA MINING TECHNIQUES
There are many techniques of data mining like classification, regression, clustering, summarization which have their own characteristics and limitations. Classification[2] classifies data into different classes. There are many classification algorithms such as Decision tree [19], Naive Bayes[20], Generalized linear Model [21] and Support Vector Machine[22]. The classification is performed mainly on the basis of parameters i.e. accuracy and confusion matrix [23][24]. This technique provide various applications in the field of customer interest, social network, medical and health care and many more [25]. Regression[26] is used to map the relationship between two variables. This is also represented in the map form and can be used to check the result by comparing the distance of data points from regression line[2]. Profit, square footage, temperature, sales and distance are predicted through regression. There are two formula's used for regression statistics i.e. Root Mean Square Error(RMSE) and Mean Absolute Error [26][27]. In Clustering[2], another data mining technique; one performs the distribution of data based on different categories. This technique provides the homogeneous data from huge amount of data. There are different methods used in clustering such as partitioning method, hierarchical method, density based method, grid based method, model based method and constraint based method [28]. There are various applications of clustering in the field of marketing, biology, fraud detection, similar land identification[3]. In Summarization[2] one can make a compact description of any data. Summarization is done in the form of table. The summarization provides the relationship between different type of data sets[29]. There are two approaches for automatic summarization i.e. extraction and abstraction. Extraction method work on existing words, phrases or sentences in the original text to form the summary. Abstractive method use natural language generation techniques [30][31].
3. PARAMETERS
Parameters provide information regarding the evaluation of techniques and tools. In data mining to examine the output we need parameters. Its value provide information regarding decision making[32]. The performance evaluation in data mining tools is done by different parameters. It provide information about how the input vary and also provide accuracy about the results[33]. There are so many parameters used for testing but optimal parameter provide accuracy regarding mining patterns. Some common
parameters used for comparison are developer, programming language, portability, interface, platform, visualization, accuracy and time taken [34].The values of these parameters are taken manually.
There are some unique parameters in all data mining tools. For example, WEKA containing parameters for evaluation i.e. correctly classified instances, incorrectly classified instances, kappa statistics, mean absolute error, root mean squared error, relative absolute error, root relative squared error[35]. The correctly classified instances provide information regarding the accuracy in classification of classes. The F-measure combines precision and recall mean. The accuracy addresses the quality or state of being correct or correct value of calculation. Kappa statistics provide measurement regarding multiclass and imbalanced class. It tells how your classifier perform with the input. Mean absolute error measures the accuracy for continuous variables. Root Mean squared error measures the average magnitude of error[36]. The Orange tool uses parameters for evaluation such as test and score. Test score provide accuracy estimation through cross validation. Second predictions which display predictions of models for an input dataset. Third confusion matrix which provide information regarding classifier evaluation. Fourth , ROC analysis which display the receiver operating characteristics curve based on the evaluation of classifier. Fifth, lift curve which construct and display the curve from the evaluation of classifier[37]. The MATLAB tool uses parameters for evaluation such as accuracy, execution time and observation speed. The observation speed is a unique parameter for evaluation[34]. The Rapid Miner tool used parameters such as accuracy , precision, Recall, AUC(Optimistic), AUC(neutral). The rapid miner also contain performance vector for calculating the performance values[40]. The KEEL tools have unique features off/on line run of experiment setup which is new in data mining tools. Some other unique parameters are sequence or path analysis and error rate[42].
4. RELATED WORK
process. The functions include data preparation and mining association rules included negative items. The author also gives example of application of AR Miner. Author further emphasized that patterns can be generated from the negative items also. In [41], the author give introduction about rough set theory. The rough set theory is used for extracting decision rules from data sets. The author gives the example of rough set theory. In the example author taken four features and according to the if-else rules various results are drawn. In [42], the author introduces the evolutionary methods and tools for classification of data i.e. KEEL tool which is developed in java language. It provide good interface to the user. It consist of new analysis model and better than other tools. In [43], the author explains three concepts in the paper. First, it shows the comparative study of data mining tools. Second, it explains about different challenges in data mining tool. Third, it explains the advantage of agent with data mining tools. The comparative study is based on portioning of dataset, scaling, selection, parameter optimization of machine type learning .the agent provide intelligence in the system. Different type of agents are coordinate agent, clean agent, Reduction agent and transformation agent. These agents help in overcome the challenges.
In [44], the author explains Tanagra, is a tool used for different operations and it is used for diagram making. Tanagra is better in overcome the error rate. Tanagra is good classifier and can handle vast amount of data. In [45], the author give information regarding Data mining tools for doing data mining process and finding new patterns. The SPSS tool is used for finding regression and correlation. The author categorize the tool into nine types based on the suites, business intelligence packages, mathematical packages, integration packages and other libraries and solutions. In [46], the author take 3 tools i.e. WEKA, Tanagra and Clementine. The author test four healthcare Dataset on these tools. In the result the author took two parameters : accuracy rate and error rate. Different techniques are applied on dataset to get the accurate rate and error rate percentage. In other paper [47], the comparison of data mining tools is based on nine different types of data. The author used six algorithms for classification such as Naïve Bayes, support vector machine, zero rule, one rule and decision tree. The test conducted results that all the tools are good . The performance of the tool is decrease and increase on the basis of datasets we are using. The WEKA tool is better in classification as compared to other tools. The other comparison is done in[48], the author used two data mining tools i.e. Tanagra and WEKA. The dataset consist of 100 patients from research centre. The aim of data mining is to find out the relationship between diabetic patient and kidney failure. Both the tools are used as classifier and C4.5 algorithm is used for making decision tree. From the result it is found that the error rate of Tanagra is 11% and WEKA error rate is 25%. From above papers the comparison result show that WEKA tool is better than other tools in the field of classification technique. The time taken by WEKA is less as compared to other tools but error rate is little high than Tanagra. In[49],the author check the accuracy about complaint detection task. The authors take three data set in which they had so many complaint review and non-complaint reviews. The author chooses five algorithm for test, one rule, conjunctive rule ,ridor, RIPPER and PART.
The performance measurements are taken on the basis of accuracy values. In the result, the 75% accuracy is there as compared to other algorithms. The process also contain the removal of unigrams. In [50], the author introduces four parameters for calculating the performance of data mining tools. Performance factors include computational performance, functionality, usability and ancillary task support. These all factors performance depends upon the quality of data. Computational performance indicates the tool ability to handle data in varieties. Functionality describes how to solve different types of data mining problems. Usability indicate how tool is used by user in efficient way with functions. Ancillary task support provides functions like data cleaning, transformation, visualization and other task. The author gives the result table in which they show the ANOVA test. In [51] the comparison is based on another two criteria between the five data mining tools The result analysis is based on two criteria i.e. first the user evaluation analysis and second is the technical evaluation analysis. Different types of parameters are considered for getting results. There are some participants invited for fulfil the evaluation criteria. The participants give the rating from 0 to 10 to find the comparative result between these tools. In results the author mentioned that the R studio is fail to impress the participants while the other tool give better results. KNIME and Rapid Miner get better score than other tools. Weka tool is lacking the interface and feel outdated. Each tool have their advantages and disadvantages the score criteria shows how much people feel comfortable with these tools. These two papers show the comparison based on user review as well as the working of tool.
visualizing the classification. In [55] the author gives the comparison result of three data mining tools and a new framework DMPML(Data Mining Preparation Markup Language). The DMPML can stores directives and codified data in an XML document. The result is based on two parameters the creating of directed graphs and time processing in output of data. The DMPML spend less time in creating directed graph as compared to three data mining tools but it take more time in processing the output data as XML document. The DMPML requires less user interaction as compared to other data mining tools. The results of this paper gives appropriate difference between these tools and DMPML framework. In [56] the author compare three tools WEKA, Rapid Miner and KNIME on the basis of parameters i.e. developer, programming language, released date, license , availability , current version, areas , usability, compatibility with database, platform supporting , flexibility , visualization and GUI. In [57] the author used different dataset and check the performance of K-means data clustering and Naive Bayes data classification method. The author use attribute selection technique for the improvement in accuracy by 3.49% and 2%. The parameters taken for checking the results are time, accuracy , precision and recall. The author shows the graph which give the accuracy and many others results value with improvements. For further application the analysis is on the basis of medical dataset and communication dataset[58][59]. In [58] the author take patient dataset for checking the best classification method for medical decisions. The author use WEKA tool for classification results. There are 10 classifier used for comparing the results . The author had taken 8 parameters for comparing the classification results. The parameters are TPrate, FPrate, precision, recall , F-measure, ROC area and time taken . After comparison Bayes Net give the best classification results with TPrate and other parameters. In [59] the author take 2 tools KNIME and Rapid Miner and check their accuracy based on some experimental model. The author provide KNIME tool workflows and results in the form of Pareto chart and bar charts. The experiment design is to evaluate the data mining tool based on both quantitative and qualitative approaches . The author also analyzed tool on the basis of workload size.
5. EXPERIMENTAL WORK
In experiment analysis two dataset was used. One is Iris[60] and other is unbalanced[61] dataset. Iris dataset consist of three different types of irises i.e. setosa, versicolor and virginica petal and sepal length. Iris set is a multivariate dataset. Second is unbalanced dataset is a dataset which contain one classes values in majority and other in minority. WEKA results with Iris dataset
Table1: Result of WEKA
Algorithms Naive
Bayes
SMO Classification
Tree
Correctly classified
96% 96% 96%
Incorrectly classified
4% 4% 4%
Kappa Statistic
0.94 0.94 0.94
Mean absolute error
0.286 0.288 0.035
Root Mean Squared error
0.1386 0.1486 0.1586
Relative 6.4429% 52% 7.8705
absolute error Root relative squared
29.406% 61.101% 33.6353%
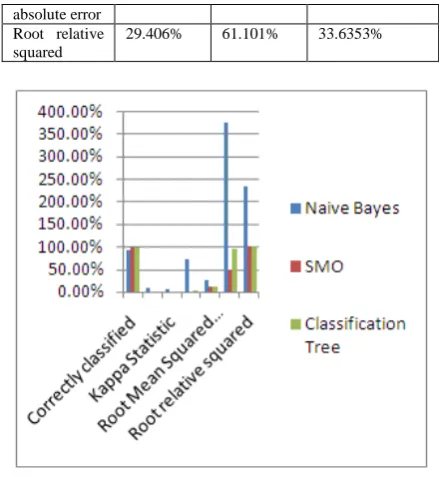
Figure 1: Graphical representation of Table 1
[image:4.595.327.547.52.291.2] [image:4.595.330.544.374.602.2]The table shows the result of classification on different parameters. The accuracy of three algorithms on iris dataset is same that means all three provide good result. The graph shows naive high result in root mean squared error and root relative squared.
Table 2: Result of WEKA with Unbalanced dataset
Algorithms Naive
Bayes
SMO Classification
Tree
Correctly classified
90.771% 98.5981% 98.59%
Incorrectly classified
9.229% 1.4019% 1.41%
Kappa Statistic
0.0695 0 0
Mean absolute error
0.7083 0.014 0.0276
Root Mean Squared error
0.2724 0.1184 0.1176
Relative absolute error
375.1873% 48.5564% 95.7636%
Root relative squared
231.6779% 100.6843% 99.9943%
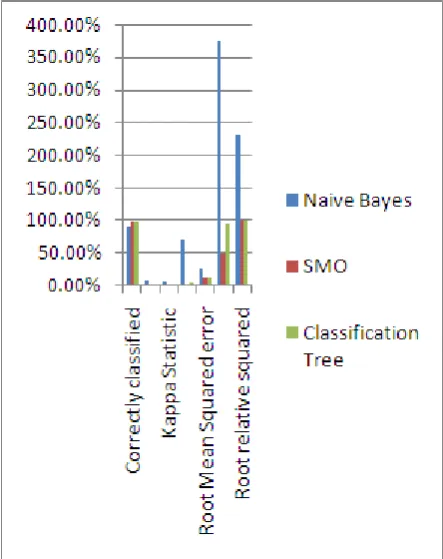
Figure 2: Graphical representation of Table 2
[image:5.595.63.256.430.750.2]The above graph shows Naive Bayes provide high result in root mean squared error and root relative squared but less accuracy. The naive Bayes algorithm provide good result in balanced dataset and its accuracy become less in unbalanced dataset. The SMO and classification provide better result in unbalanced dataset as well as iris dataset.
Figure 3: Concluded result
The above graph show the concluded result . There are three parameters which show huge difference in values i.e., Kappa statistic, Relative absolute error and root relative squared. The type of data effects the value of parameters in the efficiency. The naive Bayes accuracy value get decreased with unbalanced dataset . this show that this algorithm is not good for unbalanced dataset as compared to classification tree and SMO.
6. CONCLUSION AND FUTURE WORK
Authors conclude this research paper with some findings which can be used as a reference to direct future research and analysis.
S.No Findings
1. More emphasis is given to the manual comparison of data mining tools and there is hardly any literature found which focuses on the testing comparison. 2. New algorithm implementation is needed with rule
mining to make better decision making tree.
3. Rough set theory of classification technique with fuzzy set can give better results in rule structuring algorithm. 4. The evolutionary algorithm with heuristic techniques
such as simulated annealing and tabu search can provide better results in classification.
5. The three main algorithms (KNN, Naive Bayes and decision tree) take approximate the same amount of time with defined set of parameters such as correctly classified, TP rate, FP rate and F-measure. There is a scope to check the efficiency of these algorithms by taking new parameters which will help to find better algorithm for data mining technique.
6. Continuous update and improvement is required in data mining tools due to rapid change in the variety and volume of data. More parameters should be included to compare data mining tools in context to performance, functionality and usability.
7. Feature selection method of WEKA tool which is used to filter attributes can be further enhanced by adding more filtering parameters to get better results in classifier.
8. There is a lack of powerful and generalized data mining tools for multidimensional dataset such as images and videos as there is no literature available on the same.
9. There are various tools comparison with various datasets but there is issue regarding the compatibility of dataset with tools so there is need to find the effect of dataset on tools are required to test as future work. 10. There is a need to improve error rate in WEKA and
classifier improvement in TANAGRA. The WEKA give 25% error rate and TANAGRA take more time for classification [47].
REFERENCES
[1] H. Jiawei , M. Kamber, J. Pei, Data mining concepts and techniques, 3rd ed., Morgan Kaufmann Elsevier: USA , 2012. [2] I. H.Witten, E. Frank, M. A.Hall, Data Mining practiced
machine learning tools and techniques, 3rd ed., Morgan Kaufmann Elsevier: USA,2011.
[3] 12 data mining tools and techniques [Online]. Available: https://www.invensis.net/blog/data-processing/12-data-mining-tools-techniques [ Cited 2015 November 18].
[4] OLAP Tools (Online Analytical Processing)[Online]. Available :http://www.informationbuilders.com/olap-online-analytical-processing-tools
[6] Defining dashboards, visual analysis tools and other data presentation media[Online]. Available from:http://www.dashboardinsight.com/articles/digital-dashboards/fundamentals/what-is-a-dashboard.aspx .[Cited 2011 November 28].
[7] from:
http://enterprise-dashboard.com
[8] Building and Using Dashboards[Online].Available from: https://docs.oracle.com/cd/E28280_01/bi.1111/e10544/dashb oards.htm#BIEUG682
[9] What is Apache Mahout[Online]. Available from: https://mahout.apache.org/
[10] Teacher Dashboard[Online].Available from: http://www.teacherdashboard365.com/
[11] Orange: Data mining Fruitful and Fun[Online].Available from: http://orange.biolab.si/
[12] Natural language Toolkit[Online].Available from: http://www.nltk.org/
[13] Voyant [Online] . Available from: http://voyant-tools.org/ [14] Alchemy API Tools[Online].Available from:
http://www.alchemyapi.com/developers/tools
[15] Alchemy Language[Online].Available from:
https://www.ibm.com/watson/developercloud/alchemy-language.html
[16] A. Stavrianou, P. Andritsos, N. Nicoloyannis, Overview and Semantic Issues of Text Mining, SIGMOD Record.2007 September
[17] Introduction to Natural Language Processing[Online] Available from:http://blog.algorithmia.com/introduction-natural-language-processing-nlp.[Cited 2016 August 11]. [18] Predictive Analytics [Online].Available
from:http://www.predictiveanalyticstoday.com/top-software-for-text-analysis-text-mining-text-analytics/
[19] Decision Tree[Online].Available from: https://www.mindtools.com/dectree.html
[20] 6 easy steps to learn Naive Bayes Algorithm[Online].Available from: https://www.analyticsvidhya.com/blog/2015/09/naive-bayes-explained/
[21] D. Kroese , J. Chan, "Generalized Linear Models," Springer,2013.
[22] P. Lad, A. Somani, K.E. Krishnan, A. Gupta and V. Kartik," High-Throughput Shape Classificatio n Using Support Vector Machine," IEEE.2016.
[23] Confusion Matrix[Online].Available from: http://www2.cs.uregina.ca/~dbd/cs831/notes/confusion_matr
ix/confusion_matrix.html
[24] R. Kumar and R.Verma ,"Classification Algorithm for data mining :A survey,"IJIET,2012.
[25] G.Keseavaraj, S.Sukumaran,"Study on classification techniques on data mining," 4th ICCCNT ,IEEE, 2013. [26] M.Rathi,"Regression modeling technique o data mining for
prediction," ICT ,Springer,2010.
[27] S.Gupta,"A regression modeling technique on data mining. International journal of computer Application",2015 April. [28] D.Singh and A.Gosain ,"A comparative analysis of
distributed clustering Algorithm : A survey," International symposium on computational Business Intelligence, IEEE,2013.
[29] M. Hu and B.Liu,"Mining and summarizing customer reviews," KDD-04 tenth ACM SIGKDD International conference on knowledge discovery and data mining,ACM,2004.
[30] Top 10 challenging problems in Data
mining[Online].Available from:
http://www.dataminingblog.com/top-10-challenging-problems-in-data-mining/
[31] A.Kumar, AK. Tyagi and SK. Tyagi,"Data mining: Various issues and challenges for future," IJETA,2014
[32] H.Nasereddin," NEW TECHNIQUE TO DEAL WITH DYNAMIC DATA MINING IN THE DATABASE," IJRRAS,.December 2012.
[33] DK. Singh, V.Swaroop,"Data Security and Privacy in Data Mining: Research Issues & Preparation. International Journal of Computer Trends and Technology,"2013.
[34]Shuang, Cong. "the Neural Network Theory and Application by Matlab Tool Box [M]." Hefei: Publishing Company of University of Science and Technology of China .
[35] M.Hall, E.Frank , G.Holmes, B.Reutemann , IH Witten,"The WEKA Data Mining Software: An Update," SIGKDD Explorations,2009.
[36] https://weka.wikispaces.com/Optimizing+parameters [37] J.Demšar and B.Zupan,"Orange: Data Mining Fruitful and
Fun - A Historical Perspective",2012
[38] M.Berthold, N.Cebron, F.Dill, T.Gabriel, T.Kotter, T.Meinl, P.Ohl, C.Sieb, K.Thiel and B.Wiswedel,"KNIME: The Konstanz Information Miner,"Springer,2008.
[39] E.Loper and S.Bird ,"NLTK: The Natural Language Toolkit,"2002.
[40] Z.Haofeng,"RapidMiner: A Data Mining Tool Based on Association Rules," Springer,2001.
[41] A.Kusiak,"Rough set theory: A data mining tool for semiconductor manufacturing," JANUARY,2001.
[42] J.Alcalá-Fdez,"KEEL: a software tool to assess evolutionary algorithms for data mining problems,"Springer,2008.
[43] S.Christa,
Data Mining Tools in Agent Based Systems,"2010.
[44] G.Smith , J.Whitehead, M.Mateas,"Tanagra: A Mixed-Initiative Level Design Tool,"ACM, 2010
[45] R.Mikut and M.Reischl,"Data mining tools. Research gate,"2011.
[46] Shelly,"Performance Analysis of various data mining classification Technique on healthcare data,"2011.
[47] A.Wahbeh.,"A Comparison Study between Data Mining Tools over some Classification Methods," International Journal of Artificial Intelligence,2012
[48] D.Jain,"A Comparison of Data Mining Tools using the implementation of C4.5 Algorithm ,"International Journal of Science and Research Vol3,2014.
[49] Salma ,"Rule based complaint detection using Rapid Miner," RCOMM; 2013,Volume: 141 - 149,2013.
[50] R.Arun and J.Tamilselvi,"Data Quality and the Performance of the Data Mining Tool",2015.
[51] H
IEEE,2015.
[52] C.Shah, A.Jivani,"Comparison of data mining classification algorithms for breast cancer prediction,"4th ICCCNT ,IEEE,2013.
[53] P.Kakkar, A.Parashar," Comparison of different clustering Algorithm using WEKA tool," International Journal of Advanced Research in Technology, Engineering and Science, 2014.
[54] S.Bavisi, Ȧ.J and L.Lopes,"A Comparative Study of Different Data Mining Algorithms,"International Journal of Current Engineering and Technology,2014
[55] P.Gonc ¸ Jr. A, R.Barros and D.Vieira," On the use of data mining tools for Data preparation in classification problems," ACIS 11th International Conference on computer and information science ,IEEE ,2012.
[56] N.Chauhan and N.Gautam," Parametric comparison of data mining tools," IJATES,2015.
[58] M.Hassan , ME.Shahab , EMR.Hamed.,"A comparative study of classification algorithm in E-health Environment," IEEE.2016.
[59] S.Singh, Y.Liu, W.Ding and Z.Li,"Evaluation of data mining tools for Telecommunication Monitoring Data using design of experiment," IEEE ,2016.
[60] Information of dataset[Online].Available from https://archive.ics.uci.edu/ml/datasets/iris