International Journal of Innovative Technology and Exploring Engineering (IJITEE) ISSN: 2278-3075, Volume-8, Issue-9S, July 2019
Abstract: Iris trait has gained the attention of many researchers recently as it consists of unique and highly random patterns. Many methods have been proposed for feature extraction and classification for iris trait but suffer from poor generalization ability. In this paper, a scratch convolutional neural network is designed in order to extract the iris features and softmax classifier is used for multiclass classification. The various optimization techniques with backpropagation algorithm are used for weight updating. The results show that the Convolutional Neural Network based feature extraction has proven to provide good generalization ability with improved recognition rate. The effect of various optimization techniques for generalization ability is also observed. The method is tested on IITD and CASIA-Iris-V3 database. The recognition rates obtained are comparable with state of art methods.
Index Terms: Bio-metric, Deep Learning, Iris Recognition,
Softmax Classifier, Adam, SGD with Moment, RMSprop, Convolutional Neural Network.
I. INTRODUCTION
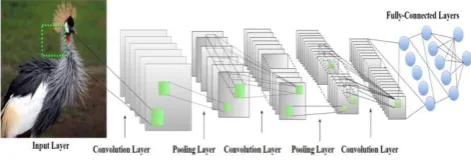
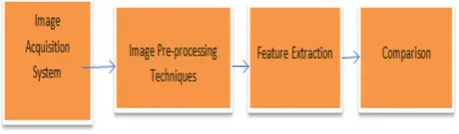
Recently there is huge demand for national security, personal information and online data gives opportunity to focus more on biometric identification systems. The biometric features include iris, palm, fingerprint and face etc. Iris is located between pupil and sclera[1]. Iris identification is required in real time environment such as banking, airport etc. The high speed equipment’s are requiring for real time execution [2]. Iris recognition system can been deployed in application areas, border control, banking, national ID cards, expedition of passengers from custom, restricted access, missing child identification, and welfare distribution. Iris is protected part of body placed between pupil and sclera and also contains discriminative parts such as rings, furrows, freckles, crypts, coronas etc. The rich details are known as texture and it is unique to each person. This trait remains stable during life time of user [3]. The iris recognition system is hygienic as any physical contact with system is not necessary for identification or authentication purpose. The steps followed in Iris recognition system are image acquisition, pre-processing, feature extraction and comparison as shown in fig 1.The feature extraction method is very important part of any biometric identification system. The feature extraction methods can be hand crafted or automatic. The pre-processing
Revised Manuscript Received on June 15, 2019.
Gajanan Choudhari, ECE Department, NITTTR Chandigarh, India. Dr. Rajesh Mehra, ECE Department, NITTTR Chandigarh, India.
[image:1.595.312.542.312.379.2]methods have significant effect on overall iris recognition system performance. This involves the localization and normalization of iris part. The image can be acquired under different environmental or lightning conditions. The image quality can be affected by the type of camera used, resolution of camera, and noise added during image acquisition. The system has to overcome any effect if there is any head shake or tilt while image acquisition. The comparison part involves the matching of images captured with stored templates. The template matching can done with simple Hamming distance or Euclidean distance
Fig. 1. Steps in Iris Recognisation System
Various methods have been proposed in implementation of Iris recognition system. In early 1990, Daugman [4], [5] used 2D Gabor filter to extract iris feature and Hamming Distance is used for matching i.e recognition. Further variants of Gabor filter and wavelet transforms are used to extract the features. However recently many methods have been suggested for feature extraction such as texture code matrix [6] ,Discrete Wavelet transform [7], scattering Transform[8] , SIFT[9] and DCT [10] for feature extraction. However these methods provide good recognition rate but suffers from poor generalization ability. More over these methods do not provide good intra-class and inter-class variation. Hence significantly variable recognition rates on various databases. So there is need to design a system which will improve the generalization ability of system. Apart from these the system should be made universal so that irrespective of color of iris and size of iris, the system produces reliable outputs in order to make system universal. The CNN makes the automatic feature extraction independent on domain knowledge. The pre-trained models have shown some improved generalization ability with good recognition rate. Now in order to further improve the generalization ability, a scratch CNN is designed for given input image size and then CNN is trained with augmented data generated after pre-processing. The CNN architecture is dependent on input image size. Keeping input image size small reduces the computational burden on CNN. The training is done with 3 different optimizations techniques such as Adaptive moment estimation (Adam), root
mean square propagation (RMSprop) and stochastic gradient descent with
Iris Recognition using Convolutional Neural
Network Design
Fig. 2. Iris Localisation [10]
Fig. 3. Daugman Rubber sheet Model
moment (sgdm) optimizer. A comparison is made in order to find out the good generalization ability of optimizer. A rank level fusion or feature level fusion can be employed on right and left iris in order to make system multi-modal. The fusion techniques improve the confidence level of identification.
The remaining contents are organized as follows. Section II describes the pre-processing done on iris images i.e iris localization and normalization. Section III gives the scratch CNN design for feature extraction with softmax classifier for multiclass classification. Section IV summarizes the results with different optimization technique and generalization ability of optimizer. Conclusion drawn based on results and observations are given in section V.
I. PRE-PROCESSING
Pre-processing is done to get the iris part out original image. Initially iris localization and normalization technique is used to get the rectangular size of iris image. This method plays important role in overall performance of system. Then data augmentation technique is used to artificially enlarge the data set. The large stat set will help to learn all the features which are representative of the patterns in iris images. The details of methods used are given as follows.
A. Iris Localization and Normalization
The iris recognition systems reliability mainly depends on precise localization of iris. The localization accuracy affects the overall system performance. The efficient and fast localization algorithm is used for Iris location. This algorithm is described as in [11]. In this method, a reflection mask is created out of specular reflection spot detection. An image enhancement is done using 2D Gaussian and Histogram equalization to reduce computational complexity of Circular Hough Transform. This also helps to smooth the image and increase contrast between sclera and iris region. The lighting condition during image acquisition affects the iris regions texture quality. Finally fast and accurate eyelid detection algorithm is used to detect the lower and upper eyelid. These algorithms uses the anisotropic transform with Radon transform to the eyelids as straight lines as shown in fig. 2
After localization method, image normalization is done to get the images of required size. The advantage of normalization is to remove any dimensional inconsistencies caused by pupil dilation in different lightning conditions while image acquisition. To address this problem Daugman rubber sheet model used to transform the images from Cartesian co-ordinate system to polar co-ordinate system as shown in figure 3. The mapping of pixels is done from normalized images (p, q) to non-centric (r,θ) where r interval in [0,1]. The conversion is mathematically given by,
I(x(r,θ),y(r,θ))→I(r,θ)
x(r,θ)=(1-r) xP(θ) rxl(θ)
y (r,θ) = (1 - r) yP(θ) ryl(θ) (2)
B. Data Augmentation
The data augmentation is done to enlarge the iris database artificially. Here after localization and normalization, the rectangular iris image is converted initially to square image. Here author have chosen the image size of 64X64 to be given input to CNN. The patches of size 64X64 are cropped from four corners and one central region of original image. Then the original square image is horizontally flipped and same procedure is repeated. Total 10 images are created out of single iris image. The same procedure is repeated for left and right eye for both databases for all subjects. The augmented data is as provided by author Ala.S. Waisy [12].
C. Data Set
For testing two iris databases are used namely IITD and CASIA-Iris-V3. While capturing the iris image, both data sets uses different type of camera. Hence this database is suitable for checking of generalization ability for our work. The IITD data base consists of 5 left and 5 right iris images of total 224 subjects. In case of CASIA-Iris-V3, 7 left and 7 right iris images are available for 120
International Journal of Innovative Technology and Exploring Engineering (IJITEE) ISSN: 2278-3075, Volume-8, Issue-9S, July 2019
[image:3.595.45.296.96.212.2]CASIA-Iris-V3 data set. The formats of images are different for each database. The more details are as shown in details as shown in table 1.
TABLE I. IRIS DATA SET
Database IITD CASIA-Iris-V3
No. of persons 224 120
No. of Images 2240 1680
Samples 5 left and 5 right 5 left and 5 right
Size 320X280 320X240
Format BMP JPEG
Camera JIRIS,JPC1000 and
digital CMOS camera
Self-developed close up camera
II. OVERVIEW OF CNN
[image:3.595.56.292.381.461.2]To process images and videos, the family of multi-layer neural networks designed is named as Convolutional Neural Network. A small portion image is given as input to CNN the lowest layer which computes feature map. This layer followed by sub sampling layer to reduce the feature dimensionality and provide robustness to spatial variance. Then this feature map passes though activation functions which adds non-linearity [13]. The graphical illustration of CNN is as shown in Figure 4.
Fig. 4. CNN architecture with layered connection
Fig. 5. The details of each layer used for design of CNN architecture is as
given below.
A. Convolutional Layer
This layer generates activation map or feature map using set of learnable kernels. The learnable kernels are generated randomly or they can be user defined. These weights of learnable kernels are also called as parameters. Each kernel traverses across the image along length and breadth. The learnable kernel convolves across the input image and generate activation map or feature map. The weights are shared across the image. These weights are updated during back propagation. The output of convolutional layer can be mathematically formulated as
Where and are mth and nth output map. * indicates convolution between mth input map kernel and nth output map. The local connectivity scheme ensures CNN responses to capture strong responses to capture local independencies and extract significant features to maximize inter-class variation and minimize intra-class variation. Therefore increased correct recognition rate (CRR) for iris recognition system.
B. Max-pooling Layer
The pooling layer is used to reduce the dimensionality of feature map generated by CNN layer. This also called sub-sampling layer. The main function of this layer is to provide invariance to translation of image. This layer also reduces the spatial size of feature map for further processing. The pooling window is defined. This window traverses the output map of CNN to reduce its spatial size. The different strides can be taken window for traversing. This layer helps in learning of strong features. The pooling can be Max-pooling, Min-pooling and Average-pooling.
C. Leaku Relu Activation
To add the non-linearity to network, Leaky Relu, f(x) = max (ax; x) where a < 1, activation function is applied at the top of convolutional layer. This reduces the problem of dead neuron in Relu activation which does not take part in weight updating during back propagation. Leaky Relu activation provides better learning in back propagation.
D. Fully Connected Layer
The two-dimensional output from Convolutional layer or from pooling layer is converted in one dimension by fully connected layer. Each neuron in last layer is connected to next layer neuron. The fully connected layer multiplies the input by weights and ads with bias. This principal is same as multi-layer perceptron. More than one fully connected layer can be used at the top of CNN. In this work only one Fully connected layer is used.
III. DESIGN OF CNN
For designing the CNN architecture, spoofnet [14] architecture is taken in to account. The design of CNN architecture is dependent on input image size. The dimensionality is curse to the deep learning. As the input image size increases the computational complexity increases exponentially. Hence optimum size input image must be chosen so that at least required patterns are retained in order to extract the features. Here we have used image size of 64X64 pixels. As the image size increase more deep architectures are need to be designed and trained and further more computation are required to train the network. The design of CNN architecture and selected hyper-parameters is as given below.
A. Custom CNN Design
In this design, 4 Convolutional layers are used. At first layer, 3X3 kernel size is chosen in order to preserve the feature size at initial layers. Then the kernel size 5X5 is used in layer 2 and 3. In last layer 6X6 kernel size is used in order to get 1X1 feature size at the end. The padding is used at first and last convolutional layer of designed architecture. The number of kernels used in each convolutional layer is increasing in order. This is done to control model capacity. After each convolutional layer Batch Normalization layer is used to speed up the network
Fig. 6. Scratch CNN model
normalization layer is used between CNN and activation layer. This normalizes the activation by subtraction of mini-batch mean and then dividing by mini-batch standard deviation. Here Leaky Relu is used as activation function after each batch normalization layer. The leaky relu activation function solves the problem of dead neuron which do not take part in backpropagation learning. This provides better learning in back propagation. The max-pooling layer is used at output of each CNN layer to reduce the feature space and provide translation and rotation invariance to system. Here a Max-pooing of size 2X2 is used with stride of 2. Finally, only one fully connected layer is used at end. This layer has same principle as that of multi-layer perceptron. In order to avoid the over fitting problem, dropout layer is used with 50% probability[15]. This layer helps in learning the strong features. The dropout layer avoids the overfitting by randomly elimination the weights hence thinned network is formed at the end. The dropout layer also provides the regularization to network to some extent. The number of classes used for IITD and CASIA-Irs-V3 are 224 and 120 respectively. Finally softmax classifier is used at the end to classify the images based on the probability distribution of vector values. The cost function is used by softmax classifier is cross entropy. This cross entropy calculates closeness between the estimated probability vector and actual probability vector for each class. The softmax classifier is suitable for multiclass classification. The in detail CNN architecture is as given in fig 6.
A. Softmax Classifier
The classifier is useful for multi-class classification. This is also an activation function. The vector of probability distribution is generated by this classifier for each class. This is probabilistic model of classifier. The strong prediction values will be closer to 1 and weak prediction values closer to 0. Let K are the classes n training sample labels. The estimated probability can be given by
(4)
Where h ranges from 1 to K. Softmax layer uses cross entropy function as cost function [16].
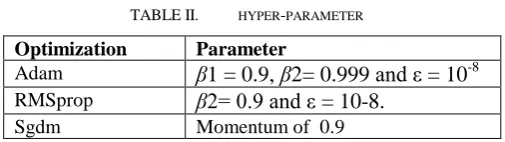
B. Hyper-Parameter Selection
The learning of network is done by 3 different optimizations techniques. The techniques are stochastic gradient descent with momentum (sgdm), root mean square propagation (RMSprop) and adaptive moment estimation (Adam). The learning rate for sgdm is kept to 0.01 and for other optimizations techniques it is 0.001. The batch size of 128 is used for all simulation. The mostly selected parameters are default. The hyper parameter for each optimization technique is as summarized in table 2.
TABLE II. HYPER-PARAMETER
Optimization Parameter
Adam
β
1 = 0.9,
β
2= 0.999 and ε
= 10
-8RMSprop
β
2= 0.9 and ε
= 10-8.
Sgdm Momentum of 0.9
The Adam optimizer calculates the exponential moving average of gradients and squared gradients. The parameters β1 and β2 control the decay rates of moving averages. The per-parameter learning rates are maintained based on first moment (mean) and second moment (uncertain variance).The initial values of β1 and β2 are close to 1 in order to make bias estimates towards zero. The final parameter update is given by
(5) Where α is learning rate, ε is small number to prevent any divide by zero in the implementation, θt is final parameter update , is bias corrected second row moment estimate and
is bias corrected first moment estimate. This is alternative optimization techniques to SGD with momentum. This optimization method combines the benefits of RMSprop and AdaGrand optimization methods. The more details on this optimization is given in [17].
RMSprop is fast and popular optimizer. This optimizer’s popularity is suppressed by Adam optimizer. This is unpublished optimizer but still popular. The efficiency of RMSprop is gained by mini-batches of input and averaging over mini-batches. The idea behind RMSprop is to keep moving averages of squared gradients for each weight and dividing the gradients by
International Journal of Innovative Technology and Exploring Engineering (IJITEE) ISSN: 2278-3075, Volume-8, Issue-9S, July 2019
(6)
Where is moving averages of squared gradients , is gradient of cost function w.r.t weights , α is step size or learning rate and β2 is moving average parameter. The good default setting value is 0.9.
SGD performs parameter update for each training example. Here mini-batch size is used. The parameter update is performed every after mini batch of n training examples. Using mini-batch reduces the variance of parameter update leads to stable convergence. The selection of batch size depends upon the application. But mini-batch needs careful selection of learning rate. Small learning rates leads to slow convergence and large convergence rate can leads to fluctuation in loss function around minimum. The same learning rate is for all parameters. Adding momentum helps to accelerate the convergence in required direction. As a result we get faster convergence and reduced oscillations. The value of momentum is usually set to 0.9. The parameter update is mathematically expressed as
(7) Where, is learning rate, is objective function,
is gradient of objective function and is momentum factor. Generally momentum is kept at 0.9.The parameters selected are almost default parameters or mostly used parameter in simulation.
C. Training and Simulation
The data is spilt in to training, testing and validation. The augmented data is spilt in ratio of 80:10:10 as training, testing and validation respectively. The training data is used to train the CNN with different back propagation algorithms. The validation data is used to validate during learning process. The early stopping condition is used to stop the training as soon as we get minimum validation error on highest validation accuracy. The training time each optimization varies as the convergence rate is not same in each case. The weight updating method is different for each optimizer. Finally, the method is tested for accuracy on validation data.
IV. RESULTS AND DISCUSSION
The accuracy of overall method is mainly dependent on localization accuracy. The localization accuracy decides the overall recognition rate of the system. The localization accuracy is found to be 99.82 % and 99.87% for IITD and CASIA-Iris-V3 database respectively. The accuracy of proposed model can be given mathematically as
(8)
The designed CNN architecture has given promising results for recognition rate with state of art approaches. The recognition rate obtained is summarized in table 3. The scratch CNN design is used to extract the discriminative features from the iris images. The size of image taken is 64X64. Taking lesser than this images size , we may lose the important features or patterns present in iris. The image size can be taken higher than this would require additional computation burdens on network. So we have chosen optimum image size as 64X64. The images are cropped at 4 corners and one central so that system can be made spoofing attack proof. These images are given as input to CNN in order to extract features. The CNN reduces the inter-class variation and maximizes the intra-class variation. The features are extracted automatically without any domain knowledge. This is automatization of feature extraction method using CNN. The number of parameters chosen for our architecture is minim as compared to pre-trained models. Fixed CNN configurations can be designed for fixed image size for iris recognition. The softmax classifier classifies the images based on the computed probability distribution vector for each class. The softmax will also work as activation function. The optimization techniques have shown slightly varying recognition rates for same data base. This is due to hyper parameter selection. However it is to be noted that for RMSprop optimization the recognition rates are nearly equal on both the databases. This shows better generalization ability and improved recognition rate compared to sgdm and Adam optimization. These results are specific for chosen hyper parameters. The learning rate for sgdm is set to 0.01 for faster convergence compared to 0.001 for RMSprop and Adam optimization. The results for obtained recognition rate are compared with other optimization methods as shown in table 3. The recognition rates of left eye are compared with existing methods. It is observed that the recognition rate is improved in case of scratch CNN network compared to other. The key note in this technique is compared with pre-trained Alex-net [18] model. The accuracy is better in case of custom CNN architecture with less parameter. The CNN architecture also helps in minimizing inter-class variation and maximizing intra-class variation. The iris features extracted are defined by CNN itself. Hence it provides good generalization ability compared other techniques. The max-pooling layer provides the spatial variance for features taken during image acquisition. These are less affected by translation or rotation variance. The batch normalization layer has improved the speed of learning. Hence reduced simulation time and faster convergence is achieved in each case. The input images are given to CNN with mini batch size of 128 for all simulations. The comparison of recognition rate is compared with other techniques existing techniques is as shown in table 4. The comparative bar chart for each database is as shown in figure 5. Observing the bar chart we can conclude that the generalization ability of RMSprop is best compared to other optimization techniques. The sgdm provides the least generalization ability as the recognition rates varies much compared to other Adam and RMSprop. The generalization ability of Adam optimizer is in between Sgdm and RMSprop. Though the simulation parameters differ each other the global
minimum for all
RMSprop and Adam optimizers are comparable. Much variation in recognition rates is observed in case of sgdm. In comparison table , the recognition rate of RMSprop is compared with other state of art techniques. Furthermore optimization techniques can be tested with different parameters in future.
TABLE III. HYPER-PARAMETER
Database Optimisation Method
Recognition rate (%)
Left Right
IITD Sgdm 99.64 99.91
RMSprop 99.91 100
Adam 99.91 99.91
CASIA Sgdm 100 99.88
RMSprop 100 100
Adam 99.88 100
TABLE IV. HYPER-PARAMETER
Database Method CRR(%)
IITD
Haar Wavelet[9] 98.45
Log Gabor filter[20] 97.19
DCT[10] 95.17
Texture+scattering [8] 99.20
Alex net model feature [18] 99.40
Scratch CNN 99.91
CASIA
1D polar Gabor Filter [21] 97.21
Haar Wavelet [19] 98.45
Texture+scattering [8] 99.20
Scratch CNN 100
99.8 99.85 99.9 99.95 100
Left Right
Sgdm Adam RMSprop
(a)
99.4 99.5 99.6 99.7 99.8 99.9 100
Left Right
Sgdm Adam RMSprop
[image:6.595.45.333.133.723.2](b)
Fig. 7. Bar Chart for a) IITD b) CASIA-Iris-V3
V. CONCLUSION
The scratch CNN is used for the feature extraction without any domain knowledge. The features extracted are classified by softmax classifier. The efficient pre-processing technique
stage has improved the overall recognition rate. The optimization techniques used with their hyper parameters have shown better recognition rates on each database. The generalization ability is improves in all cases but still we can compared based on optimization methods used. The RMSprop have shown much improved generalization ability with high recognition rate compared to other optimization techniques. It is also noted that the recognition rate for CASIA-Iris-V3 databases is more compared to IITD database as the number of classes or subjects are less in case of CASIA-Iris-V3. For future work, more challenging database needs to be tested for given parameters with more other optimization techniques.
ACKNOWLEDGMENT
I am greatly thankful to honorable Director, NITTTR Chandigarh, Prof. & Head of Electronics Department Dr. S.P Narote , Government Residence Women Polytechnic, Tasgaon, Maharashtra, India for their worthy guidance and help in writing this paper. I am also thankful to kind help of author Ala.S. Waisy and team form School of Electrical Engineering and Computer Science, University of Bradford, Bradford, UK. This research received no specific grant from any funding agency in the public, commercial, or not-for-profit sectors.
REFERENCES
[1] Chengcheng Li , Weidong Zhou , Shasha Yuan, “Iris Recognition
based on a Novel Variation of Local Binary Pattern,” The Visual Computer, Springer, Vol.31, No.10, pp. 1419–1429, 2015.
[2] Tze Weng Ng, Thien Lang Tay, Siak Wang Khor, “ Iris
Recognition Using Rapid Haar Wavelet Decomposition,” IEEE, International Conference on Signal Processing Systems (ICSPS) , pp. 820–823, 2010.
[3] K. Roy, P. Bhattacharya, and C. Y. Suen, “Iris Recognition using
Shape-Guided Approach and Game theory,” Pattern Analysis and Applications ,Springer,Vol.14, No.4, pp. 329–348, 2011.
[4] J. G. Daugman, “High Confidence Visual Recognition of Persons
by a Test of Statistical Independence,” IEEE transactions on
pattern analysis and machine intelligence , Vol. 15, no. 11, 1993..
[5] J. Daugman, “The importance of being random : statistical
principles of iris recognition,” Pattern recognition, Vol. 36, pp. 279–291, 2003..
[6] Saiyed Umer, Bibhas Chandra Dhara, Bhabatosh Chanda
“Texture Code Matrix-based Multi-Instance Iris Recognition,” Pattern Analysis and Application,Springer, Vol.19, No.1, pp. 283-295, 2016.
[7] Mahmoud Elgamal, Nasser Al-Biqami, “An Efficient Feature
Extraction Method for Iris Recognition Based on Wavelet Transformation,” International Journal of Computer and Information Technology ,Vol. 02, No. 03, pp. 521–527, 2013.
[8] Shervin Minaee, AmirAli Abdolrashidi, and Yao Wang, “Iris
Recognition Using Scattering Transform And Textural Features ",IEEE Signal Processing and Signal Processing Education Workshop, pp. 37–42, 2015.
[9] Rathgeb, C and Wagner, J and Busch, C, “SIFT ‑ based iris
recognition revisited : prerequisites , advantages and
improvements,” Pattern Anal. Appl., no. pp. 1-18, 2018.
[10] Abhiram M.H, Chetan Sadhu, K. Manikantan, S. Ramachandran”
Novel DCT based feature extraction for enhanced iris recognition”, IEEE International Conference on Communication, Information & Computing Technology (ICCICT), pp. 1-6, 2012.
[11] Alaa S. Al-Waisy, Rami Qahwaji, Stanley Ipson, Shumoos
Al-Fahdawi,“ A fast and accurate iris localization technique for
healthcare security
system” IEEE
International Conference
on Computer and
International Journal of Innovative Technology and Exploring Engineering (IJITEE) ISSN: 2278-3075, Volume-8, Issue-9S, July 2019
Ubiquitous Computing and
Communications,pp.1028-1034,2015.
[12] A. S. Al-waisy, R. Qahwaji, S. Ipson, and S. Al-fahdawi, “A
Multimodal Biometric System for Personal Identification Based on Deep Learning Approaches,” pp. 163–168, 2017.
[13] Itamar Arel, Derek C Rose, Thomas P, Karnowski,” Deep machine
learning-a new frontier in artificial intelligence research”, IEEE computational intelligence magazine, Vol. 5, No.4, pp. 13-18, 2010.
[14] David Menotti , Allan Pinto , William Robson Schwartz , Helio
Pedrini , Alexandre Xavier Falcao , Anderson Rocha ,”Deep representations for iris, face, and fingerprint spoofing detection”, IEEE Transactions on Information Forensics and Security,Vol.10, No.4, pp. 864-879, 2015.
[15] Nitish Srivastava, Geoffrey Hinton, Alex Krizhevsky, Ilya
Sutskever, Ruslan Salakhutdinov,”Dropout: a simple way to prevent neural networks from overfitting”, The Journal of Machine Learning Research,Vol. 15,No. 01, pp.1929-1958, 2014.
[16] Rui Zeng, Jiasong Wu, Zhuhong Shao, Lotfi Senhadji and
Huazhong Shu, “Quaternion softmax classifier,” IET Electronics Letters, Vol. 50, No. 25, pp-1929-1931, 2014.
[17] Diederik P.Kingma, Jimmy Li Ba, “Adam: A method for
stochastic optimisation”, International Conference on Leraning representation ,pp. 1-15, 2015.
[18] M. G Alaslani and L. A. Elrefaei, “Convolutional Neural Network
Based Feature Extraction for IRIS Recognition,” International Journal of Computer Science Informatics Technology, Vol. 10, No. 2, pp. 65–78, 2018.
[19] Tze Weng Ng, Thien Lang Tay, Siak Wang Khor, “ Iris
Recognition Using Rapid Haar Wavelet Decomposition,” IEEE, International Conference on Signal Processing Systems (ICSPS) ,2010, pp. 820–823.
[20] Ajay Kumar , Arun Passi ,“Comparison and combination of iris
matchers for reliable personal authentication”, Pattern recognition, Elsevier,Vol.43,No.3,pp-1016-1026, 2010.
[21] M. Vatsa, S. Member, R. Singh, S. Member, and A. Noore,
“Improving Iris Recognition Performance Using Segmentation , Quality Enhancement , Match Score Fusion , and Indexing,” IEEE Transactions on Systems, Man, and Cybernetics, Part B (Cybernetics), Vol. 38, No. 4, pp. 1021–1035, 2008.
AUTHORS PROFILE
Dr. Rajesh Mehra is presently Head of Curriculum Development Center at National Institute of
Technical Teacher Training & Research,
Chandigarh, India. He has received his Doctor of Philosophy and Master’s Degree in Electronics &
Communication Engineering from Punjab
University, Chandigarh, India. Dr. Mehra has completed his Bachelor of Technology from NIT, Jalandhar, India. Dr. Mehra has 23 years of Academic Experience along with 10 years of Research Experience. He has nearly 500 publications in Refereed Peer Reviewed International Journals and International Conferences. Dr. Mehra has guided more than 105 PG scholars for their ME thesis work and also guiding 03 independent PhD scholars in his research areas. His research areas include VLSI Design, Digital Signal & Image Processing, Renewable Energy and Energy Harvesting. He has authored one book on PLC & SCADA. Dr. Mehra is senior member IEEE and Life member ISTE.
![Fig. 2. Iris Localisation [10]](https://thumb-us.123doks.com/thumbv2/123dok_us/8192796.258476/2.595.89.476.50.257/fig-iris-localisation.webp)