International Journal of Innovative Technology and Exploring Engineering (IJITEE) ISSN: 2278-3075,Volume-8 Issue-6, April 2019
Prediction of Breast Cancer Using Supervised
Machine Learning Techniques
Ch. Shravya, K. Pravalika
,
Shaik SubhaniAbstract: Breast Cancer is the most often identified cancer among women and major reason for increasing mortality rate among women. As the diagnosis of this disease manually takes long hours and the lesser availability of systems, there is a need to develop the automatic diagnosis system for early detection of cancer. Data mining techniques contribute a lot in the development of such system. For the classification of benign and malignant tumor we have used classification techniques of machine learning in which the machine is learned from the past data and can predict the category of new input. This paper is a relative study on the implementation of models using Logistic Regression, Support Vector Machine (SVM) and K Nearest Neighbor (KNN) is done on the dataset taken from the UCI repository. With respect to the results of accuracy, precision, sensitivity, specificity and False Positive Rate the efficiency of each algorithm is measured and compared. These techniques are coded in python and executed in Spyder, the Scientific Python Development Environment. Our experiments have shown that SVM is the best for predictive analysis with an accuracy of 92.7%.We infer from our study that SVM is the well suited algorithm for prediction and on the whole KNN presented well next to SVM.
Keywords— Classification, Logistic Regression, KNN, SVM.
I. INTRODUCTION
Breast Cancer is the prime reason for demise of women. It is the second dangerous cancer after lung cancer. In the year 2018 according to the statistics provided by World Cancer Research Fund it is estimated that over 2 million new cases were recorded out of which 626,679 deaths were approximated. Of all the cancers, breast cancer constitutes of 11.6% in new cancer cases and come up with 24.2% of cancers among women. In case of any sign or symptom, usually people visit doctor immediately, who may refer to an oncologist, if required. The oncologist can diagnose breast cancer by: Undertaking thorough medical history, Physical examination of both the breasts and also check for swelling or hardening of any lymph nodes in the armpit.
A. Imaging tests:
Mammogram, Magnetic resonance imaging (MRI) of breast, Ultrasound of breastX-ray of the breast, Tissue biopsy: Removal of the tissue of the breast for examination by a pathologist. Sentinel node biopsy: Once breast cancer is confirmed, patients regularly
Revised Manuscript Received on April 07, 2019.
Kuthuru Pravalika, Information Technology, Sreenidhi Institute of Science and Technology, Hyderabad, Telangana, India.
Chakinam Shravya, Information Technology, Sreenidhi Institute of Science and Technology, Hyderabad, Telangana, India.
Dr.Shaik Subhani,InformationTechnology,SreenidhiInstitute of Science and Technology,Hyderabad,Telangana,India.
undergo sentinel node biopsy. This helps to detect cancerous cells in lymph nodes to confirm metastasis of breast cancer into lymphatic system. If required, oncologist may also order additional tests or procedures. In the conventional way of diagnosing breast cancer some tests and procedures are carried out. These tests include Breast exam Mammogram Breast ultrasound Biopsy. As an alternative we can also use Machine Learning techniques for the classification of benign and malignant tumors. The prior diagnosis of Breast Cancer can enhance the prediction and survival rate notably [1], so that patients can be informed to take clinical treatment at the right time. Classification of benign tumors can help the patients avoid undertaking needless treatments. Thus the research is to be carried for the proper diagnosis of Breast Cancer and categorization of patients into malignant and benign groups. Machine Learning, with its advancements in detection of critical featuresfrom the complex datasets is largely acknowledged as the method in the prediction of breast cancer. Application of data mining techniques in the medical field can help in prediction of outcomes, minimizing the cost of medicines, aid people’s health, upgrade the healthcare value and to rescue lives of people. This process of classifying benign and malignant tumors can be best done by the application of Classification techniques of machine learning. Lot of research is being conducted in this area by the application of various machine learning and data mining techniques for many different datasets on Breast Cancer. Most of them show that classification techniques give a good accuracy in prediction of the type of tumor
II. RELATED WORK
AlirezaOsarech, BitaShadgar used SVM classification technique on two different benchmark datasets for breast cancer which got 98.80% and 96.63% accuracies[2]. MandeepRana, PoojaChandorkar, AlishibaDsouza worked on the diagnosis and the prediction of recurrence of breast cancer by applying KNN, SVM, Naïve Bayes and Logistic Regression techniques, programmed in MATLAB. The classification techniques are applied on two datasets taken from UCI depository. A dataset of them is used for identification of disease(WDBC) and the next one is used for recurrence prediction (WPBC)[3].VikasChaurasia, BB Tiwari and Saurabh Pal used three famous algorithms such as J48, Naive bayes, RBF, to build predictive models on breast cancer prediction and compared their accuracy. The results had shown that Naive Bayes predicted well among them with an accuracyof97.36% [4]. Haifeng Wang and Sang Won Yoon compared Naive Bayes Classifier, Support Vector Machine (SVM), AdaBoost tree, Artificial Neural Networks (ANN), to find a
implemented PCA for dimensionality reduction[5].
S.Kharya worked on breast cancer prediction and stated that artificial neural networks are widely used. The paper featured about the advantages and short comings of using machine learning methods like SVM, Naive Bayes, Neural network and Decision trees[6]. NareshKhuriwal,Nidhi Mishra took data from Wisconsin Breast Cancer database and worked on breast cancer diagnosis..The results of their experiments proved that ANN and Logistic Algorithm worked better and provided a good solution. It achieved an accuracy of 98.50% [7].
III. METHODOLOGY
We obtained the breast cancer dataset from UCI repository and used spyder as the platform for the purpose of coding. Our methodology involves use of classification techniques like Support Vector Machine (SVM), K-Nearest Neighbor (K-NN), Logistic Regression, with Dimensionality Reduction technique i.e. Principal Component Analysis (PCA) .
A. Dimensionality Reduction
Dimensionality Reduction is a process in which the number of independent variables is reduced to a set of principle variables by removing those which are less significant in predicting the outcome.
Dimensionality Reduction is used to get two dimensional data so that better visualization of machine learning models can be done by plotting the prediction regions and the prediction boundary for each model. Whatever may be the number of independent variables, we often end up with two independent variables by applying a suitable dimensionality reduction technique.
There are two methods, namely Feature selection and Feature Extraction
B. Feature Selection
Feature selection is finding the subset of original features by different approaches based on the information they provide, accuracy, prediction errors.
C. Feature Projection
Feature projection is transformation of high-dimensional space data to a lower dimensional space (with few attributes). Both linear and nonlinear reduction techniques can be used in accordance with the type of relationships among the features in the dataset.
The dataset used in this research is a multidimensional dataset with 32 attributes, which are related to cell parameters. Selection of features by the application of feature selection is a complex task. Moreover, it cannot give the most accurate features. Therefore we have applied a feature projection technique, PCA to derive two principal components from the dataset.
D. Principal Component Analysis (PCA)
PCA is an unsupervised linear dimensionality reduction algorithm used to find the strongest features based on the covariance matrix of the dataset. It flattens large number of
dimensions to 2 or 3 dimensions. It is used when we need to tackle the curse of dimensionality among data with linear relationships.
It is a linear technique which is used to compress lots of data into something which gives essence of the original data. Based on the variance of the data it plots the actual data into a dimensional space with less attributes such that the variance is maximized.PCA extracts p independent variables from n independent variables of our dataset (p<=n) that explain the most variance of our dataset, despite of the independent variables.With the help of covariance matrix of the dataset, the eigen vectors are calculated. The principal components are those eigen vectors which have the largest eigen values and these can be used to rebuild a huge portion of the variance of the actual data. These few eigen vectors (with most important variance) span a lesser space reducing the original space But this process may cause some data loss. So, we should make sure that they retain the remaining eigenvectors.All these individual principal components sum up to give total variance. Each individual principal component is the ratio to the variance of the principal component to the total variance.The result of applying PCA gives us two principal components PC1 (the first principal component) and PC2 (the second principal component).PC1 gives the most variance and PC2 gives the second most variance.Now, our dataset is ready and data mining techniques can be applied on it for classification of benign and malignant tumors.
E. Model Selection
International Journal of Innovative Technology and Exploring Engineering (IJITEE) ISSN: 2278-3075,Volume-8 Issue-6, April 2019
1. Logistic Regression 2. Nearest Neighbor 3. Support Vector Machines
1. Logistic Regression
Logistic Regression is a supervised machine learning technique, employed in classification jobs ( for predictions based on training data).Logistic Regression uses an equation similar to Linear Regression but the outcome of logistic regression is a categorical variable whereas it is a value for other regression models. Binary outcomes can be predicted from the independent variables. The outcome of dependent variable is discrete. Logistic Regression uses a simple equation which shows the linear relation between the independent variables. These independent variables along with their coefficients are united linearly to form a linear equation that is used to predict the output[8].
The equation used by basic logistic model is Ln (
)=a0+a1*x+a2*x (1)
This is called the logistic function
This algorithm is entitled as logistic regression as the key method behind it is logistic function. The output can be predicted from the independent variables, which form a linear equation. The output predicted has no restrictions, it can be any value from negative infinity to positive infinity.
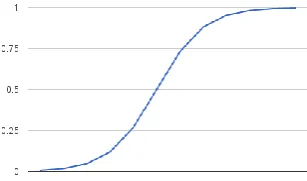
But the output required is a class variable (i.e., yes or no, 1 or 0). So, the outcome of the linear equation should be flattened into a small range (i.e [0,1]).Logistic function is used here to suppress the outcome value between 0 and 1. Logistic function can also be called sigmoid function or Cost function. Logistic function is a Shaped curve which takes the input (numeric value) and changes it to a value between 0 and 1[9].
Applying antilog on both sides of the above equation gives the eq(2) in
y=
(2)
which the predicted value is y and a0 is the y intercept and a1, the coefficient of the independent variable x1(principal component) a2 is the coefficient of the independent variable x2 and e is the base of natural algorithm. In our research the principal components (pc1 and pc2) derived from the dimensionality reduction replace the independent variables x1 and x2. The y intercept and the regression coefficients are estimated by the maximum likelihood estimation [10] method rather than least squares method of estimation.
Fig 1.Logistic Function
2. k-Nearest Neighbor(k-NN)
K-Nearest Neighbor is a supervised machine learning algorithm as the data given to it is labeled. It is a non-parametric method as the classification of test data point relies upon the nearest training data points rather than considering the dimensions (parameters) of the dataset. It is employed in solving both classification and regression tasks. In Classification technique, it classifies the objects based on the k closest training examples in the feature space.
The working principle behind KNN is it presumes that alike data points lie in same surroundings. It reduces the burden of building a model, adapting a number of parameters, or building furthermore assumptions. It catches the idea of proximity based on mathematical formula called as Euclidean distance, calculation of distance between two points in a plane. Suppose the two points in a plane are A(x0,y0) and B( x1,y1) then the Euclidean distance between them is calculated as follows[11].
(3)
An object to be classified is allotted to the respective class which represents the greater number of its nearest neighbors. If k takes the value as 1, then the data point is classified into the category that contains only one nearest neighbor. Given a new input data point, the distances between that points to all the data points in the training dataset are computed. Based on the distances, the training set data points with shorter distances from the test data point are considered as the nearest neighbors of our test data. Finally, the test data point is classified to one of the classes of its nearest neighbor. Thus the classification of the test data point hinges on the classification of its nearest neighbors [12].Choosing the value of K is the crucial step in the implementation of KNN algorithm. The value of K is not fixed and it varies for every dataset, depending on the type of the dataset. If the value of K is less the stability of the prediction is less. In the same manner if we increase its value the ambiguity is reduced, leads to smoother boundaries and increases stability.In KNN, assigning a new data point to a category entirely depends upon K’s value. K represents the number of nearest training data points in the proximity of a given test data point and then the test data point is allotted to the class containing highest number of nearest neighbors(i.e. class with high frequency).
3. Support Vector machine
[image:3.595.84.238.660.750.2]Hyper plane of SVM is built on mathematical equations. The equation of hyper plane is WTX=0 which is similar to the line equation y= ax + b. Here W and X represent vectors where the vector W is always normal to the hyper plane.WTX represents the dot product of vectors. As SVM deals with the dataset when the number of features are more so, we need to use the equation WTX=0 in this case instead of using the line equation y= ax + b.
If a set of training data is given to the machine, each data item will be assigned to one or the other categorical variables, a SVM training algorithm builds a model that plots new data item to one or the other category. In an SVM model, each data item is represented as points in an n-dimensional space where n is the number of features where each feature is represented as the value of a particular coordinate in the n-dimensional space. Classification is carried out by finding a hyper-plane that divides the two- classes proficiently. Later, new data item is mapped into the same space and its category is predicted based on the side of the hyper-plane they turn up.
IV. RESULTS AND DISCUSSION
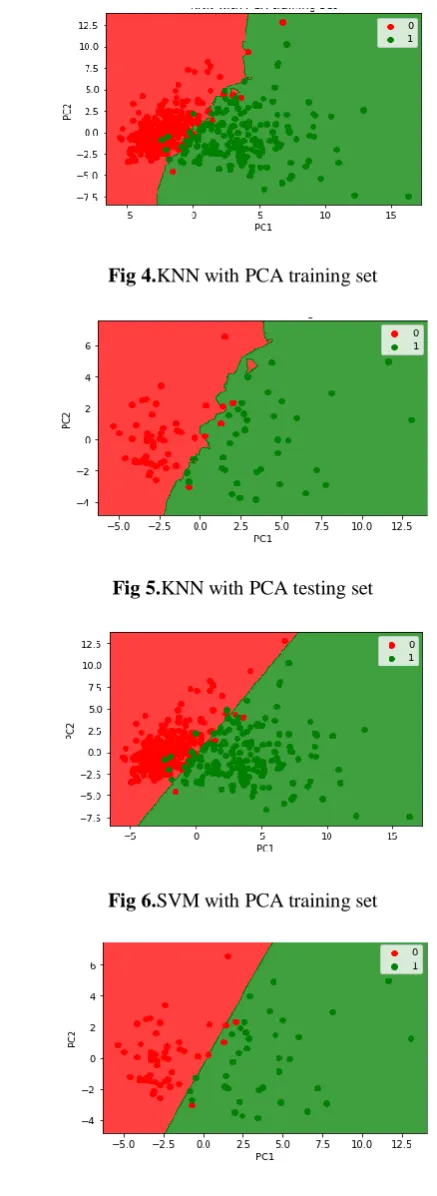
As our dataset contains 32 attributes dimensionality reduction contributes a lot in decreasing the multi-dimensional data to a few dimensions. Of all the three applied algorithms Support Vector Machine, k Nearest Neighbor and Logistic Regression, SVM gives the highest accuracy of 92.7% when compared to other two algorithms. So, we propose that SVM is the best suited algorithm for the prediction of Breast Cancer Occurrence with complex datasets.
Fig 2.Logistic Regression with PCA training set
Fig 3.Logistic Regression with PCA testing set
Fig 4.KNN with PCA training set
Fig 5.KNN with PCA testing set
Fig 6.SVM with PCA training set
Fig 7.SVM with PCA testing set
[image:4.595.305.524.48.647.2] [image:4.595.48.267.444.720.2]International Journal of Innovative Technology and Exploring Engineering (IJITEE) ISSN: 2278-3075,Volume-8 Issue-6, April 2019
Table1.Comparision of the performances of various algorithms
V. CONCLUSION
Our work mainly focused in the advancement of predictive models to achieve good accuracy in predicting valid disease outcomes using supervised machine learning methods. The analysis of the results signify that the integration of multidimensional data along with different classification, feature selection and dimensionality reduction techniques can provide auspicious tools for inference in this domain. Further research in this field should be carried out for the better performance of the classification techniques so that it can predict on more variables.
ACKNOWLEDGMENT
We would like to thank our Research Guide Dr. Shaik Subhani, Associate Professor in Information technology, Sreenidhi Institute of Science and Technology, Hyderabad for their continuous support and valuable suggestions throughout this work carried out by us. Authors are also grateful to the reviewer for perilously going through the manuscript and giving valuable suggestions for the renovation of manuscript. We would also like to thank the Department of Information Technology, Sreenidhi Institute of Science and Technology, Hyderabad for providing us with the facility for carrying out the simulations.
REFERENCES
1. Yi-Sheng Sun, Zhao Zhao, Han-Ping-Zhu,”Risk factors and
Preventions of Breast Cancer” International Journal of Biological Sciences.
2. AlirezaOsarech, BitaShadgar,”A Computer Aided Diagnosis System
for Breast Cancer”,International Journal of Computer Science Issues, Vol. 8, Issue 2, March 2011
3. MandeepRana, PoojaChandorkar, AlishibaDsouza, “Breast cancer
diagnosis and recurrence prediction using machine learning techniques”, International Journal of Research in Engineering and Technology Volume 04, Issue 04, April 2015.
4. VikasChaurasia, BB Tiwari and Saurabh Pal – “Prediction of benign
and malignant breast cancer using data miningstechniques”,Journal of Algorithms and Computational Technology
5. Haifeng Wang and Sang Won Yoon – Breast Cancer Prediction using
Data Mining Method, IEEE Conference paper
6. D.Dubey ,S.Kharya, S.Soni and –“Predictive Machine Learning
techniques for Breast Cancer Detection”, International Journal of
Computer Science and Information
Technologies,Vol.4(6),2013,1023-1028.
7. Nidhi Mishra ,NareshKhuriwal.- “Breast cancer diagnosis using
adaptive voting ensemble machine learning algorithm”, 2018 IEEMA Engineer Infinite Conference (eTechNxT), 2018
8. Chao-Ying ,Joanne, PengKukLida Lee, Gary M. Ingersoll –“An
Introduction to Logistic Regression Analysis and Reporting “, September/October 2002 [Vol. 96(No. 1)]
9. Logistic Regression for Machine Learning - Machine Learning
Masteryhttps://machinelearningmastery.com/logistic-regression-for-machine-learning/
10. InJaeMyung –“MaximumLikelihoodEstimation”
11. Onel Harrison,” Machine Learning Basics with the
K-NearestNeighbors Algorithm “
12. Mohammad Bolandraftar and SadeghBafandehImandoust
-“Application of K-Nearest Neighbor (KNN) Approach for Predicting Economic Events: Theoretical Background”- International Journal of Engineering Research and Applications Vol. 3, Issue 5, Sep-Oct 2013
13. EbrahimEdrissEbrahim Ali1 , Wu Zhi Feng2- “Breast Cancer
Classification using Support Vector Machine and Neural Network”– InternationalJournalofScienceandResearch(IJSR) Volume 5 Issue 3, March 2016
AUTHORS PROFILE
Chakinam Shravya, Information Technology, Sreenidhi Institute of Science and Technology, Hyderabad, Telangana, India.
Kuthuru Pravalika, Information Technology, Sreenidhi Institute of Science and Technology, Hyderabad, Telangana, India.