International Journal of Innovative Technology and Exploring Engineering (IJITEE) ISSN: 2278-3075, Volume-8 Issue-7, May, 2019
Modeling A Malware Detection And
Categorization System Based On Seven Network
Flow-Based Features
Joshua Sopuru, Arif Sari, Murat Akkaya
Abstract: Although several models have been developed for detecting and categorizing malicious Android applications, most network-based frameworks utilize long lists of network features to achieve an average classification accuracy (85.09%), and precision (89.10%). Our proposed model streamlines these lists to seven network flow-based features and achieved an average classification accuracy of (93.62%), success rate (92.68%), and a false positive (0.083). Experiments were carried out to evaluate the performance of three machine learning algorithms (Naive Bayes, J48 and, Random Forest) thereby identifying the best learner(s). Different sizes of training data were also considered for different experiments in other to evaluate learning rates based on different data size.
At the end of our experiments, we identified seven top network flow-based features that can be used to effectively detect and categorize android malware.
Keywords: Network flow-based features, machine learning, Android malware, malware detection and classification, malware family.
I. Introduction
As technology continues to grow, several applications have been developed to run on different smartphones. It is noticeable that as these technologies upgrade their user interface/interaction have developed rapidly over time. Due to increased benefits in mobility, wide area networks, social media, online banking, etc, the usage of mobile devices is on a steady rise. According to the Ericsson company report, before the year 2020 subscription made by smartphones will increase to not less than six billion with mobile networks generating more than 80% of traffic [1]. Furthermore, it is known that about 96% of mobile traffic is generated by Apple and Android OS, of which Android shares 50% of it [2]. However, the fact that the increase in the development of smartphones tends to be rapid does not change the fact that there have been problems in its development. First, due to the increase in demand for well-produced smart-phones, a large market has been opened for malicious software development. Secondly, since Android is open source, it has become vulnerable to attacks and has been used to steal personal information from users. More so, applications designed for malicious intents have affected the use of smartphones as vendors who had fallen victim of an attack are careful to purchase new applications as their activities can be monitored and private information stolen.
Revised Manuscript Received on May 06, 2019
Joshua Sopuru, Department of Management Information systems, The American University
Arif Sari, Department of Management Information systems, The American University
Murat Akkaya, Department of Management Information systems, The American University
For this reason, urgent action needs to be taken in other to protect users. Several techniques have been proposed in the past to ensure user safety amidst this technological challenge. However, as solutions emerge, attackers come up with defensive mechanisms thereby nullifying several efforts. So far, proposed malware detection methods can be categorized into two main groups of dynamic and static techniques of malware detection [3]. Static methods offer detection of malicious
applications by examining codes without running the application while the dynamic method executes the application and studies its behavior. For security reasons, emulator or an isolated environment are usually used to monitor applications and detect the malicious code. Static detection has been opposed by several researchers as it allows for code obfuscation (a practice were real intents of malicious codes are hidden to avoid detection) among other issues, behavioral or dynamic method has proven viable over the years with researchers proposing several solutions. However, the battle for a secured Android mobile still goes on as attackers work tirelessly to downplay proposed solutions. Our research focuses on the development of a dynamic detection and categorization system based on some network-flow features of Android applications.
Since these network flow features cannot be tampered with by an attacker, we designed a model to extract seven network flow-based features and examined their behavior. The major contribution of this paper is a detection and categorization model defined on seven network-flow features.
The subsequent part of this work is structured as follows: Part A is an assessment of previous studies in this domain, part B explores our methodology and steps carried out in the research. Part C describes the proposed model and datasets used, Part D discusses the experiment setup and presents the result, part E discusses results gotten from the experiment and part F presents the conclusion of our research and a direction for further work.
II. Literature Review
Because of the open source nature of the Android OS, attackers have been able to jeopardize the Android mobile security algorithm thereby implementing in applications malicious codes to steal from end users.This has kept researchers and developers seeking various ways of curtailing loss on the part of the users of Android mobile. One way researchers have contributed is in the development of several detection systems aimed at preventing the execution of malicious codes on Android mobile. Detections systems have been developed based on different features. In the study of Android malware, detection systems have been developed based on different features. In 2012 for example, Kuhnel and Meyer in 2012[4] developed a technique using sensor application. They analyzed 30 malware samples belonging to various families that specifically focused on the Android platform. They categorized their list into SMS, premium calls, Remote Access Tool (RAT) and HTTP. User-layers capable of inputting a filtering component and analyze network traffic with the capability to be controlled by the sensor app was utilized. The capability of the sensor app is defined to list almost all events from its database, pass out information about any detected suspicious traffic, dispatch blocked SMS and turn blocking preferences to the opposite specified terms. In conclusion, the authors suggested that the model is capable of detecting ingoing and outgoing suspicious traffic by filtering them.
Miroslaw Skrzewski presented an algorithm for the analysis of net flows to monitor malware activities and facilitate detection operation [5]. In their work, they analyzed detection signs of the operation of malware and proposed an algorithm to capture and extract web-flow parameters. With the use of similarity search, Silvio Cesare and Yang Xiang proposed a model for similarity search of malware based on novel distance metrics observed in specimens. A distance metric based on the distance between features was implemented to evaluate similarities. [6] Results gotten from their system proves that their algorithm is effective a fee false positives rates were recorded, and the system was able to detect more new malware variants than existing algorithms. Every malware has behavior. That is, a certain way they interact with some network components. To understand malware and to effectively classify it, it is important to understand its behavior. Network flow analysis has also been combined with signature-based analysis. In 2014 Carrasquillo et al [7] conducted an analysis based on network malware. They combined network flow and signature-based analysis of Virtual private network relating to mobile-based platforms. The aim was to set an alarm for and visualization analytics for network administrators and mobile users in case they come across any malicious behavior on their platform. The designed system makes use of NetFlow from Cisco and Snort(signature based) which has features such as destination port, IP address, timestamp, etc. Results gotten from their studies proved efficient. However, challenges were faced in the application. Chen et al, [8] in their hypothesis argued that the lack of a huge repository for malware and systematic analysis of network traffic has been the cause of theoretical based research in this field. In response to this, they designed a system to capture traffic from the internet in real-time. The designed system which was designed to capture traffic gotten from Android malware collected 24 variety of Android malware which they experimented upon. In their experiment, during the first five minutes, the recorded traffic was above 99% of
HTTP and DNS. Features like the length of packets, Ad traffic, DNS query, and HTTP packet. When conducting the analysis, they discovered that 40.89% of malware was detected by the HTTP request and 69.55% by DNS query. They also discovered that malware and ads pull more traffic in HTTP component. In 2017[9] a paper was published which laid emphasis on the prioritization of network traffic features by reducing the features so as to obtain accurate processing time when analyzed. The results gotten showed that 9 features taken out of 22 features are capable of giving an accurate maximum detection of about 85% out of 100%. Other related work on Android is the presentation of BLINC by Karagiannis et al in 2005 [10]. Their work specifies the different behaviors done by hosts as data reach the transport layer thus making it a multilevel traffic system. Their paper was one of the first attempt to cover the aspect of shifting from characterized flows to associating flows in three stages. The first is the destination IP address and the social level capture, secondly is the analysis of features collected from the IP address characteristics at the network layer, and the third is the capture of certain information in respect to flows which include the size of the packet at the application level. While conducting the research, the authors made use of various applications such as data transfer, chat, mail, and more. In other to maintain privacy, they studied the range of packet payload, port number except the information provided by the flow collectors. Collected patterns were presented in graphlet and they combined its match with the examined host behavior. Finally, the gotten result showed that BLINC detected malware with about 80 to 90 percent accuracy.
International Journal of Innovative Technology and Exploring Engineering (IJITEE) ISSN: 2278-3075, Volume-8 Issue-7, May, 2019
III. Dataset
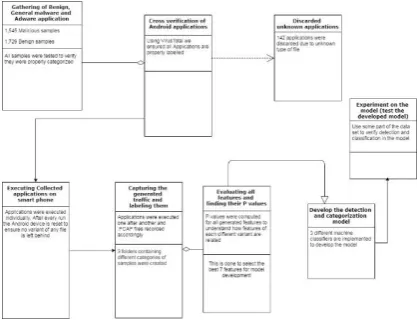
We collected a total of 1840 benign and 1760 malicious application from different sources. Using virus total, we made sure applications recorded as benign were benign and those recorded as malicious were truly malicious. Virus total is an online community for malware detection, it scans uploaded files over 70 different antivirus engines. Ensuring quality dataset of malicious and benign files, we classified a file malicious if identified as malicious by at least one antivirus and benign if no antivirus identifies it as malicious. All collected files were installed and ran on a real smartphone to make sure we restricted any hidden behavior resulting from sandboxing [19].
B. Malicious samples:
Each malware sample was installed and individually ran in an isolated environment. This isolation was done to ensure no interference was mistakenly recorded. Although the applications were running in isolation, the execution environment was not tampered with. A regular Android operating environment was maintained for every malware execution. Malware samples were carefully selected from 2 categories i.e. general malware (816) and adware (1024). Some examples of Adware samples consist of the following:
RottenSys: Android malware which disguises itself as a wi-fi security application and grants access to a C2 server to install additional services without asking for users’ permission. RottenSys since inception has infected over 5 million devices. Research suggests it was developed earlier before 2016
Dowgin: An ads module that hides behind legitimate applications. It displays advertisement contents and gathers personal details that are silently forwarded to a server.
General malware samples include:
FakeBank: This Android trojan clones banking apps installed on a user mobile. It includes call-barring functions making it impossible for its victims to call their bank
ExpensiveWall: This malware specializes in sending fraudulent messages and charging users for fake transactions. It also keeps track of user location and IP address secretly.
[image:3.595.304.513.418.578.2]We used Droidkin (an Android app similarity detections tool) to better-categorized applications in our dataset. The Pie chart in Figure 1 represents the categories of applications that made up our dataset.
Fig 1: distribution of applications in the dataset
C. Extracting traffic from real-time execution of applications
The most important part of our research is to effectively capture all network features from applications during runtime. To do this, we first defined groups of the collected applications, then we prepared an android mobile phone (Samsung Galaxy S5) by synchronizing it with an existing Gmail, Facebook and YouTube account called “senya”. We created the senya account to ensure the test environment was synchronized to a register email account.
Each application was manually installed on the Android mobile phone. After each installation, we executed the application and recorded the desired network features. The benign applications were first installed and executed followed by the malicious applications. To ensure we had no error in recording the features, we formatted the smartphone after running all the benign applications before proceeding to install the malicious samples. During the installation of the malicious applications, we formatted the smart after collecting the features from an installed application. This is done to ensure the smartphone is clean and free from any infection from a previously installed sample.
IV. The proposed model
[image:3.595.74.266.640.733.2]The major contribution of this paper is a simplified model to detect and categorize Android malware based on seven network-flow features. This detection and categorization are based on detecting traffic deviations in networks. The model development and training of the RNN network have been divided into eight phases as represented in Figure 2.
Fig 2: Model development and training phases
The fourth phase develops the detection and categorization modelbased on the seven input features to be considered. The RNN was trained with 85% of data in the fifth phase. In this phase, different experiments were conducted with a different combination of selected features. This is done to determine the seven-best network-flow based features to be considered for the experiment. The final phases identify and select the most appropriate network features and test the model with the remaining 15% of our dataset.
The proposed model represented in figure 3 involves three different modules.
Feature extraction module: The feature extraction level harness the ability of Network feature extraction applications like packet captures to extract desired network-flow features in android applications. The output from these files is in the format. PCAP. These files contain labeled data of network flow used in training the recurrent neural network.
Feature selection: Our extraction model generated 84 different features from the apk samples extracted. Out of these 84 different network flow parameters, 74 are usable for network deviation prediction. As the major contribution of this paper Is to develop a model that is streamlined to use a minimum number of features for effective detection of malicious applications, we then devised a means in selecting the best features to be used in building the machine model our of 74 features. To select these features, we conducted a T-test on all 74 features. Results gotten from the T-test presented different values of which we categorized the features into 4 different groups of: P = > 1, P < 1 > 0.05, P < 0.05, and P = Undefined. 17 features fell into the category of P < 0.05 thereby giving us 17 different features possible to be used. Since the combination of these features also affects the efficiency of the proposed system, we then choose 7 features with least P values.
Recurrent neural network: A machine learning algorithm is implemented to derive knowledge from data supplied to the RNN. With seven input nodes, the RNN receives as inputs features extracted from applications. The RNN decides by considering current input and what it had previously learned from such inputs. For this reason, the RNN is initially trained with a training dataset and then tested with actual data.
Categorization module: This module applies analytics in detecting and categorizing malicious applications. Linked to the cloud, analytics is performed on inputs to effectively categorization malicious samples. The categorization module helps to improve the knowledge of the RNN through reinforcement learning by submitting newly discovered malware variants to the RNN module as training data.
Fig 3: Proposed model for malware detection and categorization
Machine learning phase: The machine learning phase is divided into 9 different sub processes. Each process handles specific function aimed at creating the learning model. Figure 4 shows the lists of sub-processes and their need of machine resources.
Fig 4: Machine learning phase
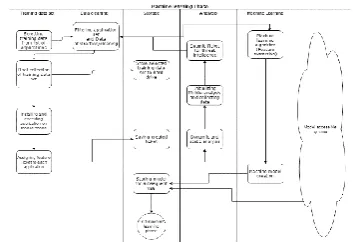
Figure 5 below is a process flow diagram of the learning process.
Fig 5: Process flow of machine learning phase
Machine prediction phase: After the prediction model has been successfully developed through the learning phase, machine prediction is carried out to ensure the model works properly. In this phase, we complete 7 sub-processes. These sub-processes are presented in figure 6 below
Sub-Process name
Computation requirement
Network Utilization rate
Storage requirement
Read and write operation
Required computation time Machine
learning data selection
Low High High High High
Data submission with assigned identification
Low Low High High Low
Learning analysis ticket creation
Moderate Low High High High
Dynamic and static analysis
High High Low Low High
Threat intelligence
Moderate High Low Low High Extraction of
data and resetting the system
High Low Low Low Low
Extraction of features
Moderate Low High High High Machine
model creation
High None High High Moderate
Saving the model
[image:4.595.316.545.64.167.2] [image:4.595.317.532.266.469.2] [image:4.595.338.515.534.655.2]International Journal of Innovative Technology and Exploring Engineering (IJITEE) ISSN: 2278-3075, Volume-8 Issue-7, May, 2019
[image:5.595.330.522.177.273.2]Fig 6: Machine prediction phase
Figure 7 is a process flow diagram of the prediction process
Fig 7: Process flow of machine prediction phase
V. Set up of Experiments
Network flow-based features define a two-directional flow by a sequence of communication packets having same destination port, source port, Source IP, destination IP and protocol. The experiment involved running the applications and extracting all features. All generated traffics are categorized into general malicious applications, adware, and benign apps. We extracted all possible flow features for our experiment using the feature extraction tool. We then performed T-test on the sets of features and selected the best features for training our model. For easy understanding, we grouped the network flow features into different categories of traffic flow-based, Number of packets sent/received, behavior-based, event-based, and flow-based.
Behavior-based features: These features can be collected following a static or a dynamic method. Behavior-based data extracted using static approach Import tables, information of file structure, the name of function calls, control flows, and string. In the dynamic approach, virtual environments (sandboxes) such as Anubis [20], Cuckoo [22] and Ether [21] are used to execute applications and the features extracted. Features extracted using dynamic approach includes systems calls, environmental variables and, function returns.
Traffic flow-based features: The features involve the number of bytes sent or received either by the running application or from a remote server. Forward header length, backward header length, total forward bytes, total backward bytes, etc are some features that can be extracted.
Number of packets sent/received: packets are sent on the network layer. The number of packets sent or received by an application can be monitored. This feature can be analyzed to understand the behavior of applications. Total forward packets, total backward packets, and forward packet length (Min, Mean, Max, Std) packet-based features that can be evaluated.
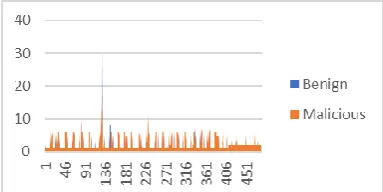
Figure 8 is a graph showing a comparison of total forward packets of 150 benign and 150 malicious android applications
Fig 8: results got from a comparison of total flow forward bytes of malicious and benign samples
[image:5.595.61.274.260.423.2]Event-based features: Time of network events can be analyzed to help categorize applications. For example, we can harness the time difference in sending or receiving packets. Forward Arrival time, Backward arrival time, idle time and active time are some features that can be recorded. Figure 9 is a graph showing a comparison of the idle time of 150 benign and 150 malicious Android applications.
Fig 9: results got from a comparison of the idle time of malicious and benign samples
Flow-based features: In recent times, flow-based features have been used for malware behavioral analysis. Considering system logs and network traffic data, more than 60 flow-based features can be extracted. Research has however shown that considering five top features out of these 60 features can be used to effectively differentiate malicious applications from benign applications [21]. Some commonly used flow-based features are the number of received packets, number of packets sent, number of packets related to ICMP, etc.
A. Feature extraction
Several features have been considered in previous studies in this domain. Since we are interested in developing a model that will function effectively with the least number of features possible, we
focused on 7 features based on their P values.
Sub-Process name
Computation requirement
Network Utilization rate
Storage requirement
Read and write operation
Required computation time Test
Application submission
Low Moderate Moderate Low Low
Test ticket creation
Low None Low Low Low Ticket
storage
Low None Low Moderate Low Dynamic and
static analysis
Moderate Moderate Low Low Moderate
Threat intelligence
Moderate High Low Low Moderate Data
cleaning and extraction
High Low Low Low Moderate
Extraction of features
Moderate None High High High Prediction
with model
Moderate Moderate Moderate Moderate Moderate Saving the
model
[image:5.595.315.538.401.546.2]Seven network flow-based features met test criteria and were selected for this purpose.
We used an open source Java application called CICFlowMeter to extract the flow features.
In general, we extracted 435,565 traffic flow instances. To develop the proposed model, we divided experiments into the following sequences:
Part A: Test for significant differences in the different samples of extracted features.
Part B: Differentiate malicious applications from Benign applications
Part C: Differentiate malicious applications from Benign applications based on previously used features
Part A (Significant differences in flow (Packets and network flow) of the tested specimen): Using the statistical tools T-test we calculated P value of features.
A t-test is a statistical tool used in comparing the difference between different classes. So, in this phase, we compared if there exists a significant difference in the network and packet flow of Benign and General malware, Benign and Adware or General malware and Adware. P value indicates if a significant difference exists. Statistically if P <= 0.05 it means a significant difference exists between the understudy features and as such, they can be used for classification.
We generated a total of 83 network features. The proper combination of these network features can be used to develop a successful detection and classification system. In other to select the best combination, we experimented on the all generated features.
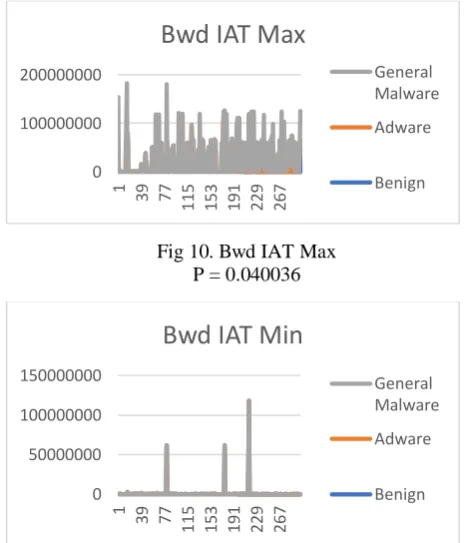
[image:6.595.298.537.69.646.2]Result identified 10 features as having P values < = 0.05. Meaning the differences in data produced by the general malicious, Adware and Benign samples of these features are considered large and can be used to develop a model for detection.
Fig 10. Bwd IAT Max P = 0.040036
Fig 11. Bwd IAT Min T-test result
P = 0.04568
Fig 12. BwdPkt Len Min T-test result P = 0.040753
Fig 13. Flow IAT Std T-test result P = 0.0256
Fig 14. Flow Pkts/s T-test result P = 0.05304
Fig 15. Fwd Header Len T-test result P = 0.02976
0 100000000 200000000
1 39 77
115 153 191 229 267
Bwd IAT Max
General Malware
Adware
Benign
0 50000000 100000000 150000000
1 39 77
115 153 191 229 267
Bwd IAT Min
General Malware
Adware
Benign
0 500 1000 1500
1 32 63 94
125 156 187 218 249 280
Bwd Pkt Len Min
General Malware
Adware
Benign
0 20000000 40000000 60000000 80000000
1 39 77
115 153 191 229 267
Flow IAT Std
General Malware
Adware
Benign
0 200000 400000 600000 800000 1000000 1200000
1 35 69
103 137 171 205 239 273
Flow Pkts/s
Benign
Adware
General Malware
0 20000 40000 60000 80000 100000
1 35 69
103 137 171 205 239 273
Fwd Header Len
General Malware
Adware
[image:6.595.45.278.496.768.2]International Journal of Innovative Technology and Exploring Engineering (IJITEE) ISSN: 2278-3075, Volume-8 Issue-7, May, 2019
Fig 16. FwdPkts/s T-test result P = 0.025958
Fig 17. Idle Std T-test result P = 0.027719
Fig 18. SubflowFwdPkts T-test result P = 0.032897
Fig 19. Tot FwdPkts T-test result P = 0.032897
These 10 features were classified as high reactants while other features with higher P values are classified as low reactants. In other to derive the best 7 features from these
reactants, we decided to set a standard P value to be considered for inclusion to the 7 feature lists. This led to the selection of 7 features shown in the table below.
Table: List of 7selected network features for model development
/ Feature
F1 Bwd IAT Std
F2 Fwd Seg Avg
F3 Idle Mean F4 Pkt Len Min F5 Pkt Len Var
F6 SubflowFwdByts
F7 Tot Len FwdPkts
Part B: Differentiate between a malicious and benign application based on selected network features.
Three machine classifiers (Random Tree (RT), K-Nearest Neighbours (KNN) and Forest (RF)) were used to train and test the model.
We select the False positive rate (FPO) and Precision (Pre) to examine the quality of each classification. Precision defines the total number of samples that were classified correctly (TP) for all instances of X (TP + FPR).
That is Pre =
Also, we calculate the false negative referencing the Sensitivity or Recall (Rec). Rec represents the ratio of rightly classified malware/benign instances (TP) of all Y samples (TP + FNO).
Rec =
TP = True Positive outcomes FPO = False Positive outcomes FNO = False Negative outcomes.
To get the best sets of features for the chosen dataset, we computed the weighted average precision.
WaPr =
PrSirepresents the precision of sample set Si, TP + FPO +
TN + FNO equals to the number of samples and TPSi + FPSi
represents the classified samples as Si.
[image:7.595.300.484.121.221.2]Results obtained from 3 different classifiers are presented in Figure 20 below
Fig 20: Results from 3 machine classifiers
Dataset used consisted of malicious and benign applications. This scenario just labels a sample as malicious or benign. The result obtained for 3 classifiers is represented in figure 6, scenario 1.
0 100000 200000 300000 400000 500000 600000
1 35 69
103 137 171 205 239 273
Fwd Pkts/s
Benign
Adware
General Malware
0 10000000 20000000 30000000 40000000
1 39 77
115 153 191 229 267
Idle Std
General Malware
Adware
Benign
0 500 1000 1500 2000 2500 3000
1 32 63 94
125 156 187 218 249 280
Subflow Fwd Pkts
General Malware
Adware
Benign
0 500 1000 1500 2000 2500 3000
1 32 63 94
125 156 187 218 249 280
Tot Fwd Pkts
General Malware
Adware
[image:7.595.306.517.580.681.2]From the results, we observed the RF classifier achieved an accuracy of 94% utilizing only seven features. The average realized from three algorithms is 93.5% detection accuracy, with a precision of 93% average from all algorithms. Average value of all False Positive is 0.06%. Results obtained also show that the number of falsely classified samples is low. RF classifier which achieved the highest level of accuracy also had the lowest level of false positives making the model efficient.
VI. Evaluation and discussion
From results gotten from the experiment, we affirm that the selected 7 features can be sufficiently relied on in detecting and classifying malicious applications. To further evaluate the results of the proposed model, we verified the model by executing three of the classifiers on the dataset initially separated from the training dataset.
Results from this experiment show that in the detection phase the minimum accuracy is from KNN with an average of 91.32% and an average of 91.08% in the labeling phase, with an FP of 0.094, 0.093 respectively. It was observed that the RT classifier performed better than other classifiers tested. With an accuracy of 92.08% (average) and an FP of 0.068%.
Comparing our results to results gotten from previous studies, we observed that for the fact our traffic was generated from real-life scenario and training data considerably large, we conclude that based on the accuracy level of 93.62% and a success rate of 92.68% realized, the proposed model is reliable for the identification and classification of malicious applications. Also, considering the seven features we selected, our study proves that these features can be used as a reference to understand the behavior of malicious applications. Since it is impossible for attackers to modify these network behavior, detection/categorization systems can be effectively developed considering this model.
VII. Conclusion
In this paper, we proposed seven network-based features for detecting and categorizing malicious applications. These seven features were selected after considering seventy-six other features. Based on previous studies, we observed that these features can be reduced to achieve even better results. To determine the best-fit features, we conducted T-test and selected best-fit features. Experimenting on three different classifiers, we observed that our proposed model achieved an accuracy level of 93.62% in detecting malicious applications and 92.68% in the classification of malicious applications with a 0.083% false positive rate. Our model also implemented a centralized database where malware variants can be regularly uploaded, this model ensures new malicious variants are immediately tagged malicious thereby ensuring the safety of the public. For future work, we plan to expand our model to incorporate other features like system information and user activities in detecting and categorizing Android applications.
REFERENCE
1. Ericsson Mobility Report,http://www.ericsson.com/res/docs /2015/ericsson-mobility-report-June- 2015.pdf, Accessed Dec 2016 2. Marketing Land report, http://marketingland.com/
reportable-Android-now-96-percent-smartphones-globally-119487, Accessed Dec 2016
3. Yerima, S. Y., Sezer, S., McWilliams, G., &Muttik, I. (2013, March). A new Android malware detection approach using Bayesian classification. In 2013 IEEE 27th international conference on advanced information networking and applications (AINA) (pp. 121-128). IEEE.
4. Marian Kuhnel and Ulrike Meyer,
5. detecting malware initiating traffic on a mobile device, RWTHAACHEN university, 2012
6. Skrzewski, M. (2011, June). Flow-based algorithm for malware traffic detection. In International Conference on Computer Networks (pp. 271-280). Springer, Berlin, Heidelberg.
7. Cesare, S., & Xiang, Y. (2011, November). Malware variant detection using similarity search over sets of control flow graphs. In 2011IEEE 10th International Conference on Trust, Security and Privacy in Computing and Communications (pp. 181-189). IEEE.
8. Carrasquillo, Abimael and Maldonado, Albert E and Santos, Eric and Ortiz-Ubarri, Jos´e, Poster: Towards a framework for Network-based malware detection System, 35th IEEE Symposium on Security and Privacy, 2014
9. Z. Chen and H. Han and Q. Yan and B. Yang and L. Peng and L. Zhang and J. Li, A First Look at Android malware Traffic in First Few Minutes, Trustcom/BigDataSE/ISPA, Vol 1, p206-213, 2015 IEEE
10. Arora, Anshul, and Sateesh K. Peddoju.” Minimizing Network Traffic Features for Android Mobile Malware Detection.” Proceedings of the 18th International Conference on Distributed Computing and Networking. ACM, 2017
11. Karagiannis, Thomas, Konstantina Papagiannaki, and Michalis Faloutsos. BLINC: multilevel traffic classification in the dark. ACM SIGCOMM Computer Communication Review. Vol. 35. No. 4. ACM, 2005.
12. Nguyen, T. T., and Armitage, G. (2008). A survey of techniques for internet traffic classification using machine learning. IEEE Communications Surveys & Tutorials, 10(4), 56-76.
13. Bartos, Karel, Michal Sofka, and Vojtech Franc.” Optimized Invariant Representation of Network Traffic for Detecting Unseen Malware Variants.” USENIX Security Symposium. 2016.
14. Tracy, K. W. (2012). Mobile Application Development Experiences on Apple¿ s iOS and Android OS. Ieee Potentials, 31(4), 30-34. 15. Gandhewar, N., & Sheikh, R. (2010). Google Android: An emerging
software platform for mobile devices. International Journal on Computer Science and Engineering, 1(1), 12-17.
16. Hawthorne, M. J., & Perry, D. E. (2005, May). Software engineering education in the era of outsourcing, distributed development, and open source software: challenges and opportunities. In International Conference on Software Engineering (pp. 166-185). Springer, Berlin, Heidelberg.
AUTHORS PROFILE
Joshua Sopuru is a PhD. Candidate studying management information system is Girne American university
Arif Sari is an associate professor in the department of Management Information system, Girne American university