Worldwide Messaging Support for High Performance
Real-time Collaboration
Pete Burnap
2, Hasan Bulut
1, Shrideep Pallickara
1, Geoffrey Fox
1, David Walker
2, Ali Kaplan
1,
Beytullah Yildiz
1, and Mehmet A. Nacar
1[email protected], [email protected], [email protected], [email protected],
[email protected], [email protected], [email protected], and [email protected]
Community Grids Lab, Indiana University
1School of Computer Science, Cardiff University, UK
2Abstract
The requirements for collaborative services, especially pertaining to order and delivery, are quite different compared to traditional distributed applications. The NaradaBrokering (NB) messaging substrate enables scalable, fault-tolerant, distributed interactions between entities, and is based on the publish/subscribe paradigm. The substrate also incorporates support for Grid and Web Service. More recently, we have incorporated services within the substrate which enable us to facilitate richer collaborative interactions. We have performed benchmark tests on machines in the USA, UK and Australia to gauge the performance and scalability of the NaradaBrokering substrate over worldwide networks using benchmarking software developed alongside NaradaBrokering with varying message payloads and large attachments over Parallel TCP. In this paper, we demonstrate how our results show that the substrate can indeed be utilised to achieve maximum performance in a collaborative messaging environment over worldwide networks with the ability to maintain performance notwithstanding scalability constraints.
1.
Introduction
Message-Oriented Middleware (MOM) can be viewed as a middleware layer lying between the application and transport layers at both ends of a communication path. MOM virtualizes communication in distributed, heterogeneous environments, thereby increasing interoperability, portability, and flexibility. MOM supports asynchronous communication, typically through the use of message queues, which help insulate distributed applications from the impact of destinations that are busy due to high message traffic, or that are temporarily disconnected. MOM is well-suited for applications requiring event or notification services, and for service-based systems in general since it provides a conceptual model for communication between services. The notification service being developed at Southampton University for the MyGrid project and the iJob environment developed at San Jose State University by Fatoohi [1] may both be regarded as examples of MOM.
As the Open Grid Services Architecture (OGSA) gains increasing acceptance in the e-Science community, it is becoming apparent that MOM is an important aspect of the service-oriented architecture (SOA) that has not received sufficient attention. The main motivation for the research detailed in this paper is to demonstrate that the NaradaBrokering (NB) MOM substrate developed at Indiana University could be incorporated into a SOA for grid computing. A table that compares the main features of some leading messaging systems with NaradaBrokering is available at http://www.cs.cf.ac.uk/User/David.W.Walker/NB.pdf.
applications and develop its credibility within the distributed computing workgroups and consortia.
To test the performance issues of NaradaBrokering on a worldwide scale, Narada brokers were set up at Cardiff in the UK, Indiana in the USA and Melbourne in Australia. This facilitated global testing over intern-Continental networks. Port connection speeds of 100mbs were used as standard with extra testing over 1 gigabit networks between Cardiff and Indiana. Benchmarking software developed alongside the NaradaBrokering substrate was used to send message packets of varying sizes between messaging clients at all sites using exhaustive permutations of brokers and clients. A test bed application has also been developed to collate results of global network tests with varying message payloads and large attachments over Parallel TCP.
In this paper we report the results of these tests and identify the benefits of the NaradaBrokering substrate to the collaborative working community with regard to delivering high performance, scalable and reliable distributed messaging across inter-continental networks.
The remainder of the paper is organised as follows: In section 2 we provide a brief overview of the NaradaBrokering substrate, in which we compare and contrast the advantages of the publish/subscribe paradigm that NaradaBrokering adopts over hardware Multicast. In section 3 the various services made available by the NaradaBrokering substrate which can be leveraged by high performance collaborative applications, and report on the benchmark testing results that we achieved when profiling the performance of the substrate over inter-Continental networks. In section 4 we present an overview of related work. Finally, in section 5 we outline our conclusions.
2.
NaradaBrokering Substrate
NaradaBrokering is based on the publish/subscribe paradigm. Communication within the NaradaBrokering infrastructure is asynchronous and the system can be used to support different interactions by encapsulating them in specialized messages (also referred to as events). NaradaBrokering allows clients to register their subscriptions (interest in the content of messages) using a variety of formats. The subscriptions can be in the form of String, Integer, Long and <tag, value> based topics, or in the form of XPath, SQL and Regular expression queries. Support for this variety of subscription formats also implies richer collaborative interactions since actions may be triggered only under very precise conditions. The complexity of managing these subscriptions and routing relevant messages is delegated
to the middleware substrate. Since the individual entities do not need to cope with the complexity of constraints, this in turn facilitates easier development of collaborative applications which enable these complex interactions.
2.1 Inter-continental benchmarks
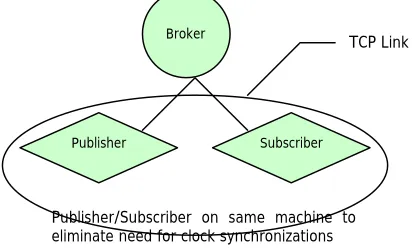
[image:2.595.316.522.331.456.2]We now report results pertaining to communications within the NaradaBrokering substrate. The experimental setup for our measurements is depicted in Figure 1. The results are depicted in Figure 2, Figure 3 and Figure 4, where each point in the delay-curve corresponding to the average of 50 messages. The standard deviation-curve reports the deviation in these delays. The per-hop latency in cases up until 4KB is around 1 millisecond (transit delay corresponds to traversal from publisher-broker-subscriber).
Figure 1: Experimental setup for measuring communication latencies
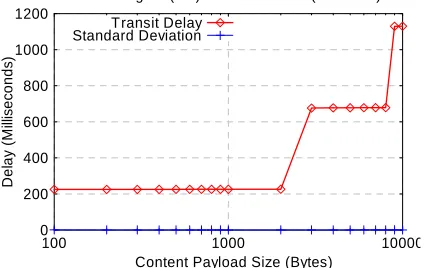
Figure 2 depicts the results of our benchmarking in trans-Atlantic settings. Figure 3 depicts the results in settings involving machines in the UK and Australia. Finally, Figure 4 depicts results in settings involving machines in the US and Australia
The machines configurations for these tests were as follows:
UK: 2x AMD Opteron 246 (@2GHz, 1Mb cache) processors with 2Gb RAM running 64-bit Linux (Fedora core 2, running kernel 2.6.10-1.771_FC2smp). It has 2x SATA drives.
US: Sun Fire V880 machine has 8x1.2 GHz UltraSPARC III processors with 16 GB of RAM on Solaris 9. It has 6x72GB 10K rpm internal HD
Australia: IBM eServer xSeries with 2 x Intel Xeon 2.6 Ghz processors and 2 GB RAM. 70 GB HD running Redhat Linux 8
Broker
Publisher Subscriber
Publisher/Subscriber on same machine to eliminate need for clock synchronizations
0 200 400 600 800 1000 1200
100 1000 10000
D
e
la
y
(M
ill
is
ec
onds
)
Content Payload Size (Bytes)
Transit Delay & Standard Deviation for different payloads Cardiff (UK) and Bloomington (US)
[image:3.595.65.285.132.279.2]Transit Delay Standard Deviation
Figure 2: Transit delays and standard deviations for payloads (UK-US settings)
0 200 400 600 800 1000 1200 1400
100 1000 10000
D
e
la
y
(
M
ill
is
e
c
o
n
d
s
)
Content Payload Size (Bytes)
Transit Delay & Standard Deviation for different payloads Cardiff (UK) and Melbourne (Australia)
[image:3.595.66.285.337.479.2]Transit Delay Standard Deviation
Figure 3: Transit delays and standard deviations for payloads (UK-Australia settings)
0 200 400 600 800 1000 1200
100 1000 10000
D
e
la
y
(
M
ill
is
ec
onds
)
Content Payload Size (Bytes)
Transit Delay & Standard Deviation for different payloads Bloomington (US) and Melbourne (Australia)
Transit Delay Standard Deviation
Figure 4: Transit delays and standard deviations for payloads (US-Australia settings)
2.2 Parallel TCP Streams
Data transfer across high-performance networks suffers within the current TCP implementation because of its tendency to hold back maximum bandwidth usage, even though advancement in network technologies are providing higher data rates. Transferring data on a high speed wide area network is especially adversely affected by this problem. It can be solved either by using multiple streams in parallel or increasing the TCP window size by tuning network settings. However, the main drawback to the latter solution is that it can not be considered as a cross platform solution because there is no automatic network tuning, and tuning network settings is different in different operating systems. Therefore, we chose multiple parallel TCP streams to achieve maximum bandwidth usage.
Our design of multiple parallel TCP streams consists of three basic steps; splitting of data into sub packets at sender side, sending these sub packets over the network by using multiple Java socket streams in parallel, and merging of received sub packets at the receiver side. Using multiple parallel TCP streams gives better transfer rate by aggregating individual socket bandwidth, although the default socket buffer size is not set to the value of the bandwidth delay product.
2.2.1 Overheads and timing
A simplified formula for calculation of the file transmission time is as follows:
The time for normal TCP (TCPT): Duration for transferring a given data with normal TCP connection. The time for parallel TCP (PTCPT): Duration for transferring a given data with parallel TCP connection.
PTCPT consists of the maximum transfer time among the parallel streams (TxPTCPTmax) and overhead (OHT) that mainly comes from fragmentation and coalescence of data. Network transfer time for the same size of data is nearly the same as the TCPT network transfer time. In other words, we expect that the transmission time should be close for the same size of data within the same network environment. However, since we can not send all parallel streams at the same time, there must be a delay between parallel streams before sending the data to actual physical network layer. PTCPT = TxPTCPTmax + OHT
[image:3.595.66.280.538.672.2]TCPT/n ≈ TxPTCPTmax (But in reality, as we explained above, TCPT should be smaller than TxPTCPTmax)
Then,
TCPT > TCPT/n + OHT ==> OHT < (n-1)TCPT/n
2.2.2 Tests
In this section, we will discuss how well our multiple stream transfer mechanismarchitecture performs. To see how the underlying networks impacts its performance, we performed three tests; LAN testing, continental WAN testing, and inter-continental WAN testing. All the bandwidth capacity was measured by using Iperf with these options:
iperf -s -w 256k
iperf -c <hostname> -w 512k -P 40
LAN Test:
It was performed between two Indiana University machines which are nearly 50 miles away from each other. We used the following environments for our performance tests.
Server: Sun Fire V880 machine has 8x1.2 GHz UltraSPARC III processors with 16 GB of RAM on Solaris 9. It has 6x72GB 10K rpm internal HD.
Client: Dell Optiplex GX280 has Pentium 4 3.4 GHz CPU with 1GB of RAM on Microsoft Windows XP Professioanl version 2002 with service pack 2. It has Seagate ST3160023AS, which features speeds of 7200 rpm, an 8.5 ms average seek time, 8 MB cache and 160 GB capacity.
Bandwidth reported by IPerf: 94.6 Mbps
65 67 69 71 73 75 77 79 81 83 85
1 2 3 4 5 6
N u m b e r o f S t r e a m s
[image:4.595.310.516.490.699.2]10 MB 20 MB 30 MB 40 MB 50 MB 60 MB 70 MB 80 MB 90 MB 100 MB 200 MB 300 MB 400 MB 500 MB 600 MB 700 MB 800 MB 900 MB 1 GB
Figure 5: Bandwidth results for different file size (Mbytes)
In LAN, there is no significant improvement in bandwidth usage while using multiple parallel streams, because today's LAN connection is very fast, and transmission time is smaller than overhead time (TCPT << OHT). Files with smaller size are suffering from multiple streams because overhead time is much more dominant when compared to the transmission time. Like the smaller sized files, larger files also suffer from this over head time, however these overheads are less drastic because of longer transmission times associated with them. Hence, multiple streams do not have a positive impact on LAN environments. Figure 5 illustrates that multiple parallel streams have a negative effect on data transfer over LAN environments.
Continental WAN Test:
This test was performed between Indiana University and University of California at San Diego.
Server: Dual Pentium III 731MHz CPU with 512 MB of RAM on GNU/Linux 2.4.21-4.ELsmp located at University of California at San Diego.
Client: Sun Fire V880 machine has 8x1.2 GHz UltraSPARC III processors with 16 GB of RAM on Solaris 9. It has 6x72GB 10K rpm internal HD.
Bandwidth reported by IPerf: 89.4 Mbps
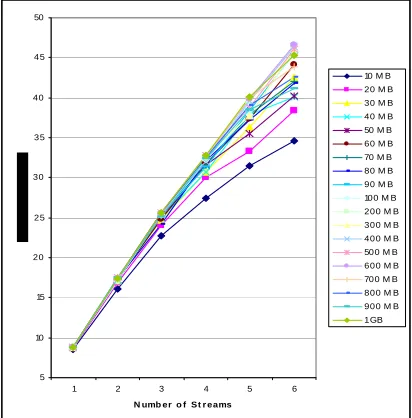
As we can see from Figure 6 the gain from the multiple streams becomes dominant in long-distance data transfer. Even though, both smaller and larger size file gets the benefits of multiple streams, the overhead of fragmentation and coalescence of data is still traceable in files which sizes are smaller than 100 MB.
5 10 15 20 25 30 35 40 45 50
1 2 3 4 5 6
N umb er o f St r eams
10 M B 20 M B 30 M B 40 M B 50 M B 60 M B 70 M B 80 M B 90 M B 100 M B 200 M B 300 M B 400 M B 500 M B 600 M B 700 M B 800 M B 900 M B 1 GB
Inter-Continental WAN Test:
We performed this test between Indiana University at United State and Cardiff University at United Kingdom.
Server: Dual Pentium III 1GHz CPU with 1.5 GB of RAM on Red Hat Linux 7.2 located at Cardiff University.
Client: Sun Fire V880 machine has 8x1.2 GHz UltraSPARC III processors with 16 GB of RAM on Solaris 9. It has 6x72GB 10K rpm internal HD at Indiana University (Indianapolis).
Bandwidth reported by IPerf:: 69.1 Mbps
0.00 2.00 4.00 6.00 8.00 10.00 12.00 14.00
1 2 3 4 5 6
Num be r of Stre am s
B
a
n
d
wit
h
(
M
bps
)
10 MB
20 MB
30 MB
40 MB
50 MB
60 MB
70 MB
80 MB
90 MB
100 MB
200 MB
300 MB
400 MB
500 MB
[image:5.595.65.276.266.476.2]600 MB
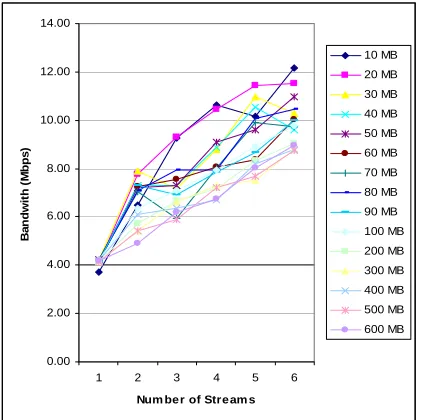
Figure 7: Transfer times - Trans-Atlantic settings
As we can see in Figure 7, the gain from the multiple parallel streams becomes dominant in long-distance data transfer. Even though, both smaller and larger size file gets the benefits of multiple streams, the overhead of fragmentation and coalescence of data is still traceable in files which sizes are smaller than 100 MB.
3.
Services enriching collaboration within
the NaradaBrokering substrate
In this section we outline services that we have incorporated into the NaradaBrokering substrate to facilitate richer collaborative interactions. The section elaborates on issues related to time ordering, spacing and the reduction of jitters during collaboration.
3.1 High resolution timing services
To ensure that messages are time-stamped as accurately as possible we have also incorporated a high
resolution timer service into the substrate. This high resolution timer works on the Windows, Linux and Solaris operating systems; here we have leveraged native libraries available on these systems along with the Java Native Interface to enable high resolution timers. On Solaris and Linux the gettimeofday() function is used to retrieve the current time in microseconds. It returns time since 1/1/1970; the resolution is hardware dependent and is usually around 1 microsecond. The
QueryPerformanceCounter on Windows is used to
get number of ticks; the number of ticks in one second is 3759545, which is around one per 279 nanoseconds. This returns ticks from the start of the machine, but does not have limitations as in the getTickCount() function, which rolls-over every 49 days. Note that this gives us better results than relying only on the Java call. The resolution of the System.currentTimeMillis() on Windows is around 15 milliseconds and 1 millisecond on Linux. We have measured the resolution of the high resolution timer to be around 3~4 microsecond.
3.2 Time buffering service
Jitter is considered to be one of the most important Quality of Service (QoS) measurements within A/V collaborative systems. In the case of audio streams, high jitter values can cause voice breaks while in the case of video streams high jitters may cause degenerations in the image quality. In order to overcome the negative effects of high jitter, real-time audio/video clients typically have a buffer which buffers events up to 200 milliseconds and then proceeds to release them. In order to reduce the effect of high jitters in large distributed networked environment we provide a buffer whose size can be customized based on an entity’s needs.
not met. The final criterion is the release factor of the buffer. This typically has a value between 0.5 and 1.0. When any of the release criteria is met, it releases at least
release_factor X total_bufer_sizemessages.
3.3 Time differential service
In collaborative systems simply receiving messages in time-order may not be enough. An entity may also place constraints on the maximum jitter that it is willing to tolerate. The Time Differential Service (TDS) provides two very important functions. First, it reduces the jitter in messages caused by the network. Second, it releases messages while preserving the time spacing between consecutive messages. Preserving time spacing between messages is not an easy task primarily because most operating systems do not provide strict real-time capabilities. Depending on the operating system, the scheduling of processes and threads does not necessarily guarantee the CPU for that process or thread after a specified interval. For example, using Java on the Windows operating system, user-level threads can obtain the CPU back only after 10 milliseconds. Based on the scheduling configuration of Linux operating system this duration can vary from 1 millisecond to 10 milliseconds or more.
One of the main reasons that TDS uses threads rather than traditional polling to release events in the queue is to avoid high CPU utilizations. In the case of polling, in order to release events in the queue their timestamps should be checked very frequently. This can lead to very high CPU utilizations. Furthermore, since rate at which events are generated is not constant: the time spacing between consecutive events vary. Using threads ensures that CPU utilizations are significantly lower. The reason that we have multiple threads instead of one thread to release the events in the queue is due to issues related to the underlying programming language (Java) and the operating system. For e.g. on Linux (Fedora 2), in order to check the timestamps every millisecond, we need to use at least three inter-leaving threads since each thread wakes up after a minimum of 3 milliseconds. On Windows, this value is 10 milliseconds; this high value may not be able to address jitter reduction adequately. .
TDS spawns five threads to process messages released by the buffering service. Note that TDS itself maintains another buffer for processing. Each thread is initiated one after another with a specified time difference between consecutive initiations. Each thread sleeps for a specified time-slice. By interleaving the durations at which these threads wake-up TDS can operate on the buffer at finer intervals while ensuring that CPU utilizations are low. The time-slice interval for
[image:6.595.325.527.262.538.2]individual threads impacts CPU utilization. We have observed that if the time interval between threads is 1 millisecond the CPU utilization stays around 5~6%, when this interval is decreased to 10 microseconds, it can reach about 20~25% on a Linux machine (1.5 GHz CPU 512 MB RAM). When a thread wakes up it checks to see if any messages need to be released, and does so if needed. It does so by comparing the message’s timestamp, the local clock obtained from the high resolution timer and the time at which the last message was released. By preserving the time-spacing between messages TDS reduces jitter significantly.
Figure 8: Experimental setup for TDS measurements
Figure 8 depicts the experimental setup for our TDS related measurements. The transmitter (publisher) captures the input-video stream from a camera and publishes them using NaradaBrokering messages, which are time-stamped appropriately. In the reported results, we ignored the first few messages that resulted in spikes due to media-player initializations.
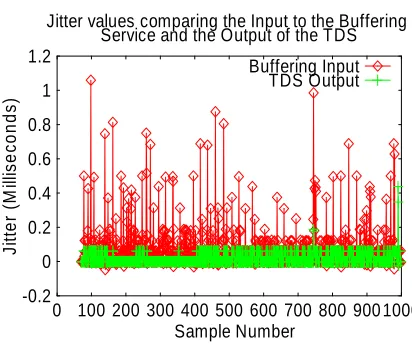
Figure 9 contrasts the jitters resulting from the experimental setup (1) involving machines at Cardiff and Indiana; the graph compares the jitters in the Input to the buffering service and the Output of the TDS. Please note that in the absence of the buffering service and TDS at a client, the jitters experienced at that node would be
Experiment 2:
Broker at Indiana (Red Hat Linux 3.2.3-6,
Intel® Xeon™ CPU 2.40 GHz, 2068240 KB, JVM :1.4.2_03),
Clients at Indiana: Red Hat 3.4.2-6.fc3
Intel® Pentium® 4 CPU 1.5 GHz, 1GB, JVM 1.4.2_07
Experiment 1:
Broker at Cardiff (Red Hat Linux 7.1 2.96-79, Pentium III, 1 GHz, 1.5GB RAM, JVM 1.4.1,
Clients at Indiana: Red Hat 3.4.2-6.fc3
Intel® Pentium® 4 CPU 1.5 GHz, 1GB, JVM 1.4.2_07
Broker
similar to that corresponding to the input of the buffering service.
-2 0 2 4 6 8 10 12
0 100 200 300 400 500 600 700 800 900 1000
J
it
ter
(
M
ill
is
e
c
on
ds
)
Sample Number
Jitter values comparing the Input to the Buffering Service and the Output of the TDS
[image:7.595.307.518.121.290.2]Buffering Input TDS Output
Figure 9: Jitter values comparing Buffering Service Input and TDS Output (Trans-Atlantic)
Figure 10 depicts only the jitters as a result of TDS for this experimental setup. The results demonstrate the significant reduction in jitter as a result of deploying the TDS.
-0.02 0 0.02 0.04 0.06 0.08 0.1 0.12 0.14
0 100 200 300 400 500 600 700 800 9001000
J
it
te
r (
M
ill
is
econ
ds
)
Sample Number
Jitter values from the output of the TDS
[image:7.595.64.273.142.329.2]TDS Output
Figure 10: Jitter values from the TDS Output (Trans-Atlantic)
We also performed measurements in the same experimental setup by varying the time-slice intervals associated with the threads spawned by the TDS. Here we report results (Figure 11) from our measurements for intervals of 1 millisecond and 100 microseconds. The results demonstrate that reducing the time intervals also reduces the jitter in the messages that are output by the TDS.
-0.05 0 0.05 0.1 0.15 0.2 0.25 0.3 0.35 0.4
0 100 200 300 400 500 600 700 800 9001000
J
it
te
r (
M
ill
is
e
c
o
n
d
s
)
Sample Number
Jitter values from the Output of the TDS Different Thread Intervals
1 millisecond 100 microseconds
Figure 11: Jitter values from the TDS output for different thread intervals (Trans-Atlantic)
We have also performed measurements within a local area network to profile the performance of TDS, the results reported here correspond to the experimental setup (2) depicted in Figure 8. Figure 12 contrasts the jitters in the input to the buffering service and the output of TDS. Once again, the results demonstrate jitter reduction even in cluster settings.
-0.2 0 0.2 0.4 0.6 0.8 1 1.2
0 100 200 300 400 500 600 700 800 900 1000
J
it
te
r (
M
ill
is
e
c
o
n
d
s
)
Sample Number
Jitter values comparing the Input to the Buffering Service and the Output of the TDS
[image:7.595.64.274.415.583.2]Buffering Input TDS Output
Figure 12: Jitter values comparing Buffering Service Input and TDS Output (Cluster setting)
[image:7.595.309.515.418.592.2]0 20 40 60 80 100 120 140 160 180 200
0 100 200 300 400 500 600 700 800 900 1000
J
it
te
r (
M
ic
ro
s
e
c
onds
)
Sample Number
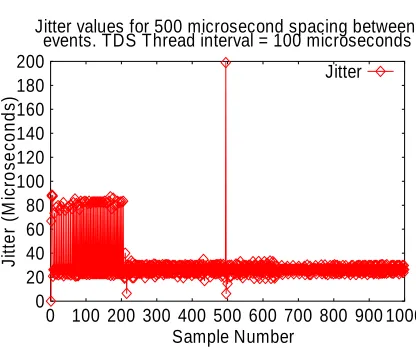
Jitter values for 500 microsecond spacing between events. TDS Thread interval = 100 microseconds
[image:8.595.65.273.116.291.2]Jitter
Figure 13: Jitter values for spacing messages with a fixed 500 microsecond spacing between them
4.
Related Work
There are several publish/subscribe systems that have been developed. While it is not possible to enumerate all of these works, some of these systems include Elvin [5], Sienna [6] and Gryphon [7]. An exemplar of publish/subscribe in the area of distributed object technology is the CORBA Event service [8]. Another area of interest is peer-to-peer (P2P) systems. Here, examples include the JXTA [9] system, Pastry [10] and FLAPPS [11, 12]. A comprehensive discussion of the architectural similarities, differences, strengths and weaknesses of these systems vis-à-vis capabilities available within the NaradaBrokering substrate can be found in Ref [4]. Examples of collaborative infrastructures include JSDT [13] from Sun Microsystems. JSDT provides the basic abstractions of a session and also supports full-duplex multi-point connections between entities. Additionally, JSDT provides a token-based distributed synchronization mechanism to facilitate access to shared resources.
5.
Conclusions
In this paper we presented results related to the substrate’s messaging communications. These experiments were performed in inter-continental settings involving the US, UK and Australia. We have also reported on tests performed using parallel TCP in WAN and trans-Atlantic settings. Finally, we also included discussions and results pertaining to new collaboration related services that were incorporated into the substrate.
References
[1] R. Fatoohi and N. Gokhale, A Distributed Job Execution Environment using Asynchronous Messaging and Web Technologies, Proceedings of the 5th International Conference on Enterprise Information Systems (Angers, April 2003), pp. 246-251, April 2003.
[2] The NaradaBrokering Project at the Community Grid Labs: http://www.naradabrokering.org
[3] Shrideep Pallickara and Geoffrey Fox. NaradaBrokering: A Middleware Framework and Architecture for Enabling Durable Peer-to-Peer Grids. Proceedings of ACM/IFIP/USENIX International Middleware Conference Middleware-2003.
[4] Shrideep Pallickara and Geoffrey Fox. On the Matching Of Events in Distributed Brokering Systems. Proceedings of IEEE ITCC Conference on Information Technology. April 2004. Volume II pp 68-76.
[5] Bill Segall and David Arnold. Elvin has left the building: A publish/subscribe notification service with quenching. In Proceedings AUUG97, pages 243–255, Canberra, Australia, September 1997.
[6] Antonio Carzaniga, et al Achieving scalability and expressiveness in an internet-scale event notification service. In Proceedings of the 19th ACM Symposium on Principles of Distributed Computing, pages 219–227 2000.
[7] G. Banavar et al. An Efficient Multicast Protocol for Content-Based Publish-Subscribe Systems. In Proceedings of the IEEE International Conference on Distributed Computing Systems, Austin, Texas, May 1999.
[8] The Object Management Group (OMG). OMG’s CORBA Event Service. Available from http://www.omg.org/ [9] Sun Microsystems. The JXTA Project and Peer-to-Peer
Technology http://www.jxta.org
[10]Antony Rowstron and Peter Druschel. Pastry: Scalable, decentralized object location and routing for large-scale peer-to-peer systems. Proceedings of Middleware 2001. [11]B. Scott Michel, Peter L. Reiher: Peer-through-Peer
Communication for Information Logistics. GI Jahrestagung (1) 2001: 248-256
[12]B. Michel and P. Reiher. Peer-to-Peer Internetworking. In OPENSIG, September 2001.
[13]Java Shared Data Toolkit (JSDT).