Abstract: Organizations these days are adopting information technology on a faster pace, but investing in IT does not guarantee improved organizational performance. Studying from the past researchers, this study suggests that in order to have improved organizational performance, it is important to improve the supply chain performance. Based on the data collected from various manufacturing companies, the present study focuses on these issues. The findings help in providing a new view point in evaluating IT investment in the supply chain practice.
Index Terms: Information technology, supply chain performance, organizational performance
I. INTRODUCTION
In today’s competitive environment there has been huge attention towards the use of information technology (IT) for managing their business processes and improving their supply chains. In most of the studies, manufacturers have been cherishing the use of IT for making their supply chain more agile, responsive, reduce cycle time, improve delivery performance and providing better services to customers.. However it has also been noticed that use of advanced IT does not guarantee improved organizational performance. The argument on the “IT-productivity” paradox suggests that it is uncertain how information technology affects supply chain (Brynjolfsson, 1993; Lucas & Spitler, 1999). Many firms adopt IT easily because of adoption by other firms but it fails to provide the competitive advantage which is sustainable.
The exclusive aim of this study is to study whether IT helps in improving that supply chain performance and organizational performance. From the literature it is proposed that organizational performance can be improved if IT is embedded throughout the supply chain process and improving the same thus helping in improving the organizational performance as whole (Powell & Dent- Micallef, 1997). The implementation of IT in supply chain can enable a firm to improve its supply chain cost performance, delivery performance, lead time performance, relationship with customers and suppliers, meeting the market demands which in turn help in improving organizational performance (Tippins and Sohi, 2003).
Secondly, we study the extent of IT usage through IT advancement and IT alignment and their role in providing
Revised Manuscript Received on May 05, 2019.
Roshanpreet Kaur, Research Scholar, Punjabi University, Patiala
Sarang Narula, Assistant professor, Punjabi University, Patiala
higher value for the firm. IT advancement refers to the extent to which latest technologies have been implemented in the organization while IT alignment refers to the integration and coordination of IT within its organization and with the supply chain partners.
Next we develop a new concept of supply chain performance as a second order construct consisting of 5 dimensions: supplier performance, operational performance, delivery performance, customer service performance and cost performance. Past literature has discussed one or few facets of capable supply chain (Frohlich, 2001; Leek, Turnbull & Naude, 2000). This study explains he framework that links IT related sources to supply chain performance and organizational performance
II. DIMENSIONSOFSUPPLYCHAIN PERFORMANCE
This section elaborates the dimension used in measuring supply chain performance and on what parameters it is well thought-out to be capable.
2.1 Supplier performance: supplier performance is said to maintain a long term and healthy relation with the suppliers. It helps in influencing the capabilities of the firm and helps them to achieve the competitive benefits. A good partnership with the suppliers helps in reducing the cost, reduce risk and seek continuous improvement. Effective supplier relationship can give immense benefits to the organization and also helps in maintaining a competitive edge.
2.2 Operational performance: Operational performance refers to as getting together the activities such as looking for good, purchasing them, storing and distribution. If the objectives set by the supervisors are met it will help in achieving the tactical objectives.
2.3 Delivery performance: Delivery performance can be improved by selecting suitable delivery channel, scheduling the vehicle, location of warehouse. Lead time reduction in deliver performance is one of the most important criteria to improve the delivery performance. A proper understanding delivery channels and schedule of operations can also help in improving the supply chain performance (Gelders et al., 1994).
Delivering on time is another measure of delivery performance as it also measures the customer service level.
2.4 Customer service performance: customers come from all across the globe and satisfying them is a critical job.
Information Technology and Organizational
Performance: The Role of Supply Chain
Performance
Customer satisfaction is an important measure for supply chain performance (Lee and Billington, 1992. Providing customers with genuine information about status of order, stock availability or delivery will help them to schedule their activities and in retaining the customers.
2.5 Cost performance: The cost of supply chain can be estimated by total logistics cost since logistics come across all the functions of supply chain it is important to evaluate cost critically since cost in one department affects the cost in other department (Cavinato, 1992). Hence it is important to evaluate cost in each activity and assessing its impact on other activity.
III. HYPOTHESISDEVELOPMENT IT Advancement
IT advancement can be understood as the extent to which the latest and updated technologies have been used in an organization. It measure the grade of positive adoption and application of advanced IT serve customers better than the competitors. Firms actively adopt advanced IT in order to improve their skills. But, higher investment in IT does not necessarily imply better organizational performance. However, it also appears that firm boosts their actions by indulging in progressive IT (Stank, Crum, & Arango 1999).a better and stronger supply chain can be built with the help of latest technologies. Adopting IT better than the competitors increases the chances of gaining some additional benefits. Advanced IT should be the consideration of company’s strategic importance in order to stay ahead of competitors.
Ha1: IT advancement affects supply chain performance positively.
Ha2: IT advancement affects organizational performance IT Alignment
IT alignment is explained as compatibility of IT with its channel partners. IT reflects the extent to which it is entrenched across the supply chain and how synchronized it is with each other so as to attain competence (Powell, 1992). Integration among the channel members is one of the hardest things to attain among the dealing associates. While aligning the activities the organization is able to improve its supply chain which otherwise is difficult to attain. IT alignment can help in proper flow of information and resources in and across the organization. It will enhance the responsiveness and collaboration of supply chain with its partners (Kearns & Leddrer, 2003).
Ha3: IT alignment affects supply chain performance positively.
Ha4: IT alignment affects organizational performance. Impact of supply chain performance on organizational performance
In this study the improved supply chain can help in improving the overall organizational performance. It helps in providing the cost benefit to the organization over the competitors. Investment in IT is widely regarded as having enormous potential for reducing cost and gaining competitive advantage. Organizational Performance has been defined as “How well a firm achieves its market oriented goals as well its
financial goals” (Deshpande, 2012; Kannana and Tan 2004). During the past decade a lot of attention has been paid on investment in IT but studies have generated controversial or inconsistent results. Some researchers assert that there no relation between IT and firm performance (Loveman, 1992) while some found a positive association between the two (Banker et al., Barua et al., 1995).
IT may be helpful in improving few aspects but will not improve all the aspects. Many studies have used only one parameter to measure the performance of organization and financial performance through ROA and ROS. Alone monetary investment in IT cannot determine the firm performance, the extent of IT adoption is important. IT enables a firm to effectively handle order entry system, inventory management and operational performance such as reducing the cycle time, less stock maintenance etc. With deeper adoption of IT stock levels can be reduced. Firms with new technologies can help them in producing goods more quickly thereby reducing the production cycle (Abemathy et al., 2000).
Ha5: Supply chain performance affects organizational performance positively.
IV. RESEARCHMETHODOLOGY
Sampling and data collection
The data is collected from manufacturing units of North India. The sample consisted of 200 units. The representing states were Punjab, Haryana and Delhi NCR. The respondents were the supply chain managers. But after the personal visit to the organizations, it was found that many organizations do not have the supply chain managers. Hence the data was collected from any manager from the entire supply chain.
Measurement, Reliability and validity
The processes suggested by Churchill (1979) were followed for the development of scale. All the constructs were clearly defined on the basis of what will be included and excluded. The measures which were appropriate for the study were accepted and adapted.
The items were measured using 5 point scale. The constructs for IT Advancement, IT Alignment were taken from Wu et al (2006), Kim et al (2006). The items in the construct of extent of IT use were adopted from Anderson and Segars (2001) and for supply chain performance measurement factors Gunasekaran (2004). The items in organizational performance were identified from article in literature review chapter and based on discussion with industry experts.
“Average Variance Extracted (AVE)” and “Composite Reliability (CR)”
Reliability is termed as consistency and reproducibility of the instrument toward the results which are consistent over a period of time on repeated trials. These are the tests which are
considered to be the best measure of inter item consistence reliability measure, that is, Cronbach’s Alpha(α) (Cronbach,1951; Nunnally,1979). The value of Cronbach alpha will be in the range of 0-1 and it is maximum when it is closer to 1.
Item Cronbach’s
Alpha
Std. loadings
AVE Composite
reliability
IT ADVANCEMENT 0.859 0.643 0.899
Our organisation always uses advanced IT solutions for SCM in our industry
0.706
Relative to competitors our IT for SCM is advanced 0.831 We are regarded as the IT leader in SCM in our industry 0.886
We are first to use IT in our industry 0.86
Out IT for SCM is state-of-art technology 0.707
IT ALIGNMENT 0.934 0.791 0.95
Our organisation’s IT for supply chain is well aligned with our channel members
0.828
Our organisation invests in IT to align with our channel members
0.888
Our channel members invest in IT to align with us 0.918 We work together with our channel members to invest in for
alignment
0.903
Our IT is best aligned for best supply chain performance 0.906
SUPPLY CHAIN PERFORMANCE 1 1 1
1. Customer service performance 0.576 0.844
Customer perceived level of value of product improved 0.785 Flexibility of service system to meet particular customer needs
improved
0.797
Range of products and services has increased 0.781
Customer query time reduced 0.665
2. Delivery performance 0.521 0.843
Delivery lead time reduced 0.779
Delivery performance improved 0.79
Responsiveness to urgent deliveries improved 0.627
Frequency of delivery is improved 0.664
Achievement of defect free deliveries increased 0.732
3. SCP cost performance 0.838 0.954
Information carrying cost reduced 0.933
Total transportation cost reduced 0.911
Manufacturing cost reduced 0.92
Inventory carrying cost reduced 0.897
4.SCP operational performance 0.511 0.861
Effectiveness of distribution planning schedule improved 0.661 Quality of deliver documentation is improved 0.638
Planned process cycle time is reduced 0.802
Effectiveness of master production plan is improved 0.819
Capacity utilisation increased 0.727
Total cash flow time reduced 0.616
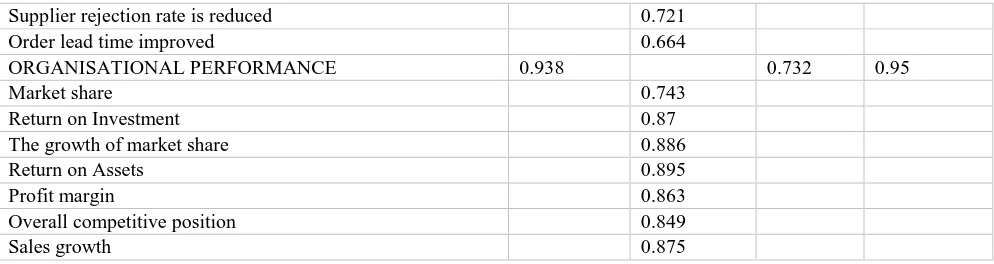
5. Supplier performance 0.508 0.892
Level of suppliers defect free deliveries has increased 0.745 Supplier assistance in solving technical problems has
improved
0.738
Supplier ability to respond to quality problems has improved 0.727 Supplier cost saving initiatives has improved 0.727
Supplier rejection rate is reduced 0.721
Order lead time improved 0.664
ORGANISATIONAL PERFORMANCE 0.938 0.732 0.95
Market share 0.743
Return on Investment 0.87
The growth of market share 0.886
Return on Assets 0.895
Profit margin 0.863
Overall competitive position 0.849
Sales growth 0.875
Composite reliability as a benchmark value of 0.7 is considered to be adequate where SEM is applied (Werts et al., 1978). Also, Joreskog’s (1971) composite reliability is studies along with Dijkstra-Henscler’s rho as a reliability estimate for reflective construct with multiple indicators in investigated ( Dijkstra and Henscler 2015).
Convergent validity
Studying the convergent validity is the next step to be followed. The convergent validity measures the degree of association of multiple items towards their constructs as per the theoretical background ad review of literature. (Hair et al., 2017)
The convergent validity is calculated through average variance extracted (AVE). It is measure as the mean of the square loadings of all variables within the construct, which must be higher than the acceptable value of 0.50 on an average in order to explain at least fifty per cent variance of the items in their construct.
In this study the AVE is fully established in the measurement model and is in harmony to the suggestions by
Hair et al., (2010, 2013), and mentioned in table 1. In addition to this, the composite reliability, AVE and standardised factor loadings were found to be above the desired cut off values and benchmarks in the leading researches (Chin 2010; Hair et al., 2017b) and mentioned in table 1.
Discriminant validity
[image:4.595.50.547.49.181.2]An empirical investigation of discriminant validity of the constructs was conducted in the study to find out as to how much distinct one construct is from one another in the path model. In major studies conducted by the researchers in the past, Fornell and Larcker (1981) criteria was used to compare each constructs square root of AVE with their inter construct correlation of all other constructs in the measurement model. Statistically, the square root of AVE must be higher than the inter construct correlations to establish discriminant validity of the variables under the study. In the present study, the Fornell and Lacker (1981) is fully acceptable to establish discriminant validity as mentioned in table 2.
Table. 2 Analysis
Fornell and Larcker Crietria IT Advancement IT Alignment Organisational Performance Supply Chain Performance
IT Advancement 0.802
IT Alignment 0.734 0.889
Organisational Performance 0.546 0.547 0.856
Supply Chain Performance 0.515 0.525 0.768 1
The HTMT ratio must be less than 0.90 (Gold, Malhotra and Srgars, 2001) or less than 0.85 (Kline, 2011) to establish the disattenuated correlation between two constructs
(Henseler, Ringle, and Sarstedt, 2015).Findings of HTMT criteria is mentioned in table 3.
Table. 3 Analysis
HTMT Criteria IT Advancement IT Alignment Organisational Performance
IT Alignment 0.837
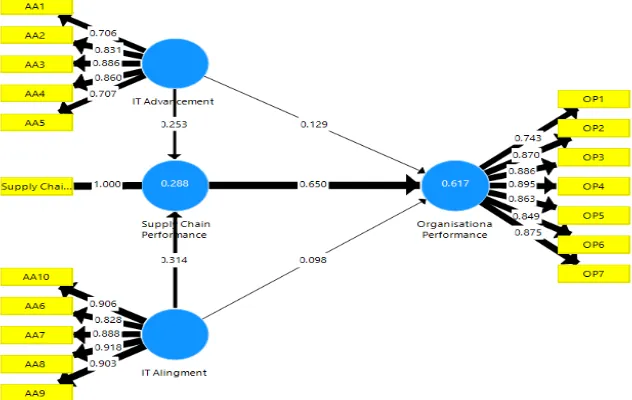
[image:4.595.53.554.472.546.2]From the above figure we can conclude that IT advancement and IT alignment have an impact on both supply chain performance and organizational performance. However it must be noted that the impact of IT on organizational performance is through supply chain performance. The B value of impact of IT advancement on organizational performance is 0.129 and of IT alignment on organizational performance is 0.098. But through supply chain performance is 0.650. The improvement in supply chain performance with the help of information technology has helped in improving the company’s return on assets, market share, sales growth, return on investment etc. Hence, there is indirect impact of IT
on organisational performance that goes through improved supply chain performance.
Structural model assessment
[image:5.595.141.457.56.256.2]After checking the reliability and validity of the construct, next step is to check the structural model assessment. However, a thorough examination of structural model for collinearity was also established to see whether the path coefficients based upon ordinary least square regression is free from the bias of collinearity (Hair et al 2014). The problem of multicollinearity does not exist in the structural model since all the VIF values are less than 5.
Table. 4 Analysis
VIF Values Organizational Performance Supply Chain Performance
IT Advancement 3.37 3.279
IT Alignment 3.42 3.279
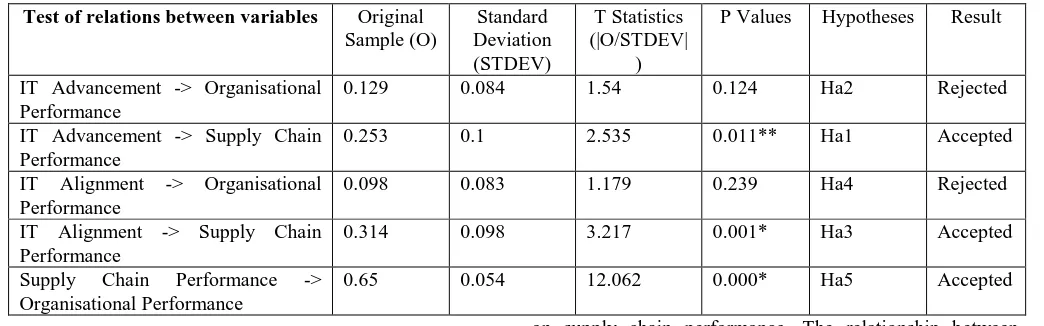
Table. 5 Hypothesis Testing and Discussion of Results Test of relations between variables Original
Sample (O)
Standard Deviation (STDEV)
T Statistics (|O/STDEV|
)
P Values Hypotheses Result
IT Advancement -> Organisational Performance
0.129 0.084 1.54 0.124 Ha2 Rejected
IT Advancement -> Supply Chain Performance
0.253 0.1 2.535 0.011** Ha1 Accepted
IT Alignment -> Organisational Performance
0.098 0.083 1.179 0.239 Ha4 Rejected
IT Alignment -> Supply Chain Performance
0.314 0.098 3.217 0.001* Ha3 Accepted
Supply Chain Performance -> Organisational Performance
0.65 0.054 12.062 0.000* Ha5 Accepted
Path Co-efficient (*p<0.01, **P<0.05)
Table 5 shows the hypothesis testing along with the t values. The relationship between IT advancement and organisational performance is not significant with B=0.129, t-value=1.54 and p=0.124. Since the p value is more than 0.05 Ha2 is rejected explaining that IT advancement has no significant impact on organisational performance. The relationship between IT advancement and supply chain performance is significant with B=0.253, t-value= 2.535 and p=0.011 at 5% level of significance. Hence Ha1 is accepted explaining that IT advancement has positive significant impact on supply chain performance. The relationship between IT alignment and organisational performance is not significant with B=0.098, t-value= 1.179 and p=0.239. Since the p value is more than 0.05 Ha4 is rejected explaining that IT alignment has no significant impact on organisational performance. The relationship between IT alignment and supply chain performance is significant with B=0.314, t-value=3.217 and p=0.001. Hence Ha3 is accepted explaining that IT alignment has positive significant impact
on supply chain performance. The relationship between supply chain performance and organisational performance is significant with B=0.65, t-value= 0.054 and p= 0.000. Hence Ha5 is accepted explaining that IT-enabled supply chain has positive impact on organisational performance.
The Beta values of each path in the conceptual model were compared, it is found that hypothetical path Ha5 has the higher path co-efficient of 0.65 which indicates that IT-enabled supply chain has a significant impact on organisational performance.
Measuring the Value of R2
R2 is the assessment of the coefficient of determination which is an essential criterion. According to Chin (1998) the values of R2 should be as follows:
[image:6.595.46.544.506.556.2]0.67= substantial 0.33= moderate 0.19= weak
Table. 6 Analysis
R Square R Square Adjusted T Statistics (|O/STDEV|) P Values
Organisational Performance 0.623 0.617 12.8 0.000***
Supply Chain Performance 0.295 0.288 4.068 0.000***
Effect Size F2
The impact of each independent construct on dependent construct is measure through f2. According to Cohen 1988, the
[image:6.595.84.517.621.691.2]effect of independent construct is large if f2 is 0.35, medium if f2 is 0.15 and small if f2 is 0.02 and the results are tabulated in table 7.
Table. 7 Analysis
f square Organizational Performance Supply Chain Performance
IT Advancement 0.013 0.028
IT Alignment 0.007 0.043
Organisational Performance
Supply Chain Performance 0.789
The analysis of the effect size revealed that supply chain performance has a large effect on organisational performance. IT advancement and IT alignment have small
Predictive Relevance of the Model
After hypothesis testing in Structural Model, the predictive relevance of endogenous constructs was analysed through blind folding process. In blind folding process every 6th item in the data set was omitted and substituted by the other vales to establish cross-validated redundancy values for IT adoption as an endogenous construct. The predictive
relevance is computed by the value of Q2. . The formula for calculating the value of Q2 is: Q2= (1-SSE/SSO)
(SSE= sum of square errors; and SSO= sum of squares totals) The rule of thumb for measuring predictive power is as below:
[image:7.595.80.518.172.254.2]- 0.02≤ Q2≤0.15: Weak predictive power - 0.15≤ Q2≤0.35: Moderate predictive power - Q2≥0.35: Strong predictive power
Table. 8 Analysis
Q Square SSO SSE Q² (=1-SSE/SSO)
IT Advancement 1,000.00 1,000.00
IT Alignment 1,000.00 1,000.00
Organisational Performance 1,400.00 821.391 0.413
Supply Chain Performance 200 144.675 0.277
In the path model, the predictive relevance organizational performance has a value of 0.413 which indicates that the model has strong predictive power.
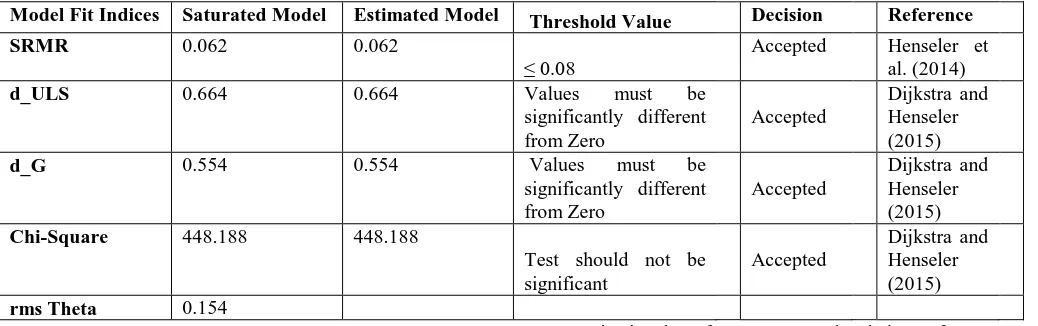
Goodness of fit indices
The goodness-of-fit measures available in PLS-SEM are Standardized Root Mean Square Residual (SRMR) and Normed Fit Index (NFI). SRMR’s efficacy for PLS-based model evaluation has not been fully explored yet in the field of social sciences, however it is better than the traditional Normed fit index (NFI), which computes the Chi-square
value of the proposed model and compares it against the null model. Two additional measures of exact model fit is also calculated in the study, that is, Geodesic distance (dG = standard; dG2 = square root) and unweighted least squares discrepancy (dULS). The value of dG and dULS in itself do not pertain to any value, however, it computes confidence interval and check whether the original value falls into the 95% confidence interval; if not, reject the model. In this study, the tests and all threshold values along with their final decisions are mentioned in Table 9 as below:
Table. 9 Analysis
Model Fit Indices Saturated Model Estimated Model Threshold Value Decision Reference
SRMR 0.062 0.062
≤ 0.08
Accepted Henseler et al. (2014)
d_ULS 0.664 0.664 Values must be
significantly different from Zero
Accepted
Dijkstra and Henseler (2015)
d_G 0.554 0.554 Values must be
significantly different from Zero
Accepted
Dijkstra and Henseler (2015)
Chi-Square 448.188 448.188
Test should not be significant
Accepted
Dijkstra and Henseler (2015)
rms Theta 0.154
V. DISCUSSION AND IMPLICATIONS
The study explored the role of information technology in affecting supply chain performance and organizational performance. Results indicate that IT plays a major role in improving the supply chain performance of the organization. It also affects the organizational performance but through supply chain performance and there is minimal direct effect of IT on organizational performance. The well aligned IT in supply chain will help in improving the overall company’s performance. A higher level of firm’s improved supply chain grants the firm with gaining higher organizational performance. The study suggest that by incorporating supply chain performance as a mediator will help to better explain the impact of IT on organizational performance. It provides explanation that why there are unreliable direct results of IT
on organizational performance. Supply chain performance can help in better understanding the effect of IT on organizational performance.
REFERENCES
1. Brynjolfsson, E. (1993). The productivity paradox of information technology. Communications of the ACM, 36 (12), 67-77.
2. Lucas Jr., H.C. & Spitler, V.K. (1999). Technology use and performance: A field study of broker workstations. Decision Sciences, 30 (2), 291-311.
[image:7.595.42.561.417.580.2]4. Tippins, M.J., & Sohi, R.S. (2003). IT competency and firm performance: is organisational learning a missing link? Strategic Management journal, 24(8), 745-761.
5. Frolich, M.T. (2002). E-integration in the supply chain: Barriers and performance. Decision Sciences, 33(4), 537-556.
6. Leek, S., turnbull, P. W., & Naude, P. (2003). How is information technology affecting business relationships? Results from a UK survey. Industrial marketing Management, 32(2), 119.
7. Sturat F.I. (1997), Supply-chain strategy: organisational influence through supplier alliance. British Academy of Management, 8(3), 223-36.
8. Balsmeier, P.W., Voisin, W. (1996), Supply chain management: a time based strategy. Industrial Management, 38(5), 24-7.
9. Monczka PM, Peterson KJ, Handfeild rB, Ragatz GL. (1998).Success factors in strategic supplier alliances: the buying company perspective. Decision Science, 29(3) 5553-77.
10. Sheridan JH. The supply chain-paradox, Industry Week 1998, 247(3), 20-9.
11. Noble D. Purchasing and supplier management as a future competitive edge. Logistics Focus 1997, 5(5), 23-27.
12. Gunasekaran A, Patel C, Tirtiroglu E. Performance measures and metrics in a supply chain environment. International journal of Operations and production management 2001, 21(1/2), 71-87. 13. Yoshino M, rangan S. Strategic alliances: an entrepreneurial approach to
globalization. Boston, MS: Harvard business School Press, 1995. 14. Tan KC, layman SB, Wisner JD. Supply chain management: a strategic
perspective. International Journal of Operations and Production Management 2002, 22(6), 614-31.
15. Gelders, L., Mannaerts, p. and Maes, J. (1994), Manufacturing strategy, performance indicators and improvement programs”. International Journal of Production Research, Vol. 32 (4), 797-805.
16. Stewart, G. (1995), Supply chain performance benchmarking study reveals keys to supply chain excellence. Logistics Information management, 8(2), 38-44.
17. Lee, HL and Billington c (1992). Managing Supply chain inventory: pitfalls and opportunities. Sloan management Review, Springer 65-73. 18. Barney J, Wright M & Ketchen Jr., D.J. (2001). The resource-based
view of the firm: Ten years after 1991. Journal of Management, 27(6) 625-641.
19. Taylor, D.A (2003). Supply chain vs. supply chain. Computerworld, 37(45), 44-45.
20. Mukhopadhyay, T., Rajiv, S., & Srinivasan K, (1997). Information technology impact on process output and quality. Management Science, 43(12), 1645-1659.
21. Stank, T., Crum, M., & Arango, M (1999). Benefits of interfirm coordination in food industry supply chains. Journal of Business Logistics, 20(2), 21-41.
22. Booth, M.E., & Philip, G. (1998). Technology, competencies and competitiveness: The case for reconfigurable and flexible strategies. Journal of business research, 41(1), 29-40.
23. Clemons, E.K., row, m.C. (1993). Limits to interfirm coordination through information technology: Results of a Field study in consumer packaged goods distribution. Journal of Management Information Systems, 10(1), 73-95.
24. Malone, T.W., Yates, j., & Benjamin, R.I.,(1987). Electronic markets and electronic Hierarchies. Communications of the ACM, 30(6), 484-497.
25. Rogers, D.S, Daughtry, P.L., & Stank, T.O. (1993). Enhancing service responsiveness: the strategic potential of EDI. Logistics Information management, 6(3), 27-32.
26. Powell, T.C., (1992). Organisational alignment as competitive advantage. Strategic Management Journal, 13(2), 119-134.
27. Hausman, A., & Stock, J. R. (2003). Adoption and implementation of technological innovations within long-term relationships. Journal of Business Research, 56(8), 681-686.
28. Byrd, A.T., and Davidson, N.W. (2003). Examining possible antecedents of IT impact on the supply chain and its effect on firm performance. Information and Management, Vol 41, 243-255. 29. Chaow, W.S., Madhu, C.N., Kuei, C-H., Lu, M. H., Lin,C., & Tseng, H.
(2006). Supply chain management in US and Taiwan: An empirical study. The International Journal of Management Science, Vol. 38. 665-679.
30. Li, S., Ragu-Nanthan, B.,Ragu-Nanthan, T., & Subba rao, S. (2006). The impact of supply chain management practices on competitive
advantage and organisational performance. The International Journal of Management Science, 34, 107-124.
31. Deshpande, A. (2012). Supply chain management dimensions, supply chain performance and organisational performance: An integral framework. International journal of business management, 7(8). 32. Anderson, T.J. & Segrs, A.H. (2001). The impact of IT on decision
structure and firm performance: evidence from the textile and apperal industry. Information & Management 39(2), 85-100.
33. Hair, J.F., Ringle, C.M., & Sarstedt, M. (2013), Partial least square structuralequation modelling: Rigorous applications, better results and higher acceptance. Long range planning. 46(1/2), 1-12.
34. Hair, J.F., Jr., Sarstedt, M.., Hopkins, L, & Kuppelwieser, V. (2014). Partial least squares structural equation modelling (PLS-SEM): An emerging tool in business research. European Business Review. (in press).
35. Hair, J.F., Hollingsworth, C.L., Randolph, A.B. and Chong, A.Y.L. (2017b), An updates and expanded assessment of PLS-SEM in information system research”, Industrial Management and Data systems, 117, 442-458.