Version: Accepted Version
Article:
Ruddle, RA, Thomas, RG, Randell, RS et al. (2 more authors) (2015) Performance and interaction behaviour during visual search on large, high-resolution displays. Information Visualization, 14 (2). 137 - 147. ISSN 1473-8716
https://doi.org/10.1177/1473871613500978
[email protected] https://eprints.whiterose.ac.uk/ Reuse
Unless indicated otherwise, fulltext items are protected by copyright with all rights reserved. The copyright exception in section 29 of the Copyright, Designs and Patents Act 1988 allows the making of a single copy solely for the purpose of non-commercial research or private study within the limits of fair dealing. The publisher or other rights-holder may allow further reproduction and re-use of this version - refer to the White Rose Research Online record for this item. Where records identify the publisher as the copyright holder, users can verify any specific terms of use on the publisher’s website.
Takedown
If you consider content in White Rose Research Online to be in breach of UK law, please notify us by
Performance and interaction behaviour during
visual search on large, high-resolution displays
Roy A. Ruddlea, Rhys G. Thomasa, Rebecca S. Randellb, Phil Quirkecand Darren Treanorc,d
aSchool of Computing, University of Leeds, Leeds LS2 9JT, UK b
School of Healthcare, University of Leeds, Leeds LS2 9JT, UK
cLeeds Institute of Molecular Medicine, University of Leeds, Wellcome Trust Brenner Building, St. James’s
University Hospital, Leeds LS9 7TF, UK
dSt. James’s University Hospital, Leeds Teaching Hospitals NHS Trust, Leeds LS9 7TF, UK
Corresponding author: Roy Ruddle
Email: [email protected] Telephone: +44 (0)113 343 1711
Abstract
Large, high-resolution displays (LHRDs) allow orders of magnitude more data to be visualized at a time than ordinary computer displays. Previous research is inconclusive about the circumstances under which LHRDs are beneficial and lacks behavioural data to explain inconsistencies in the findings. We conducted an experiment in which participants searched maps for densely or sparsely distributed targets, using 2 million pixel (0.4m × 0.3m), 12 million pixel (1.3m × 0.7m) and 54 million pixel displays (3.0m × 1.3m). Display resolution did not affect the speed at which dense targets were found, but participants found sparse targets in easily identifiable regions of interest 30% faster with the 54-million pixel display than with the other displays. This was because of the speed advantage conferred by physical navigation and the fact that the whole dataset fitted onto the 54-million pixel display. Contrary to expectations, participants found targets at a similar speed and interacted in a similar manner (mostly short panning movements) with the 2- and 12-million pixel displays even though the latter provided more opportunity for physical navigation, though this may have been because panning used velocity-based control. We are applying these findings to the design of a virtual microscope for the diagnosis of diseases such as cancer.
Keywords
Introduction
Large, high-resolution displays (LHRDs) are typically constructed from a matrix of ordinary computer displays, providing an overall display that is the physical size of the one that is produced by a classroom projector, but with a resolution that is orders of magnitude greater. This means LHRDs have great potential for large-scale data visualization1, and example applications have been developed for domains such as the earth sciences2, engineering3, astronomy4, national security5and medicine6.
Our interest centres on the possibility of histopathologists using LHRDs to diagnose diseases such as cancer. Histopathology is the science of diagnosing diseases by examining thin sections of tissue, which histopathologists perform by sectioning the tissue onto glass slides and examining the tissue under a microscope. Histopathologists navigate a slide by changing microscope lenses to zoom and turning knobs on the microscope stage to pan. Microscope navigation resembles ‘virtual’ navigation on a computer (navigating with an interface device such as a keyboard, mouse or gamepad) because lens changes are discrete like pressing a key, and turning the knob on a stage is similar to using a mouse scroll wheel (indeed some stages are motorized). Glass microscope slides can be digitally scanned to show the cellular detail that is necessary for diagnosis, but the resulting images are extremely large (up to 180,000 × 100,000 pixels for standard-sized (75 × 25 mm) glass that is scanned at 400× magnification). The process is high-volume (in our region’s cancer centre the 39 consultants inspect 250,000 slides per year7) and virtual slides have the potential to make it more efficient by streamlining workflows and avoiding the need to physically transport glass slides to another hospital to obtain specialist second opinions8, 9. However, one show-stopper that currently prevents histopathology from ‘going digital’ is that histopathologists take substantially longer to make a diagnosis from a virtual slide than with a glass slide10. One key reason for this is that a computer display would need to contain at least seven million pixels (and possibly more) to show the same amount of tissue in the same detail as a conventional microscope11.
54 million pixel displays. These display resolutions were chosen because one screen on our display wall is 2 million pixels, the whole display wall is 54 million pixels (28 screens), and 12 million pixels is approximately half way between the other resolutions and occupies a whole number of screens (6 screens). The following sections summarise previous research into the benefits of LHRDs for different types of visualization task, and then reports the experiment.
Figure 1. A 4 × 3 kilometre extract of a 1:50000 Ordnance Survey map with 10 places of worship marked. The map legend shows the three symbols that are used for places of worship. © Crown Copyright ED 100018888.
Large high-resolution displays
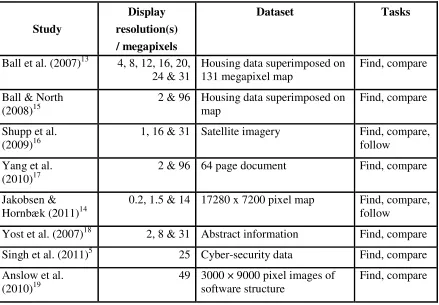
Three broad categories of visualization tasks are finding, following, and comparing information. Finding involves locating a feature or pattern, following involves moving along a feature (e.g., from one end of a road to another), and comparing involves identifying similarities or differences between two or more features/patterns14. Studies that investigated the effect of display resolution on users’ performance in these types of task are summarized in Table 1. The sometimes contrasting findings of these studies and theoretical benefits of LHRDs are discussed below. As well as display resolution, other factors that affect performance include the interaction devices and techniques that participants use, the scale of the data, the number and distribution of interesting features, and the details of the tasks that participants perform. The studies below do not report sufficient information for a complete assessment to be made about these factors, but some key details are noted.
Study
Display resolution(s) / megapixels
Dataset Tasks
Ball et al. (2007)13 4, 8, 12, 16, 20, 24 & 31
Housing data superimposed on 131 megapixel map
Find, compare
Ball & North (2008)15
2 & 96 Housing data superimposed on map
Find, compare
Shupp et al. (2009)16
1, 16 & 31 Satellite imagery Find, compare, follow
Yang et al. (2010)17
2 & 96 64 page document Find, compare
Jakobsen & Hornbæk (2011)14
0.2, 1.5 & 14 17280 x 7200 pixel map Find, compare, follow
Yost et al. (2007)18 2, 8 & 31 Abstract information Find, compare Singh et al. (2011)5 25 Cyber-security data Find, compare Anslow et al.
(2010)19
49 3000 × 9000 pixel images of software structure
[image:5.595.81.520.326.631.2]Find, compare
For finding tasks LHRDs may be advantageous in two main ways. First, if highly salient information is being sought then displaying more data increases the likelihood that the information concerned will be within the display’s bounds and, therefore, is seen to visually ‘pop out’ without the display having to be systematically searched. That was the case in a subjective study where participants commented on the way that a 49 megapixel display let interesting features stand out at a glance of an eye19. Second, the greater a display’s resolution the faster that users will be able to dismiss uninteresting parts of a dataset, and focus their efforts on regions of interest, again without having to make a detailed search of the whole display.
A generally reported result is that participants find targets significantly faster as the display resolution increases, but the details of specific studies’ results are worthy of comment. In some studies13, 15 participants panned and zoomed to find any one of several targets on a map that matched certain criteria (e.g., a house within a certain price range). At full resolution the map contained 20 – 27 houses/megapixel, but the percentage of houses that matched the criteria is not reported. The time that participants took decreased steadily as the display resolution increased, and it was on this basis that the advantage of physical navigation compared with virtual navigation was highlighted,. In another study participants searched satellite imagery for a unique target. A significant difference only occurred when the target was salient, and was caused by participants taking more than twice as long with a 1 megapixel display compared with 16 or 31 megapixel displays16. When the targets were less salient participants failed to complete 26% of the trials and there was no significant difference between displays. Thus, the evidence suggests that LHRDs may only be advantageous for finding when targets are salient and, therefore, straightforward to find. It is also worth noting that studies which did not find significant differences either involved a text (rather than graphical) dataset17, or required participants to pan and zoom to an indicated target rather than find an unknown one14.
that was three times larger than the width of the highest-resolution display16. When the road was salient participants performed significantly faster with a 31 megapixel display than with a 16 megapixel display, but performance with a 1 megapixel display was, surprisingly, in-between. When the road was less salient and required close inspection, participants failed to complete the task in almost half the trials, irrespective of the display resolution. In other words and contrary to expectations, neither of these studies shows that a high-resolution display is advantageous for following tasks compared with an ordinary desktop display.
For comparison tasks the increased resolution may reduce the cognitive effort that is involved because comparisons can be made with small, rapid physical movements of a user’s head or body, rather than requiring virtual navigation. Despite this, most studies reported non-significant differences13, 14, 16, 17, and in only one study did participants complete comparison tasks faster as the display size increased15. The nature of the comparison varied. One study allowed participants to move pages of a document together to facilitate comparison17. Other studies’ all involved attributes of houses (e.g., price or number of bedrooms), and the tasks ranged from involving a direct comparison of three houses14, to identifying localised patterns15 and global patterns among many houses13. Additional studies that employed comparison tasks had different aims. One increased the quantity of abstract data in proportion to the display size to investigate the scalability of visual encoding, which meant that task performance times cannot be directly compared18. A second gathered subjective feedback that highlighted the potential benefit of LHRDs for helping users refer back to previous steps during extended sessions of visual cybersecurity data analysis5.
Experiment
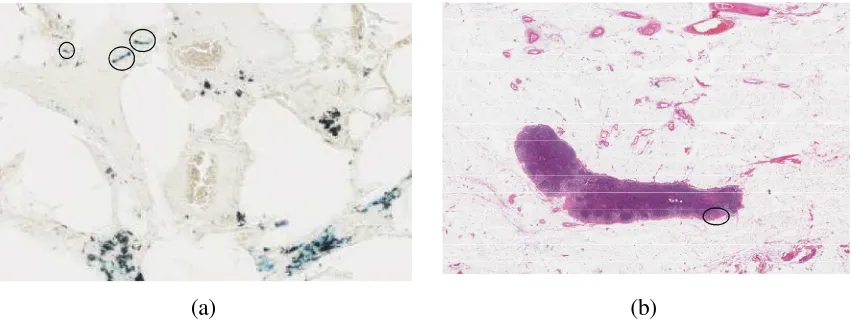
The experiment used a within-participants design to investigate the effect of display resolution (2 vs. 12 vs. 54 million pixels) on participants’ ability to find targets under two distinct sets of circumstances. These were when targets were: (a) densely distributed (exhaustive search required), or (b) in easily identifiable regions of interest. The targets were places of worship on maps, but the circumstances have similarities with common types of histopathology case. The dense circumstance occurs when histopathologists look for asbestos particles on a lung biopsy (see Figure 2a), conducting a comprehensive search using a lawnmower pattern (searching systematically in adjacent strips) because it is not possible to predict where on a slide the particles are likely to be. On the other hand, when searching a lymph node for metastatic cancer (a cancer that has spread from another place in the body) a histopathologist typically identifies regions of interest at a medium magnification (see Figure 2b), and then inspects those regions at a high magnification to confirm or deny the presence of cancer. A hematoxylin and eosin (H&E) stain (the most widely used chemical stain in medical diagnosis) marks both normal and cancerous tissue pink/purple, but the cancerous tissue has a different texture.
[image:8.595.86.512.413.577.2](a) (b)
Our hypothesis was that, as identifiable regions of interest became more apparent, participants would find targets faster with increased display resolutions. In other words, there would be a significant target density × display resolution interaction for the time participants took to find targets.
Method
Participants. Thirteen individuals (11 men; 2 women) with a mean age of 31 years (SD = 13.9) took part, one being a replacement for a participant who missed a large percentage of targets (see Results). All the participants gave informed consent and were paid for their participation. The study was approved by the Faculty Ethics Committee.
Figure 3. An Ordnance Survey map shown on the display wall used in the experiment. © Crown Copyright ED 100018888.
Three display conditions were used during the experiment: 28 screens (the whole display; 11,200 × 4,800 pixels; 54 million pixels in total; display dimensions 3.0m × 1.3m ), six screens at the centre of the display (4,800 × 2,400 pixels; 12 million pixels in total; 1.3m × 0.7m), and a single screen at the centre of the display (1,600 × 1,200 pixels; 2 million pixels in total; 0.4m × 0.3m). All three display conditions required participants to stand. In the 2 and 12 megapixel conditions the map needed to be panned on the display (see below). In the 54 megapixel condition the whole map was shown at once on the display and panning was disabled so that participants had to use a physical navigation strategy.
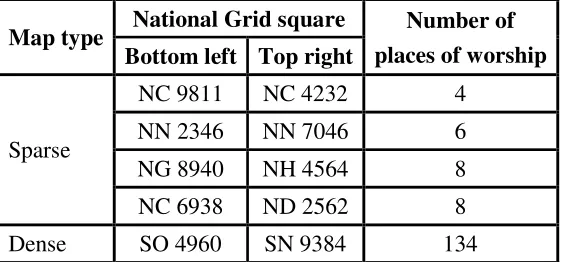
Eight maps of regions of UK were extracted from digital 1:50,000 scale Ordnance Survey data. Each map was 11,200 × 4,800 pixels (the same resolution as the 54 megapixel display), and covered a 56 × 24 kilometre area that was primarily land (lakes were permitted, seas were not). Four of the maps were densely populated with places of worship, and four were sparsely populated with places of worship and contained few roads (see Table 2). On all the maps, the places of worship were located alongside roads. The locations of the places of worship were recorded in a text file prior to the commencement of the experiment. One dense and one sparse map were used for training, and the other three maps of each type were used during the test phase of the experiment. From here onward, places of worship are termedtargets.
Participants were tracked using an Ascension Flock of Birds (Ascension Technology Corporation, Milton, VT, USA) with two sensors. One of the sensors was attached to a head band that participants' wore to track their position and orientation in 3D space, so the part of the display they looked at could be determined.
Map type National Grid square Number of
places of worship Bottom left Top right
Sparse
[image:10.595.159.441.528.659.2]TL 6187 TG 1711 214 SO 1183 SJ 6707 161 SN 1222 SN 4668 220
Table 2. Location of each map within the UK National Grid (for a detailed explanation, see20), and the number of places of worship on each map. The first sparse and dense maps in the table were used for training.
The second sensor was mounted within a Virtual Presence 3D mouse (see Figure 4), which had a thumb-operated joystick, a trigger, and three buttons. In the 2 and 12 megapixel display conditions, participants could pan the map at a fixed speed of 1000 pixels/second by moving the joystick to the left, right, up or down. Movement of the 3D mouse controlled a 60 pixel diameter, 50% transparent, red "aiming" disk on the display (see Figure 5), which participants used to indicate the target locations on the map. When participants pressed the 3D mouse trigger a marker of the same size and colour as the “aiming” disk was placed on the map. One of the 3D mouse buttons acted as a clutch, to allow the participants to adjust the offset between the 3D mouse's physical position and the aiming disk. This avoided participants having to stretch to reach targets at the extremes of the display and allowed participants to compensate for any tracking drift that occurred. Another button reset the offset. The experimenter remained present throughout the experiment to monitor the attachment of the tracking sensors.
Joystick
Trigger
Buttons
[image:11.595.206.391.469.603.2]Figure 5. The red aiming disk positioned on top of one of the targets.
Procedure. Each participant first performed the experiment with one display condition (e.g., 2 megapixels), then a second (e.g., 12 megapixels) and then the third (e.g., 54 megapixels). For each display condition, the participant performed some training and then conducted two test trials (sparse then dense, or dense then sparse). A Latin square design was used to balance the order in which participants performed the three display conditions and target densities (sparse vs. dense), and the particular map that a participant used with a given display condition. Participants took a five minute break after the training and test trials with each display condition, and took an average of three hours to complete the whole experiment.
The training for each display condition was as follows. First, a participant was shown the controls to be used for the display. Then the participant searched a quarter of the sparse training map and a quarter of the dense training map for targets. A different quarter was used for each display condition. The participant was told the strategy that they should use, which with sparse maps was to find the roads and search along them to identify the targets, and on dense maps was to conduct an exhaustive search of the map by examining each grid square (200 × 200 pixels on the display) in turn. After searching each training map the 54 megapixel display was used to show participants the targets they had successfully found (circled in green), had missed (black) and places they had selected that were not near a target (red).
Results
The results are divided into two parts. First we report participants’ performance in terms of accuracy and time in the three sparse and three dense test trials that each participant conducted. Then for the sparse trials we report participants’ interaction behaviour, to explain the underlying causes of significant differences in the performance data.
Accuracy and time. The following procedure was used to determine the number of targets that a participant correctly identified during a trial. Software was written to render the map on the 54 megapixel display, with markers superimposed on the map to indicate every target and the centre of the aiming disk each time the 3D mouse trigger was pressed. Due to the locations of the targets, sometimes the trigger position was close to just one target, whereas on other occasions there was a cluster of targets and trigger positions (typically the same number of trigger positions as targets). Through a partly automated process, trigger positions were allocated to targets provided the distance between the target and the trigger position was within a 200 pixel threshold. This left a total of only 20 ‘false’ trigger positions across the 39 test trials, compared with 6901 that were matched to a specific target. Four of the false trigger positions occurred in one trial when the participant selected large cross-shaped symbols that were not targets.
One participant missed more than 30% of targets on four of the six test trials, and was replaced in the experiment. The remainder of the Results only report data for the 12 participants who were retained. Those participants found an average of 87% of targets in the dense trials (SD= 9.4%) and an average of 89% in the sparse trials (SD= 13.0%). Most of the missed targets were of the type that had no tower, spire, minaret or dome (see Figure 1).
The percentage of targets that participants successfully found was analysed using an analysis of variance (ANOVA) that treated the display (2 vs. 12 vs. 54 megapixels) and target density (sparse vs. dense) as repeated measures. This showed no significant difference between the displays,F(2, 22) = 1.27,p > .05, p2= .10, or target densities,F(1,
11) = 1.30, p > .05, p2= .10. Means for the dense targets were 90%, 85% and 86% (2, 12
and 54 megapixel displays, respectively), and for the sparse targets were 88%, 86% and 93% (2, 12 and 54 megapixel displays, respectively).
target (divide the trial time by the number of targets found). The former is sensitive to differences between the numbers of targets that were on the maps, whereas the latter does not directly take account of the distribution of the targets across a display (participants are ‘rewarded’ more for finding a cluster of targets than a single outlying target). Data for both methods were analysed using an ANOVA that treated the display (2 vs. 12 vs. 54 megapixels) and target density (sparse vs. dense) as repeated measures. The pattern of results was the same for both methods, so only method (b) is reported here. Means for the dense targets were 12.5, 10.7 and 13.9 seconds (2, 12 and 54 megapixel displays, respectively), and for the sparse targets were 69.9, 69.6 and 49.1 seconds (2, 12 and 54 megapixel displays, respectively). There was not a significant difference between the displays, F(2, 22) = 3.08, p > .05, p2 = .22, but there was a significant effect of density, F(1, 11) = 66.80, p < .001, p2 = .86, and a significant display × density interaction, F(2,
22) = 3.65,p < .05, p2= .25. This was caused by participants taking substantially less time
to find targets on the 54 megapixel display than on the other displays (see Figure 6), which was partially consistent with our hypothesis (to be fully consistent, the 12 megapixel display time should have been faster than the 2 megapixel display time but slower than the 54 megapixel display time).
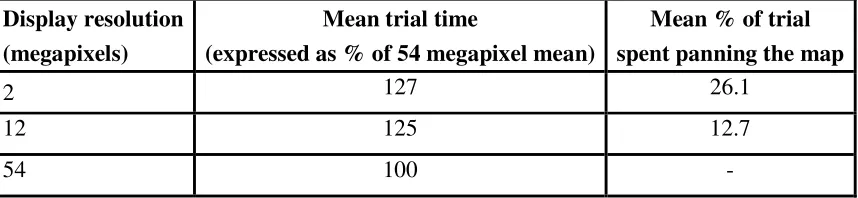
similar for all three display conditions (see Figure 7), indicating that participants were able to dismiss large areas of the map with a small (2 megapixels) display as quickly as they could on the large (54 megapixels) display. In other words, although participants did find targets faster with the 54 megapixel display, the underlying reason was contrary to our expectation.
Figure 6. Average time taken to find each target. Error bars show the standard error of the mean.
Figure 7. Percentage of a sparse target map that participants had gazed at as a test trial progressed.
Display resolution (megapixels)
Mean trial time
(expressed as % of 54 megapixel mean)
Mean % of trial spent panning the map
2 127 26.1
12 125 12.7
54 100
-Table 3. Trial time and % time spent panning (sparse trials only). The 54 megapixel trials took an average for 333 seconds.
[image:16.595.86.515.385.484.2]brief intervals (< 0.5s) and longer periods (> 2.0s), with similar distributions for the 2 and 12 megapixel displays (see Figure 9). Therefore, our explanation of the similarity between participants’ behaviour with the 2 and 12 megapixel displays is as follows. If participants made large pans with the 12 megapixel display then they would have to search the whole display each time it was stationary and, after the next pan, physically move to reposition their gaze from one corner of the display to the opposite corner. However, by making small pans participants reduced to a minimum the physical movements that they had to make.
Figure 8. Histogram of the pan durations during the sparse trials.
Discussion
The most important finding of the experiment was the step change reduction in the time participants took to find sparse targets with the 54 megapixel display compared with the other display configurations, and the behavioural data that provides an explanation for this finding. Previous studies where participants had to find targets in unknown positions showed either a gradual decrease in search time as display resolution increased13, 15 or a step change improvement at a much lower resolution (between 1 and 16 megapixels)16. These studies and ours all used geographic data (maps or satellite imagery), but differed in terms of the target density, target saliency, nature of the finding task that participants performed, and the navigation interfaces.
In the study by Shupp et al.16, participants were asked to find salient and non-salient targets. Participants took 3 – 6 times longer to find salient targets with a 1 megapixel display than 16 or 31 megapixel displays. The reason for this may have been that participants had to search systematically with the 1 megapixel display, but the other displays' resolutions meant that participants were almost guaranteed to see the target after making a few panning and zooming movements. In other words, it is likely that the 16 and 31 megapixel displays were well-suited to the task, but the 1 megapixel display was not. The non-salient targets are likely to have required participants to search systematically irrespective of the display resolution, as with the dense targets in the present study, but participants failed to complete 26% of the trials. This may have been because the five minute time limit was not sufficient. In Ball’s studies13, 15participants performed some virtual panning and zooming, as well as physically navigating, even with the highest resolution display. A high target density (20 – 27 houses per megapixel) was accommodated by using semantic zooming to vary how the attributes of the targets were displayed (e.g., bar chart vs. text). Given that participants only had to find one of several targets that matched a given criterion, this semantic zooming is likely to have helped participants to concentrate on the parts of the dataset that were most likely to contain a target, and those parts became progressively faster to identify as the display resolution increased. It should also be noted that caution needs to be taken when interpreting these two studies' findings because, although the data (e.g., mean times) that are provided support the findings, the statistical analyses appear to be flawed (the degrees of freedom are far too large for the studies' designs).
and the 2 megapixel display (too small to involve physical navigation). The lack of a difference between the 2 and 12 megapixel configurations may have been caused by the type of virtual navigation interface we implemented. This interface used velocity-based control (joystick movement controlled the speed of panning, rather than the distance panned), so it took three times longer to pan across the whole 12 megapixel display than across the 2 megapixel display. This is one reason why 92% of participants' panning movements were less than the width of a screen (1600 pixels). If as in previous studies13, 15 the panning interface had used displacement-based control (like the virtual hand on Google maps), then participants could have made large pans quickly, which may have reduced the time required to find targets with the 12 megapixel display.
Conclusions
The above behavioural differences highlight a special class of visualization problem, where it is feasible to use a display with the resolution to show the entire dataset in detail at once. LHRDs promise clear benefits for this class of problem, because of the speed and precision with which users can navigate physically. When the whole dataset can be displayed at once the problem is reduced to visualizing a space that in spatial cognition is termed small-scale21, as opposed to large-scale spaces that have to be travelled through (panned or zoomed) to be viewed in their entirety. It is well-known that people learn spatial layouts much faster from small-scale representations than large-scale representations22, and physical navigation greatly improves efficiency when people search room-sized (small-scale) spaces23.
For larger datasets, LHRDs have proved beneficial when semantic zooming was provided13,
15
. Greater benefit is expected when items of data need to be compared rather than just found or multiple abstractions of data need to be displayed, but experimental evidence to support these predicted benefits is currently lacking.
physical navigation. Therefore, a display that provides a seven million pixel detail view (plus additional resolution for an overview(s)) is likely to be sufficient for a virtual microscope, because that provides a similar field to a conventional microscope. As a result, our research has shifted emphasis from the application of display-walls for medical diagnosis24to virtual slide interfaces that allow histopathologists to make diagnoses almost as quickly with multi-million pixel workstations as they can with a microscope25.
Acknowledgments
This report is independent research commissioned by the National Institute for Health Research under NEAT (grant NEAT L004). The views expressed in this publication are those of the authors and not necessarily those of the NHS, the National Institute for Health Research or the Department of Health. The authors acknowledge the support of the National Institute for Health Research, through the Comprehensive Clinical Research Network.
References
1. Ni T, Schmidt GS, Staadt OG, Livingston MA and Ball R. A survey of large high-resolution display technologies, techniques, and applications. Proceedings of IEEE Virtual Reality. Los Alamitos, CA: IEEE, 2006, p. 223-36.
2. Yuan X, He X, Guo H, et al. Scalable multi-variate analytics of seismic and satellite-based observational data.IEEE Trans Vis Comput Graphics. 2010; 16: 1413-20.
3. Sandstrom TA. The hyperwall. Proceedings of Coordinated and Multiple Views in Exploratory Visualization. Los Alamitos, CA: IEEE, 2003, p. 124-33.
4. Beaudouin-Lafon M, Huot S, Nancel M, et al. Multisurface interaction in the WILD room. IEEE Spectrum. 2012; 45: 48-56.
5. Singh A, Bradel L, Endert A, Kincaid R, Andrews C and North C. Supporting the cyber analytic process using visual history on large displays. Proceedings of the 8th International Symposium on Visualization for Cyber Security (VizSec '11). New York: ACM, 2011, Article 3.
6. Olsen BI, Dhakal SB, Eldevik OP, Hasvold P and Hartvigsen G. A large, high resolution tiled display for medical use: Experiences from prototyping of a radiology scenario. Proceedings of MIE2008 (Studies in Health Technology and Informatics). Amsterdam: IOS, 2008, p. 535-40.
7. Randell R, Ruddle RA, Thomas R and Treanor D. Diagnosis at the microscope: a workplace study of histopathology.Cognition, Technology & Work. 2011; 14: 319-35.
8. Treanor D and Quirke P. The virtual slide and conventional microscope - a direct comparison of their diagnostic efficiency. Annual Meeting of the Pathological Society of Great Britain and Ireland. Glasgow, 2007.
9. Gilbertson J, Ho J, Anthony L, Jukic D, Yagi Y and Parwani A. Primary histologic diagnosis using automated whole slide imaging: a validation study. BMC Clinical Pathology 2006; 6. DOI 10.1186/1472-6890-6-4.
11. Randell R, Ruddle RA, Quirke P, Thomas RG and Treanor D. Working at the microscope: Analysis of the activities involved in diagnostic pathology.Histopathology. 2012; 60: 504-10.
12. Andrews C, Endert A, Yost B and North C. Information visualization on large, high-resolution displays: Issues, challenges, and opportunities.Info Vis. 2011; 10: 341-55.
13. Ball R, North C and Bowman DA. Move to improve: Promoting physical navigation to increase user performance with large displays.Proc ACM CHI. New York: ACM, 2007, p. 191-200.
14. Jakobsen MR and Hornbæk K. Sizing up visualizations: effects of display size in focus+context, overview+detail, and zooming interfaces.Proc ACM CHI. Vancouver, BC, Canada: ACM, 2011, p. 1451-60. 15. Ball R and North C. The effects of peripheral vision and physical navigation on large scale visualization.Proceedings of Graphics Interface. Toronto, Canada: Canadian Information Processing Society, 2008, p. 9-16.
16. Shupp L, Andrews C, Dickey-Kurdziolek M, Yost B and North C. Shaping the display of the future: The effects of display size and curvature.Hum-Comp Int. 2009; 24: 230-72.
17. Yang S, Chung H, North C and Fox EA. The effect of presenting long documents with large high-resolution displays on comprehension of content and user experience. 13th International Symposium on Electronic Theses and Dissertations. Austin, TX: United States Electronic Thesis and Dissertations Association, 2010.
18. Yost B, Haciahmetoglu Y and North C. Beyond visual acuity: The perceptual scalability of information visualizations for large displays.Proc ACM CHI. 2007, p. 101-10.
19. Anslow C, Marshall S, Noble J, Tempero E and Biddle R. User evaluation of polymetric views using a large visualization wall. Proceedings of the 5th international symposium on Software visualization. New York: ACM, 2010, p. 25-34.
20. Long S.Hill walking - The official handbook of the Mountain Leader and Walking Group Leader schemes. Capel Curig, UK: Mountain Leader Training, 2004.
21. Weatherford DL. Representing and manipulating spatial information from different environments: Models to neighborhoods. In: Cohen R, (ed.). The development of spatial cognitionHillsdale, New Jersey: Erlbaum, 1985, p. 41-70.
22. Thorndyke P and Hayes-Roth B. Differences in spatial knowledge acquired from maps and navigation.Cognit Psychol. 1982; 14: 560-89.
23. Ruddle RA and Lessels S. The benefits of using a walking interface to navigate virtual environments. ACM Trans Comp-Hum Int. 2009; 16: article 5.
24. Treanor D, Jordan Owers N, Hodrien J, Quirke P and Ruddle RA. Virtual reality Powerwall versus conventional microscope for viewing pathology slides: an experimental comparison.Histopathology. 2009; 5: 294-300.