White Rose Research Online URL for this paper:
http://eprints.whiterose.ac.uk/116422/
Version: Accepted Version
Proceedings Paper:
Lagkas, T.D. orcid.org/0000-0002-0749-9794, Lamproudi, A., Sarigiannidis, P. et al. (1
more author) (2015) The impact of mobility patterns on the efficiency of data forwarding in
MANETs. In: IEEE International Conference on Communications. IEEE International
Conference on Communications ICC2015, 8-12 June 2015, London, UK. IEEE , pp.
6037-6042. ISBN 9781467364324
https://doi.org/10.1109/ICC.2015.7249284
© 2015 IEEE. Personal use of this material is permitted. Permission from IEEE must be
obtained for all other users, including reprinting/ republishing this material for advertising or
promotional purposes, creating new collective works for resale or redistribution to servers
or lists, or reuse of any copyrighted components of this work in other works
[email protected] https://eprints.whiterose.ac.uk/
Reuse
Unless indicated otherwise, fulltext items are protected by copyright with all rights reserved. The copyright exception in section 29 of the Copyright, Designs and Patents Act 1988 allows the making of a single copy solely for the purpose of non-commercial research or private study within the limits of fair dealing. The publisher or other rights-holder may allow further reproduction and re-use of this version - refer to the White Rose Research Online record for this item. Where records identify the publisher as the copyright holder, users can verify any specific terms of use on the publisher’s website.
Takedown
If you consider content in White Rose Research Online to be in breach of UK law, please notify us by
Abstract— One of the most challenging requirements in cutting-edge Mobile Ad hoc Networks is the need for adaptive and efficient routing. Networks capable of adapting their behavior based on current conditions are often characterized as self-organizing networks, which are lately considered very promising for future applications. This work examines the impact of the different mobility properties on the performance of self-organizing networks. For that purpose, a simulator was developed to model different mobility patterns and study the way they affect the effectiveness of the well-known AODV routing protocol. Particularly, this paper focuses on the effect of the different mobility schemes on network topology and consequently to the overall network performance. The results reveal the tight correlations between node mobility characteristics and network metrics.
Index Terms— AODV, MANETs, mobility patterns, mobile routing, self-organizing networks, WMNs
I. INTRODUCTION
HE evolution of computer networks is definitely towards the seamless support of moving users. This evolution is related with the major developments in computing devices, which are featured to facilitate connectivity, portability, and autonomy. The possible applications are endless, since mobile networking has become essential part of modern life; people rely on it for doing business as well as performing any communication activity related to their personal life. This rising dependence on mobile networks increases the requirements for high quality services and advanced reliability. There are indeed modern applications, such as e-health monitoring, surveillance, and remote control that are considered critical and demand increase reliability. The challenge is evident; wireless links are unreliable by nature and the available physical bandwidth to be shared is scarce. The difficulty to meet this challenge scales up with the introduction of mobility. In this context, the ultimate goal is allowing people retain full and seamless connectivity wherever they go.
However, the necessity to be always and everywhere
October 13, 2014.
T. D. Lagkas is with the Computer Science Department, The University of Sheffield International Faculty, CITY College, Thessaloniki, Greece (e-mail: [email protected]).
A. Lamproudi is with the Department of Signals and Systems, Chalmers University of Technology, Gothenburg, Sweden (e-mail: [email protected]).
connected leads to the need for an always available network that can self-adapt, self-configure, self-heal, and self-optimize [1][2]. Integration of newly added nodes, restoring broken links due to leaving nodes, and adjusting the whole network operation to the dynamically formed topology are key characteristics of such networks.
The effect of mobility patterns in MANETs (Mobile Ad hoc Networks) is a major factor for the network configuration, maintenance, and performance. Moving nodes dynamically create and break links between adjacent devices; the more sudden the changes in network topology, the more fluctuating and unreliable the links. In such conditions, it is a challenge to effectively maintain and configure the network [3][4]. A typical example comes from military; a group of soldiers that move through a battlefield have to stay always connected in order to coordinate their actions regardless the highly dynamic conditions.
In the effort to examine and comprehend how mobility patterns affect network stability, we modelled mobility patterns that imitate nodes movement. The mobility models as well as the operation of the AODV (Ad hoc On-demand Distance Vector) routing protocol were studied using a MATLAB simulator that we implemented for this reason. The simulations output have provided useful indications of the network operations under various circumstances. The modelled mobility patterns are Probabilistic Random Walk and Individual Behavioral Mobility.
In Section II the operation of AODV and the characteristics of the considered mobility patterns are discussed. The following Section describes the implemented simulator and the network metrics that were taken into account. The simulation results are presented and commented in Section IV. Lastly, the paper is concluded in Section V.
II. BACKGROUND
A. AODV Routing Protocol
For this study we consider one of the most well-known and promising routing protocols for MANETs, AODV. It is a
P. Sarigiannidis is with the Department of Informatics and Telecommunications Engineering, University of Western Macedonia, Kozani, Greece (e-mail: [email protected]).
C. Skianis is with the Department of Information and Communication Systems at the University of the Aegean in Samos, Greece (e-mail: [email protected]).
The Impact of Mobility Patterns on the
Efficiency of Data Forwarding in MANETs
Thomas D. Lagkas, Member, IEEE, Argyro Lamproudi, Panagiotis Sarigiannidis, Member, IEEE,
and Charalabos Skianis, Senior Member, IEEE
T
hoc networks. It is noted that in this study the modeled communications are unicast, in order to ensure controlled conditions that can facilitate drawing clear inferences based on the performed comparisons.
The operation of AODV is on-demand; when specific nodes need to communicate, only then routing information is exchanged to create paths over the available links. The respective algorithm performs four main functions: neighbor discovery, route discovery, route establishment, and error detection.
To begin with, the reliability of the underlying layer-2 protocol is crucial for the effectiveness of neighbor discovery. In the typical case that the IEEE 802.11 stack is employed, nodes discover their neighbors by listening to broadcasted messages; when contacting the neighbors is no longer possible, the corresponding links are considered broken [5]. Nodes periodically broadcast “hello” messages to update their list of neighbors. When the neighbor discovery phase is completed, the route discovery phase can be initiated.
A communication path between two nodes can be set by discovering a valid route from one end to the other and successfully establishing it. Each node maintains a neighbor table with records of the available neighbors and a routing table to decide about the next hop when reaching different destinations. The route entries carry the following information: sequence number, destination IP address, next hop IP address, number of hops to the destination and a life-time value for the specific entry. The sequence number is an indicator of the entry’s age (new routing information is used to update old entries). The address of the neighbor to forward data packets is given by the next hop IP address field, while the number of hops corresponds to the number of intermediate nodes between the current node and the destination. Lastly, the life-time parameter is updated when the specific route is actually used; when it reaches zero, the entry is removed.
AODV uses the RREQ (Route Request) and RREP (Route Reply) for route discovery and establishment, respectively. Initially, the source node locates a valid route entry in its routing table towards a specific destination. If such an entry does not exist, the node tries to discover a path to the destination by broadcasting a RREQ message. Nodes that receive RREQ insert in their routing table an entry with the inverse path to the source node. In that entry, the next hop is the IP address of the neighbor node that delivered the RREQ message and destination IP address is the initial source node’s address. This process is repeated by all nodes that receive and then broadcast the RREQ message, avoiding duplicate broadcasts. It is terminated when the destination node eventually receives the RREQ message. At that time, the destination node creates an inverse route entry corresponding to the whole path to the source node. Next, it constructs and sends a RREP message replying to the source node; the inverse route entry is consulted to properly forward the message back to source. The intermediate nodes that receive the RREP message add an entry in their routing table towards the destination and forward it to the next node based on the
to the destination that was initially required. From that point on, the source node is able to start communicating with the destination node over the established path.
When data packets arrive at nodes that do not have a valid route entry towards the specific destination, AODV triggers a packet loss prevention mechanism. In more specific, nodes that are not aware of available paths send back to the neighbor that lastly forwarded the corresponding packet a RRER (Route Error) message. This is a control message that informs the previous nodes not to forward any packets using the current invalid route. A node receiving a RRER message checks whether the sender is recorded as next hop in any of its route entries for the specific destination. These entries are now considered invalid and they are removed. This process continues until RRER reaches the source node, which deletes the respective entry and rediscovers a new route if still needed. A route entry may cease to exist, due to one of the following incidents. The first one is the nullification of the life-time parameter. Its default value is set in accordance to the network size. As time elapses and the entry is not used, the parameter’s value declines till it reaches zero. At that point, the error detection mechanism is triggered, as already described, in order prevent data losses. The second reason for the deletion of a route entry is the topology change due to the failure of links to adjacent nodes. The change may be attributed to nodes mobility; formerly neighboring nodes can move out of communication range. Consequently, the corresponding route entries that indicate as next hop a former neighbor are removed. In this study, the modelled mobility patterns illustrate different scenarios where topology changes in various ways, hence, affecting the whole data forwarding process.
B. Mobility Patterns
The mobility patterns that we study here concern nodes that move independently towards a destination. The implemented models are Probabilistic Random Walk [6] [7] and Individual Behavioral Mobility [8]. The former uses stochastic rules in order to compute the new position of the moving nodes. Three mobility states are considered: current state, previous state, and next state. A probability matrix is used to decide the mobility state. Each state defines the direction of the movement; speed is fixed and preset for all nodes. The matrix provides the probability PP to transit to the previous mobility state, the probability PC to stay in the current mobility state, and the probability PN to switch to the next mobility state. When transiting to the next state, the new direction is randomly selected.
next direction, according to the selected mobility state (previous, current, next). For instance, if PC is higher than PP and PN, it is more probable to remain in the current mobility state and keep moving to the same direction. This type of movement may represent a walk in a park or at the zoo or even in the open space of a mall.
The Individual Behavioral Mobility pattern belongs to the wider class of Behavioral Mobility, which is about algorithms where movement is affected by physical and biological interactions. Specifically, according to Individual Behavioral Mobility, the moving entities are able to avoid collisions to each other and to walls. Mobility rules are based on attractive and repulsive forces. In more detail, nodes are attracted to the destination, while they are repulsed by other nodes and walls. Mobility specifics are defined using acceleration vectors, which are computed for each node at each position update. When applying the rule of moving towards the destination, the acceleration vector for node i is given by the formula:
(1)
where v0 is the predefined node speed, is 1/sec, and vi(t) is the
current velocity. The rule for avoiding walls (the limits of the simulation space) defines the acceleration vector:
(2)
where is 1/sec2. The last rule applied here is about mutually
avoiding nodes. Specifically, when nodes are 1 meter away, they repulse each other and move to opposite directions. This algorithm can model pedestrians moving independently towards different waypoints.
III. METHODOLOGY
A. Simulator
An event-based simulator was developed in MATLAB for the purposes of this study. Regarding routing events, the first one is related with the creation of data packets in the source node. A traffic generator is responsible for creating data packets based on packet interarrival time and packet size. The second event is about creating and forwarding RREQ messages that initiate route discovery. The creation and forwarding of RREP messages is realized by the third event, which completes the establishment of routes towards the destinations. Data packet forwarding through the corresponding path is implemented in event four. The fifth routing event is related with the RRER messages. Invalid entries are removed from the routing table and rediscovery of routes at the source is initiated.
The simulator provides a graphical representation of the moving nodes during the simulation. Some of the main parameters that constitute the simulator input are: the mobility pattern specifications, the total number of nodes, the communication range, the size of the simulation space, and the termination condition (total load or duration). The channel conditions are assumed static during a simulation execution. The output of every simulation that is exploited by this work
involves network metrics which are explained in the following subsection.
B. Network Metrics
The network metrics that are computed and evaluated in each simulation scenario are presented in this subsection.
A connectivity graph is formed by the different network topologies. Communication links are created between moving nodes that are in communication range, called neighbors. The total number of active links a node maintains with adjacent nodes is its node degree [9]. Each node periodically updates its position during the simulation, based on the applied mobility pattern. Every time there is a position update, the simulator calculates the node degree; at the end of the simulation, the mean node degree for all nodes for all position updates is computed. We are particularly interested in the fluctuation of the mean node degree and the underlying reasons. The regular position updates reveal the alternations of the connectivity graph. Neighboring nodes dynamically change based on the mobility characteristics, mainly depending on the following: number of nodes, speed of nodes, and relevant position of nodes.
Throughput is the network metric that represents the average rate of successful data delivery over the network during the simulation time. The formula that is used here to calculate throughput is the following:
. (3)
The total number of data packets that were sent and successfully delivered to the destination is provided by DDP (Delivered Data Packets). For a given network capacity, the throughput is mainly affected by the following: speed of nodes, mean node degree, and network load.
Regarding lost packets, they could occur due to failing links during transmission. Formed routes that at some point include broken links increase the number of lost packets. One case that leads to link failure is connectivity loss due to mobility. In that manner, nodes that were previously neighbors, move out of communication range. The other case, based on our network model, is related with the specifics of the routing algorithm. As it is already explained, the routing tables in the mobile nodes contain records about available routes to a destination; one of the fields is called life-time of the entry. If the time elapses and the respective variable is nullified, the record is removed. In such a case, packet loss can occur, because of the need to forward a data packet towards a destination which is no longer included in the routing table. In general, the number of lost data packets is significantly affected by the following: speed of nodes, throughput, and network load.
Lost data packets are calculated by the following formula:
. (4)
(5)
where the network load as packet rate is denoted by load. The total number of data packets successfully delivered is given by DDP (Delivered Data Packets) and WP (Waiting Packets) denotes the number of packets left in the source node queue, since they couldn’t be sent on time. Considering that DDP is calculated using throughput, it holds:
DDP . (6)
Subsequently, the following expression is true:
. (7)
The last network metric considered here is the mean duration of path finding. It is the time needed by the routing protocol to discover and establish valid paths from source to destination. Its value is estimated by measuring the interval from the generation of a route request message till the successful reception of the corresponding route reply message. It greatly depends on the number of hops along the route, as well as the actual distance between source and destination nodes. Moreover, path finding takes longer, when there are more nodes in the network, due to the increase in the number of hops. It is noted that the frequent path changes also constitute another reason for this increase.
IV. RESULTS
The mobility patterns that have been modelled and evaluated in this study are Probabilistic Random Walk and Individual Behavioral Mobility. In the former, all entities rely on the same probability matrix, based on which direction is set in every position update. The second mobility model generates more realistic node movement; each node has a different destination point and moves towards that. It is reminded that a collision avoidance mechanism is implemented, considering nodes’ position. Specifically, nodes that are about to collide adjust their movement to avoid contact.
Regarding Probabilistic Random Walk, the simulations have revealed that when the probability to maintain the current movement state is high, the relevant distance among neighboring nodes increases, eventually leading to increment of broken communication links. This is attributed to the fact that nodes keep moving to different directions without any changes, hence, they tend to move away from each other. The opposite is true when the probability to remain in the same movement state is low. In the effort to draw safer conclusions, we performed multiple simulation experiments with different values for the probabilities in the transition matrix. Based on the results of these simulations and due to the fact that Probabilistic Random Walk is a highly stochastic pattern, it was decided to employ probabilities values that enhance movement symmetry and limit the statistical error when performing multiple executions of the same simulation scenario. Under this
concept and without loss of generality, the following values were eventually defined: PP = 0.3, PC = 0.4, and PN = 0.3.
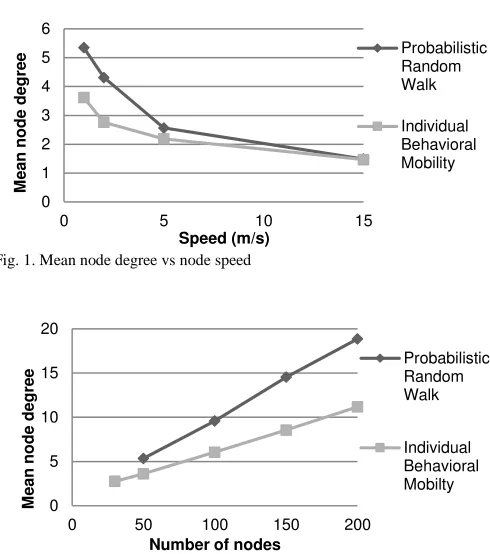
Modelling Individual Behavioral Mobility has shown that the selection of a different destination by each node leads to highly independent type of movement. Therefore, the whole network topology becomes highly dynamic, not allowing the creation of stable communication links between the adjacent nodes. This behavior is more evident when examining the resulted mean node degree, as depicted in Fig. 1 and Fig. 2. In both figures, nodes moving according to the Individual Behavioral Mobility pattern create less connection links to the neighboring nodes, compared to the Probabilistic Random Walk model.
Moreover, it is clear that in all cases the nodes’ speed significantly affect the mean node degree. Fig. 1 shows that increasing speed causes node degree decrement, due to the inability of forming links to adjacent nodes at high speed. It is noted that speed is set at the beginning of the simulation and is fixed for both mobility patterns. In general, the higher the speed, the sooner neighboring nodes move out of communication range and lose connectivity.
As far as the effect that the number of nodes has on mean node degree, it is evident in Fig. 2 that increasing the nodes leads to higher node degree. Taking into account the fact that initially all nodes are randomly positioned in the limited size simulation space, the node density increases, when there are more nodes in the network. Therefore, the underlying graph has increased number of links, so there are more neighbors for each node.
The rate of packets entering the network or being generated by the participating nodes is given by the network load. By adjusting the mean packet inter-arrival time at the beginning of every simulation, we control the resulted network load. In Fig.
0 1 2 3 4 5
0 5 10 15
M
e
a
n
node
degre
e
Speed (m/s)
Probabilistic Random Walk
[image:5.612.316.561.53.330.2]Individual Behavioral Mobility
Fig. 1. Mean node degree vs node speed
0 5 10 15 20
0 50 100 150 200
M
e
a
n
node
degre
e
Number of nodes
Probabilistic Random Walk
Individual Behavioral Mobilty
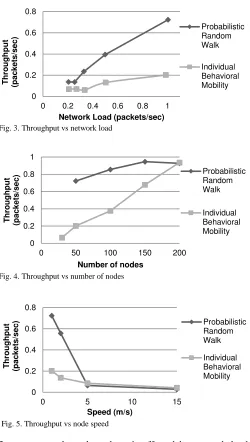
3, we can see how throughput is affected by network load. Obviously, when load increases, there are more data packets to be delivered, hence, throughput increases, up to a saturation point. In more detail, regarding Probabilistic Random Walk, increasing network load to 1 packet/sec, results in a throughput value of 0.72 packets/sec. The respective value for Individual Behavioral Mobility is just 0.2 packets/sec. This remarkable contrast is attributed to differences in the coherence of each mobility pattern, that directly affects the resulted node degree.
In regards to the relationship between number of nodes and throughput, it is already clarified that the more the nodes the higher the mean node degree. This fact significantly impacts the route discovery process. The increased number of links facilitates the discovery of fast routes to the destination by the routing algorithm. As a result, in shorter time intervals, more data packets can be successfully delivered to their destination, increasing the overall throughput, as it can be seen in Fig. 4.
It has been already shown that node degree is significantly affected by node velocity. A similar effect can be detected when examining the network throughput for different values of node
speed. In more detail, the rapid changes in topologies which occur in high speeds, decrease the number of neighbors and consequently the possible routes towards the destination. Moreover, the formed connections are notably unreliable when nodes move fast, so constructed paths frequently fail. This type of network behavior becomes evident from the throughput results plotted in Fig. 5. It is clear that the faster the nodes move, the less packets are successfully delivered.
Regarding packet losses, the on-demand nature of the protocol, which is related with its ability to detect and address broken links, has a major impact on the number of lost packets. When there is a connection failure, because of changes in topology, AODV limits transmissions to prevent data loss. Hence, throughput is decreased and there are actually less packets to forward to destination, so in fact less packets can be lost. This is the reason why the Probabilistic Random Walk pattern exhibits more packet losses than the Individual Behavioral Mobility pattern. Fig. 6 shows that more packets are lost when load increases. As soon as packets are generated, they are queued in the packet buffer, waiting their turn to be transmitted over a discovered route.
Furthermore, as shown in Fig. 7, when nodes move faster, the number of lost packets decreases. This behavior is attributed to the data loss prevention mechanism of AODV, as well. Specifically, when node speed is higher and links break more often, throughput keeps decreasing due to the frequent topological changes. Available packets to be transmitted are less and consequently the lost number of packets is decreased.
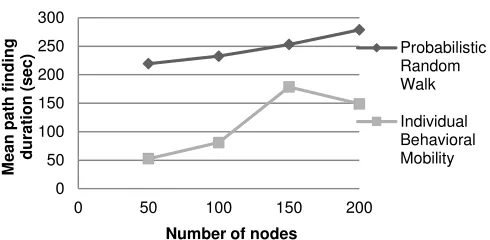
Lastly, as far as path finding duration is concerned, it can be seen in Fig. 8 that the higher the number of nodes, the longer it takes to discover valid routes to the destination. The Probabilistic Random Walk mobility pattern introduces higher mean path finding duration, compared to the Individual 0
0.2 0.4 0.6 0.8
0 5 10 15
T hrough put (pac k e ts /s e c ) Speed (m/s) Probabilistic Random Walk Individual Behavioral Mobility
Fig. 5. Throughput vs node speed
0 10 20 30 40 50 60
0 0.2 0.4 0.6 0.8 1
Lost dat a pac k e ts
Network Load (packets/sec)
Probabilistic Random Walk Individual Behavioral Mobility
Fig. 6. Number of lost data packets vs network load
0 0.2 0.4 0.6 0.8 1
0 50 100 150 200
T
hrough
put
(packets
/sec)
Number of nodes
[image:6.612.48.298.55.497.2]Probabilistic Random Walk Individual Behavioral Mobility
Fig. 4. Throughput vs number of nodes
0 0.2 0.4 0.6 0.8
0 0.2 0.4 0.6 0.8 1
T hrough put (pac k e ts /s e c )
Network Load (packets/sec)
Probabilistic Random Walk Individual Behavioral Mobility
Fig. 3. Throughput vs network load
0 10 20 30 40 50 60 70 80 90
0 5 10 15
[image:6.612.319.562.59.214.2]L o st d ata p acke ts Speed (m/sec) Probabilistic Random Walk Individual Behavioral Mobility
Behavioral Mobility pattern. This is mainly due to the fact that the former mobility pattern allows more packet transmissions to be completed, as it has been already seen, hence, there are more frequent path discoveries.
V. CONCLUSION
In this paper, we have studied the effect of mobility models on data routing in MANETs. Specifically, two well-known mobility patterns were modelled: Probabilistic Random Walk and Individual Behavioral Mobility. The considered routing protocol was the very promising AODV protocol, which was implemented in simulator and evaluated under different network scenarios. The computed network metrics revealed that network performance greatly depends on the characteristics of the produced movement type, the network parameters, and of course the routing protocol functions. In general, the more independent, dynamic, and less coherent the node movement is, the less paths can be created, hence, less transmissions can be successfully completed. As future work, we intend to study the impact of group mobility patterns and consider the effect of more realistic network scenarios that involve obstructed
ACKNOWLEDGMENT
Co-financed by Greece and the European Union (European Social Fund) O.P. 'Human Resources Development' - NSFR 2007-2013.
REFERENCES
[1] I.G. Niemegeers and S.M. Heemstra De Groot, “From Personal Area Networks to Personal Networks: A User Oriented Approach,” Springer Wireless Personal Communications, vol. 22, no. 2, pp. 175-186, 2002. [2] S. Misra, I. Woungang, and S.C. Misra, “Configuring,
Self-Organizing, and Self-Healing Schemes in Mobilie Ad Hoc Network,” in Guide to Wireless Ad Hoc Networks, Springer, 2009.
[3] E. Natalizio and V. Loscri, “COntroled mobility in mobile sensor networks: advantages, issues and challenges,” Springer Telecommunication Systems, vol. 52, no. 4, pp. 2411-2418, 2013. [4] S.-L. Wu, S.-Y. Ni, J.-P. Sheu, and Y.-C. Tseng, “Route Maintenance in
a Wireless Mobile Ad Hoc Network,” Springer Telecommunication Systems, vol. 18, no. 1-3, pp. 61-84, 2001.
[5] V. Lalitha and R.S. Rajesh, “AODV_RR: A Maximum Transmission Range Based Ad-Hoc on-Demand Distance Vector Routing in MANET,” Springer Wireless Personal Communications, vol. 78, 491-506, 2014. [6] V.A. Davies, “Evaluating Mobility Models within an Ad hoc Network,”
Thesis, Colorado School of Mines, 2000.
[7] T. Camp, J. Boleng, and V.A. Davies, “A Survey of Mobility Models for Ad Hoc Network Research,” Wiley Wireless Communications and Mobile Computing, vol. 2, no. 5, pp. 483-502, 2002.
[8] F. Legendre, V. Borrel, M. Dias de Amorim, and S. Fdida, “Reconsidering Microscopic Mobility Modeling for Self-Organizing Networks,” IEEE Network, vol. 20, no. 6, pp. 4-12, 2006.
[9] V. Lenders, J. Wagner, S. Heimlicher, M. May, and B. Platner, “An empirical Study of the Impact of Mobility on Link Failures in an 802.11 Ad Hoc Network,” IEEE Wireless Communications, vol. 15, no. 6, pp. 16-21, 2008.
0
50 100 150 200 250
0 50 100 150 200
M
e
a
n
pat
h
fi
ndi
ng
durat
ion
(sec)
Number of nodes
Probabilistic Random Walk
[image:7.612.50.295.54.174.2]Individual Behavioral Mobility
Fig. 8. Mean duration of path finding vs number of nodes