Activist Directors: Determinants
and Consequences
The Harvard community has made this
article openly available.
Please share
how
this access benefits you. Your story matters
Citation Gow, Ian D., Sa-Pyung Sean Shin, and Suraj Srinivasan. "Activist Directors: Determinants and Consequences." Harvard Business School Working Paper, No. 14-120, June 2014.
Citable link http://nrs.harvard.edu/urn-3:HUL.InstRepos:13479133
Copyright © 2014 by Ian D. Gow, Sa-Pyung Sean Shin, and Suraj Srinivasan
Working papers are in draft form. This working paper is distributed for purposes of comment and discussion only. It may not be reproduced without permission of the copyright holder. Copies of working papers are available from the author.
Activist Directors:
Determinants and
Consequences
Ian D. Gow
Sa-Pyung Sean Shin
Suraj Srinivasan
Working Paper
14-120
Activist directors:
Determinants and consequences
Preliminary draft: Please do not quote or cite without permission
Ian D. Gow
1Sa-Pyung Sean Shin
1Suraj Srinivasan
1May 30, 2014
1All authors are at Harvard Business School. We thank the Division of Research at Harvard Business
sem-Abstract
1. Introduction
Hedge fund activism has become a significant phenomenon in recent years. This kind of ac-tivism differs from more traditional forms of shareholder acac-tivism, such as shareholder pro-posals filed under SEC Rule 14a-8, both in the nature of the activists, as well as in the scale and type of intervention. More traditional activism has often been initiated by pension funds and individual activists (sometimes called “gadflies”) with relatively weaker incentives to gen-erate higher returns by influencing the management of a firm. In contrast, as pointed out by Brav, Jiang and Kim (2010), hedge funds have stronger incentives to produce higher returns, fewer conflicts of interest, and “much more flexibility to intervene in the invested companies.” Brav et al. (2010, 187). These differences appear to have led to hedge fund activists making a broader range of demands and adopting a wider range of tactics to have those demands met than traditional shareholder activists.
One approach used by hedge fund activists to influence companies in which they have in-vested, is to seek to join the board of directors of these companies. But this is not costless. First, there are direct costs associated with getting on the board, which Gantchev (2013) finds to be significant. Second, by joining the board the activists (or their nominees) stake their rep-utations by taking on a role in implementing their demands. Third, board positions also come with fiduciary responsibilities towards all shareholders. Given the additional cost and commit-ment required of activists that get board representation—and the tendency for such investors to take “long-term” positions when they do so—studying the actions of firms with such directors can provide new insight into the motives and effects of hedge fund activists.
Our paper addresses a number of questions related to activist directors. First, we focus on the circumstances surrounding the appointment of activist directors to the board. When do activists seek board representation? And when are they successful in obtaining it? How do activist directors differ from other directors? Second, what impact do activists have when they get on the board? Does their impact differ from that of other cases of activism? Finally, is there evidence of short-termism?
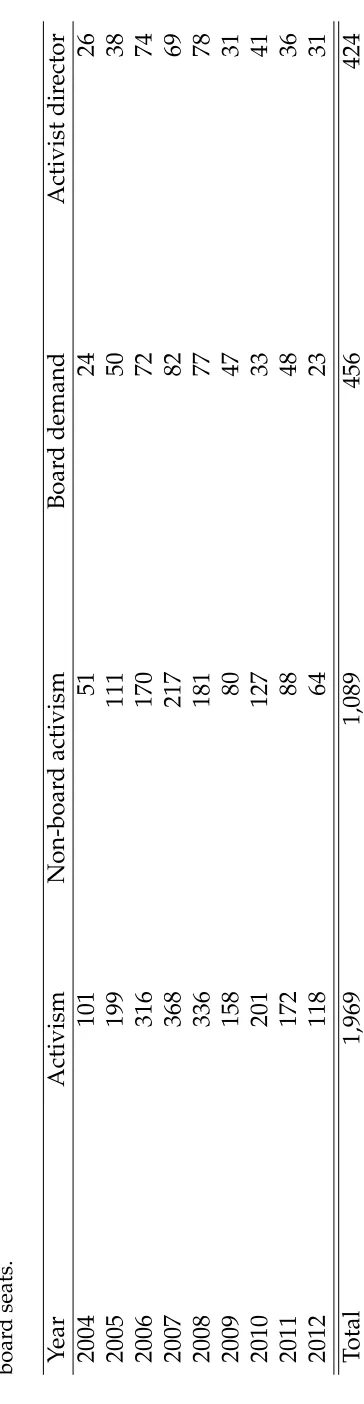
Our sample of 1,969 activism events comprises all activism events targeted at US companies from 2004 to 2012.1 In each case, we code whether the activist made demands for board
repre-sentation and whether the activist obtained seats on the board. We identify 824 directors who were appointed to the board in response to activist demands. With regard to the first set of questions, we find, consistent with prior research, that activists tend to target firms with more institutional shareholders, smaller market capitalization, and worse recent stock performance. Additionally, conditional on being targeted by activists, we find that activists are more likely to demand board representation when the firm has less leverage and is smaller. With regard to performance, we find evidence that board representation is demanded at firms with worse stock market performance, but higher operating performance (return on assets); this is consis-tent with board representation being sought for objectives other than reversing poor operating performance. But we also find that firms with older directors, with directors with longer tenure, and with staggered boards are more likely to be targeted. Conditional on a firm being targeted for activism, we find little that explains when activists get board seats.
We describe the characteristics of activist directors and compare them with new directors ap-pointed at other firms.2 We find that activist director characteristics differ according to whether
the director is affiliated with activists or not. Activist-affiliated directors (i.e., employees or principals of members of the activist group) are about 9 years younger than other new direc-tors and much less frequently female. Activist direcdirec-tors are appointed to key committees just
1We additionally require that the target firm is matched to CRSP, is not an investment trust or mutual fund,
and that the event is not a control contests involving another corporation.
2In prior research, we show that activism is often associated with departure of incumbent directors (Gow,
as often as other new directors, suggesting that they quickly move into key board positions. About 42 percent (346 of 824) of activist directors are directly employed at the hedge fund ac-tivist; the rest (478) appear to be unaffiliated directly to the hedge fund despite being sponsored by the activist for the board position.
Using methods that account for censoring, we find that activists hold stock in a target firm for a median of about 2.4 years when their demands do not include board representation, and that this increases to 3 years in cases where the activists obtain board representation. A three-year holding period implies that these activists can be considered as “long-term” investors.3
We then examine a number of possible consequences of activist directors for the firms whose boards they join. Consistent with prior research, we find significant risk-adjusted returns around the announcement of activism, with returns from 20 to +20 trading days around
the announcement ranging from3.9%to4.9%. We find no evidence of a market reaction at the
appointment of activist directors, perhaps reflecting the difficulty of identifying precisely when the market learns about activist board appointments. Looking beyond positive announcement-period returns, operating performance seems to improve, with return on assets increasing by more than 2% over the five years after activism. In terms of underlying actions, we find
evidence of increased divestiture, decreased acquisition activity, higher probability of being acquired, lower cash balances, higher payout, greater leverage, higher CEO turnover, lower CEO compensation, and lower capital expenditure, research and development, and advertis-ing. With the exception of the probability of being acquired, the estimated effects are generally greater when activists obtain board representation (though not always statistically so), consis-tent with board representation being an important mechanism for bringing about the kinds of changes that activists often demand.
The primary goal of our paper is to contribute to the understanding of the increasingly impor-tant phenomenon of hedge fund activism. Overall, we find that activist directors are associated with significant strategic and operational actions by firms. While the observational data
avail-3As discussed in Section 5, pension funds have a typical duration of 2 years and investor relation professionals
able to us do not permit unequivocal causal inferences, the associations we document appear consistent with hedge fund activists having an impact, especially when they obtain board rep-resentation. The breadth and depth of these apparent effects suggests that, when activists get board representation, their impact is not simply about the “ability of activists to force target firms into a takeover” (Greenwood and Schor 2009, 362). However, even if given a causal in-terpretation, it is unclear whether all of these effects are beneficial to shareholders. For instance, while our evidence is consistent with activist directors playing a significant role in curbing ex-penditures on capital, research and development (R&D), and advertising, it is unclear whether this reflects curtailment of excessive investments or, as critics of activists might suggest, under-investment with a focus on the short term. However, the relatively long-term holding period in cases where activists become directors, positive stock market effect, and long-term operating performance improvements seem inconsistent with activist directors being short-termist. The rest of the paper proceeds as follows. Section 2 describes features of shareholder activism campaigns and related literature. Section 3 describes our data and descriptive statistics. Section 4 examines the circumstances in which activists seek and obtain board representation. Section 5 examines the association with activist board representation and activist holding periods. Sec-tion 6 examines stock returns for activism targets with and without board-related demands and for firm where activists get board representation. Section 7 examines the association between activist directors and firm outcomes, such as operating performance, investment behavior and CEO incentives. Section 8 concludes.
2. Institutional background and prior literature
2.1. Illustrative cases
In some cases, activists make pointed demands that yield swift reaction from the target firms. For example, on June 6, 2012, Becker Drapkin Management LP filed a 13D reporting a 5% stake in Tuesday Morning Corporation. In a letter to the board, Becker Drapkin complained that the company’s performance had suffered since Kathleen Mason became CEO in 2000, and that shareholder representation on the board was necessary to instill accountability. Later that same day, the company announced the departure of Kathleen Mason as president and CEO and that it had commenced a search for a new CEO. On June 26, 2012, Becker Drapkin disclosed that it was engaged in discussions with the company regarding board representation. On July 2, 2012, the company announced the appointment of two representatives of Becker Drapkin to the board, that it would work with Becker Drapkin to add two additional independent directors, and Becker Drapkin agreed to standstill provisions lasting two years.4
In other cases, board demands emerge only after continued poor performance and resistance to the activist’s demands. For example, on June 28, 2007, Barington Capital Group L.P. sent a letter to the Chairman and CEO of Dillard’s Inc. requesting a meeting to discuss measures to achieve better financial performance and operational efficiency. After this request was declined, on August 30, 2007, Barington sent yet another letter to the board expressing disappointment with the company’s poor operating performance and poor corporate governance. On January 29, 2008, Barington jointly filed a 13D with the Clinton Group and RJG Capital Management, LLC, asking for a review of executive pay and measures to improve performance and enhance corporate governance. The dissident group gave formal notice to the company of its intent to nominate directors for the upcoming election on March 19, 2008. On April 1, 2008, Dillard’s settled with Barington and other dissidents and nominated two candidates proposed by the dissident group for election to the board of directors.
Another example is Blockbuster Inc. which was the target of prominent activist Icahn As-sociates Corp. This event started on April 7, 2005, when Carl Icahn disclosed that he had
requested Blockbuster extend the deadline for nominating directors for election at the com-pany’s 2005 annual meeting. The company rejected the request and on April 8, 2005, Icahn sent formal notice that he was nominating himself and two others for election to Blockbuster’s board. In his communications with stockholders, Icahn criticized Blockbuster’s compensation practices and management’s business plan and stated that if elected his nominees would bring discipline to the “spending spree.” Icahn also stated that he believed the company should put itself up for sale. At the annual meeting, Icahn received 63% of the votes cast and his two other nominees received 68% of the votes cast.
Following these illustrative examples we examine several outcomes in activist director compa-nies. These include firm performance outcomes measured using stock returns and accounting performance; governance outcomes such as CEO turnover and CEO compensation; strategic outcomes such as divestitures and acquisitions; financial policy outcomes such as leverage and payouts; and investment policy decisions such as capital expenditures, research and develop-ment, and advertising. While we examine these outcomes in the context of activist directors, prior papers have examined some of these outcomes in the context of hedge fund activism in general. We discuss this research next.
2.2. Causes and consequences of hedge fund activism
The phenomenon of shareholder activism that we examine is driven in large part by activist hedge funds over the last decade. Brav, Jiang, Partnoy and Thomas (2008) identifies structural benefits enjoyed by hedge funds—such as fewer regulations and better incentives—that have allowed such funds to be more active in pursuing governance changes in companies than mu-tual fund or pension managers. Like prior research (Brav et al. 2008), the ultimate source for much of the data we use to identify activism events comes from 13D filings with the SEC. Ac-cording to the SEC, “when a person or group of persons acquires beneficial ownership of more than 5% of a voting class of a company’s equity securities registered under Section 12 of the Securities Exchange Act of 1934, they are required to file a Schedule 13D with the SEC.”5This
filing should be made within 10 days of the trade date of the securities transaction triggering the requirement to file. If a shareholder has not “acquired the securities with any purpose, or with the effect of, changing or influencing the control of the issuer,” then a more abbreviated filing on Form 13G may be used.6 As hedge fund activists when launching a campaign look to
change or influence the target and quite often exceed the 5% threshold, 13D filings are a typical concomitant of such campaigns.
In terms of firm characteristics that attract activist hedge fund attention, prior research suggests that hedge fund activists typically target smaller firms, value-oriented firms (low market-to-book), and firms with sound operating cash flows but low sales growth, leverage and dividend payouts (Brav et al. 2010). This evidence motivates us to use firm-level covariates to control for factors causing firms to be targeted by activist investors. Gantchev (2013) models activism as involving a sequence of decisions beginning with broad activist demands, followed by de-mands for board representation, then threatened, then actual, proxy contests. Gantchev (2013) estimates costs associated with these stages using a system of recursive logistic regressions and finds that such costs reduce activist returns by more than two-thirds, but net returns are not negative. Our paper complements Gantchev (2013) by providing evidence on the kinds of actions facilitated by escalation of activism to the level of obtaining board representation. In terms of consequences, prior research (see Brav et al. 2008, Klein and Zur 2009, Greenwood and Schor 2009) finds a positive stock price reaction of about five percent to the announcement of activist campaigns, typically centered around the 13D announcement dates. Greenwood and Schor (2009) find that the positive market reaction arises from cases where the activists are able to force the target firms to be sold following the activist campaign. They find no significant market reaction at the 13D filing date for firms that are not acquired ex-post. Klein and Zur (2009) suggests that one source of shareholder gains is the transfer of wealth from debthold-ers to stockholddebthold-ers. This likely occurs because activists demand reduction in cash holdings and increase in leverage in target firms. Brav et al. (2008) and Bebchuk et al. (2013) also find
6http://www.sec.gov/divisions/corpfin/guidance/reg13d-interp.htm, accessed 2014-05-26.
that operating performance as measured by return on assets is higher in the three to five year period following the launch of activism. The mechanisms that drive possible performance im-provements in firms that continue to be independent have not been explored much in research with the exception of Brav et al. (2013). Using plant-level information from the US Census Bu-reau they find that the average target firm improves production efficiency in the three years after the activist engagement. Employees exhibit increase in labor productivity but a stagna-tion in wages. In related research, Brav et al. (2014) find that targets of hedge fund activism exhibit reduction in research and development spending but an increase in innovation output suggesting an improvement in innovation efficiency. Our paper complements this research by identifying a role for activist directors in the changes brought about by activism thereby identifying a mechanism by which activists carry out the changes they demand.
2.3. Other shareholder activism
2.4. Director elections and proxy fights
The routine mechanism for someone to become a director is to be nominated for election by the incumbent board. Unless invited onto the board, the only way for activist shareholders to obtain board representation is to initiate a proxy solicitation campaign in a contested election. Contested elections are contests between the incumbent set of directors put forward by the company and a dissident slate nominated by an outside investor. Dodd and Warner (1983) provides early evidence consistent with proxy fights creating value for shareholders. They find a statistically significant positive share price effect associated with a proxy contest regardless of whether the contest was successful or not. However, a number of studies find limits to the effectiveness of proxy contests. While Mulherin and Poulsen (1998) find evidence “that proxy contests create value” using a sample of 270 proxy contests covering 1979–1994, but they also find that “the bulk of the wealth gains stemming from firms that are acquired.” Pound (1988) identifies cost and management incumbency as impediments to successful proxy fights. More recently, Bebchuk (2007) claims that shareholders’ power to obtain board representation is largely a “myth” due to free-rider issues associated with investing in costly proxy contents. While activist directors often join boards as a result of a proxy contest, the majority of activist directors in our sample join through negotiation with the incumbent board. We contribute to this debate by providing evidence consistent with an important class of investors being able to get board representation even absent a contested election.
2.5. Specialist outside directors
Jiang, Lie and Yang (2014) finds that firms with investment bankers on their boards make more acquisitions and experience higher takeover announcement returns and pay lower premiums than other firms.
Overall, this literature shows that directors bring specific types of expertise to boards and firms appear to use this expertise. One difference of our paper from this research stream is that we examine a class of directors that are not voluntarily invited by the boards that they join. Even in cases that do not involve a proxy fight, activist directors join boards as a result of a negotiated outcome between the activist and the incumbent board and management. Given that activist directors join the board for a specific activist purpose, their role on the board is likely to be different from that of other directors.
3. Data and descriptive statistics
3.1. Activism events
3.2. Activist directors
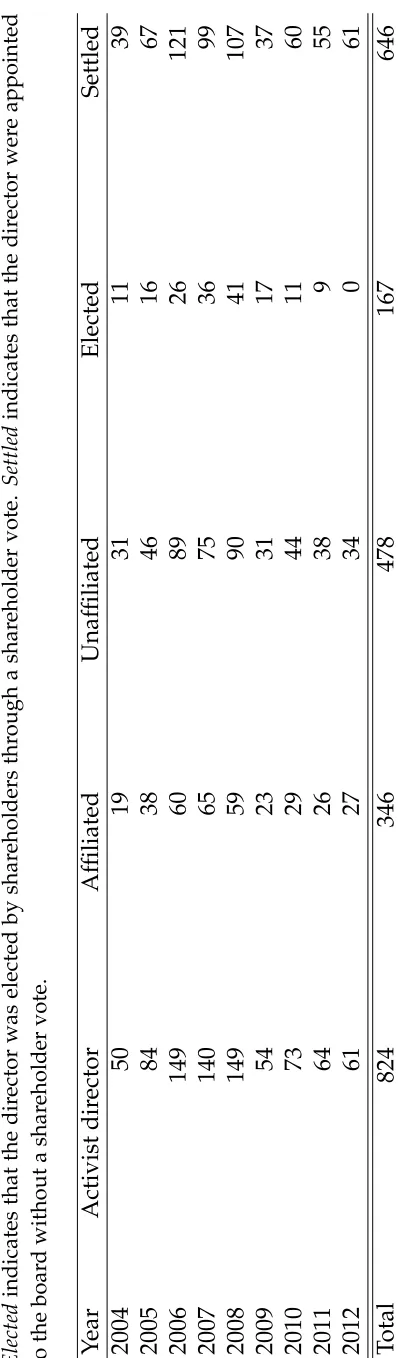
For each activism event in which SharkWatch indicated that the activist obtained board rep-resentation, we used proxy statements (DEF 14A) and current filings (Form 8-K, Item 5.02) to collect names of the directors who were appointed as a result of the activist campaign. We also collected appointment dates and basic biographical details. We then examined subsequent SEC filings to determine whether and, if so, when the director subsequently left the board during our sample period. We classified directors into two categories. The Affiliated category com-prises directors that we identified as employees or principals of the members of the activist group, andUnaffiliatedcovers the rest. Table 2 provides the yearly distribution ofAffiliatedand
Unaffiliateddirectors. Of 824 activist directors appointed as the result of activism campaigns in our sample, 346 are Affiliatedand 478 are Unaffiliated. For illustration, in the Blockbuster case discussed in Section 2, Carl Icahn is clearly an affiliated director, while the other two nominees, “veteran entertainment industry executives” Edward Bleier and Strauss Zelnick, are unaffili-ated.
3.3. Activist holdings
To identify activist holdings of the stock of targeted firms, we use data from WhaleWisdom, which provides comprehensive coverage of SEC Form 13F and 13F/A filings related to hold-ings in at quarter-ends from 2001 onward.7 These filings are required on a quarterly basis
for investors having more than $100 million in assets under management. We find that 1,394 (70.87%) of the activism events in our sample are associated with activist that files on Form 13F.
3.4. Director characteristics
Our director-level data come from Equilar.8 The Equilar database comprises directors of every
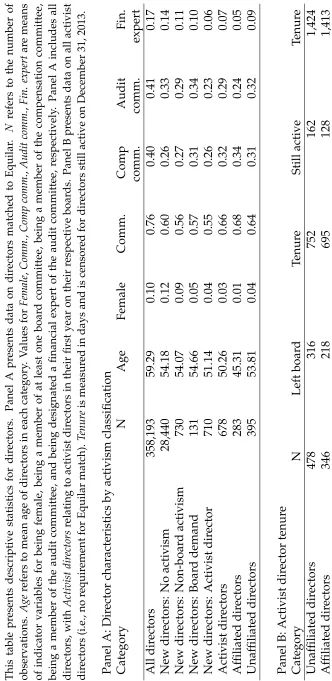
company that files both an annual report and an annual proxy statement (SEC Forms 10-K and DEF 14A, respectively). For each director on a company’s board, Equilar provides director-level information such as committee memberships, gender, age, equity holding, etc. Panel A of Table 3 presents director characteristics for each classification of directors. While we have data on 358,193 directors, the more appropriate comparison group for activist directors, for whom we present data in their first year on the board, is their fellow new directors. We identify 28,440 directors as new directors. We identify 678 activist directors (of our full sample of 824) on Equilar; we find that some activist directors leave within a year (e.g., if the firm is acquired) and Equilar appears not to capture most such directors, as they often do not appear in the proxy statement (DEF 14A), which is the primary source for Equilar’s data. Note that these 678 directors represent almost all of the 710 new directors at these firms, suggesting that we successfully identify activist directors when they exist.
In general, the unaffiliated directors are similar to other new directors on most dimensions except that there is a noticeably smaller number who are female (0.04versus 0.12). However,
affiliated directors (i.e., employees or principals of members of the activist group) appear differ-ent: they are younger (45 years of age), rarely female (0.01) and not often designated financial
experts (0.05). While activist directors appear more likely to become members of the
compen-sation committee in their first year of service (0.66) versus (0.60for directors not associated with
activism campaigns), they are less frequently added to the audit committee (0.29), especially
affiliated directors (0.24), than non-activism directors (0.33), or designated as “audit committee
financial experts” (0.07for activist directors versus0.14for non-activism directors).9
Panel B of Table 3 presents some data on the tenure of our activist directors. About 35% of
both affiliated and unaffiliated activist directors remain on their respective boards at the time
8Equilar is an executive compensation and corporate governance data firm.
9SEC rules require a company to disclose whether it has at least one “audit committee financial expert” serving
of our data collection (December 2013). Affiliated (unaffiliated) directors who have left their respective boards, did so after being on the board for 695 (752) days on average (i.e., they remained on the board for about two years). In many cases, their departure was associated with the company being acquired, going private, or going bankrupt. Affiliated and unaffiliated activist directors who are still on their respective boards in December 2013 have an average tenure of nearly four years. There is no apparent difference between affiliated and unaffiliated directors in these tenure statistics.
3.5. Other data
Data on divestitures and acquisitions as used in Table 8 come from Capital IQ and CRSP. In Tables 4 and 8–11, we use a number of controls drawn from several sources. We calculate
Analyst, the number of analyst forecasts for each firm-year using data from IBES. We derive the proportion of the firm’s outstanding stock held by institutions (Institutional) using data from WhaleWisdom. Data on stock market performance come from CRSP and Ken French’s website. The following variables come from Compustat:Market value, the value of market cap-italization;Book-to-market, market capitalization divided by the book value of common equity;
Leverage, sum of long-term debt and current liabilities divided by sum of long-term debt, cur-rent liabilities and the book value of common equity;Payout, the ratio of the sum of dividends and repurchases divided to EBITDA); ROA, EBITDA divided by the lagged total assets; Sales growth, Sales divided by lagged sales. From Equilar, we get the following variables:Num. direc-tors, the number of directors on the board;Outside percent, the percentage of outside directors;
Age, the average age of directors on the board;Tenure, the average years of directorship on the board; and,Staggered board, an indicator for a classified board.
4. Activist target selection
leverage and dividend payouts (Brav, Jiang and Kim 2010). We extend this analysis to our sample and additionally examine whether the factors that are associated with activists seeking, or getting, board representation differ from those associated with activism in general.
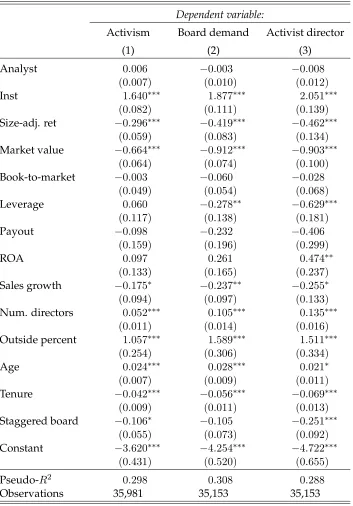
We first examine the circumstances in which firms find themselves as the targets of activists. Panel A of Table 4 reports the results of logistic regressions where the dependent variables are indicators for activism and the sample is the universe of firm-years meeting our sample requirements for the years 2004 to 2012. The first column looks at the probability of being targeted for any kind of activism event, the second column examines the determinants of an activist making demands for board representation, and the third column examines the deter-minants of an activist getting representation on a firm’s board.10 Consistent with prior research
(Brav et al. 2008), we find that size-adjusted returns and growth are negatively associated with being targeted by activists, consistent with activists targeting poorly performing firms. Also, consistent with prior research, we find that smaller companies are more likely to be targeted. We also find in all specifications that activists are more likely to target firms with more direc-tors, consistent with the number of directors being a proxy for poor governance and activists targeting firms with worse governance (Yermack 1996). However, the significantly positive co-efficient on Outside percentis difficult to explain in the same way, as this measure is suggested by some to be a proxy forgoodgovernance (Bhagat and Bolton 2008). We also see evidence that activists are more likely to target firms with greater portion of their shares held by institutional investors, consistent with these investors being more open to supporting activists.
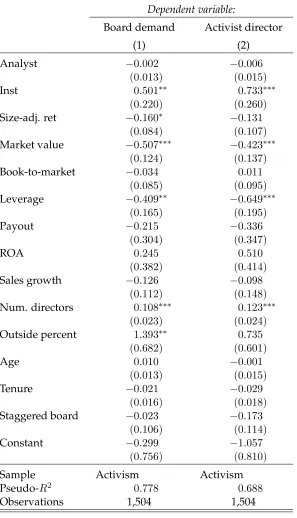
In Panel B of Table 4, we focus on activism events in examining two questions. First, given that a firm has been targeted by activists, what are the factors that are associated with the ac-tivist demanding board seats? Second, given that an acac-tivist has demanded board seats, what factors are associated with the activist’s demands being met? We find evidence that condi-tional on selecting a firm as a target, an activist is more likely to demand board representation when the firm is smaller, and when leverage is lower. Again activists are more likely to
de-10Note that, in contrast to our other analyses, for the purpose of this table, our activism indicators are not
mand board representation at firms with more directors, consistent with activists being more inclined to seek board representation when targeting firms with worse governance (Yermack 1996). We also see evidence that activists are more likely both to seek and to get board represen-tation when targeting firms with greater portion of their shares held by institutional investors, consistent with these investors being more open to supporting activist candidates. We see no evidence of staggered boards preventing activists from getting board representation (coef.
0.173, p > 0.1), suggesting that the effect observed in column (3) of Panel A may arise due
to deterrence of activism entirely. There is little or no relation between prior poor performance and seeking or obtaining board representation. This may be a measurement timing issue, as the Barington/Dillard’s example discussed in Section 2 suggests that poor performance after
the commencement of the activism campaign may be more relevant for determining whether an activist seeks or obtains board representation conditional on targeting a firm; our covariates relate to pre-activism measures of performance.
5. Activist holding periods
We next examine whether the category of activism is associated with the length of time the activist holds the stock. We use 13F filing data to determine when an activist acquires and dis-poses of stock. Because 13F filings are quarterly, our measures of holding period (expressed in days) have some measurement error. We examine three holding periods: Entry–Exit, which runs from the first date on which the stock was held to the last date the stock was held;Annc– Exit, which runs from the date on which activism was first announced (typically with a 13D fil-ing) to exit; andAppt–exit, which runs from the first appointment of an activist director through to the date of exit.11
One issue with measuring holding periods is that censoring is significant in our sample. This occurs because many of the activism campaigns in our sample are recent and the activist con-tinues to hold stock at the time we measure the holding period. Thus to estimate the association
11We measure the exit date as the record date of the first 13F filing in which the stock is no longer part of the
between activism category and holding period, we use censored median regression (Portnoy 2003). Table 5 presents these results. We find that, relative toActivismwithout board demands,
Board demand events have holding periods that are one quarter shorter, though statistical sig-nificance is weak. Turning to Activist director cases, we find a highly significant incremental holding period of 236 days from entry to exit and 352 days from announcement of activism to exit.12 While the estimated median holding period forActivismevents is 860 days (i.e., about
2.4 years), the equivalent for Activist director events is 1,095 days (i.e., about 3 years). From announcement to exit, Activist directoractivists hold the stock for 798 days (2.2 years) and for 601 days (1.6 years) from first appointment of an activist director.
To put these statistics into perspective, it is helpful to consider some benchmarks. Cremers et al. (2013) examine the holding period of various kinds of investors. They examine four categories of investors (banks, pension funds, investment companies, and others) and find that pension funds have the longest duration at 2 years. They also examine the holdings of some institutional investors and provide only one example of an investor with a duration greater than three years, namely the well-known long-term investor, Berkshire Hathaway, which had a duration of between 3 and 4 years during our sample period. Another reference point is provided by the Beyer et al. (2014) survey of investor relation professionals, who consider
2.8years as a cutoff beyond which investors can be considered “long-term” investors. These
benchmarks suggest the three-year holding period of activists getting representation on boards provides them with a relatively long investment horizon.
6. Stock returns
We follow prior research in examining the impact of activism on stock returns, but examine whether stock market reactions to activism differ by the three categories of activism: Activism,
Board demand, andActivist director.
We begin by looking at short-window returns around the announcement of activism. Because
prior research has documented a run-up in the 10 days prior to the public announcement of activism and some drift thereafter, we follow Brav et al. (2008) in using a window beginning 20 days before and ending 20 days after the announcement of activism. For short-window tests, we consider raw, market-adjusted, and size-adjusted returns (R,RM KT, andRSZ, respectively).
Results are reported in Panel A of Table 6. Consistent with prior research, (Brav et al. 2008), we find significant announcement-period returns for activism events, with market-adjusted re-turns ranging from 3.9% to 4.9% for the three categories, and with no statistically significant differences across the categories.13 We get very similar results when we consider returns
win-dows such as( 10,+10)and( 1,+1)days.
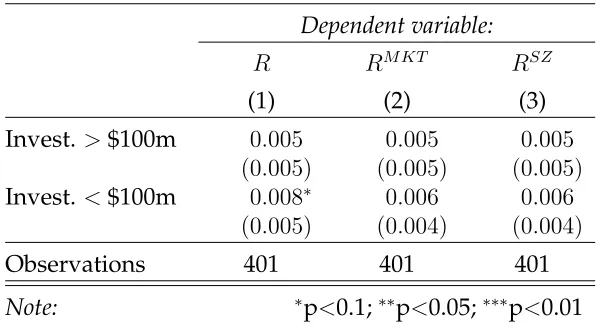
In Panel B of Table 6, we examine the market reaction around the appointment of activist di-rector. We do not find any significant market reaction around this date, perhaps due to the difficulty in measuring exactly when the market learned about the appointment in many cases. Because we did not find any reaction around this date, we partitionActivism directorcases into large and small investments using a cut-off of $100 million, denotedInvest<$100mandInvest > $100m, respectively. This allows for the possibility that the market may react more to ac-tivism when the activist’s stake is higher. However, the results in Panel B suggest no reaction in either partition.
In Panels C and D of Table 6, we examine returns over the 12-month and 36-month periods from the announcement of activism. Due to the greater importance of controlling for risk over longer periods, we also consider Fama-French abnormal returns, using both equal-weighted and value-weighted returns for the associated benchmark portfolios. While we see some large, statistically significant returns in raw returns for three of the four categories, these generally disappear once risk is taken into account. There is relatively weak evidence of positive returns (at the10%level fromttot+12months) for activism not involving activist directors, but returns
for both activist director categories are statistically indistinguishable from zero.
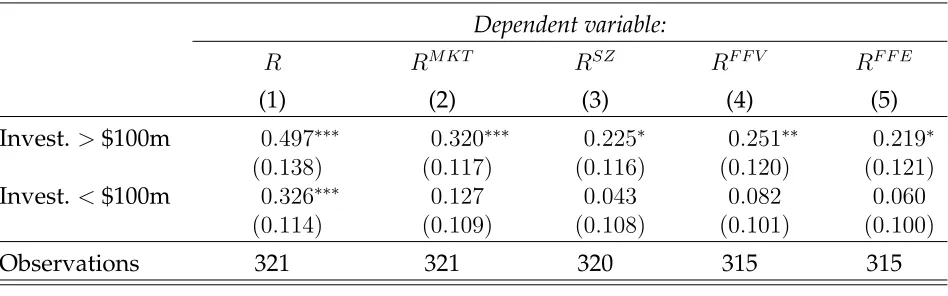
One issue with interpreting the returns for the activist director cases is that the director
ap-13Note that at the time of the announcement of activism, the market would not know which category the
pointments generally occur well after the announcement of activism events. Thus we consider longer-window returns for activist director cases beginning from the appointment of these di-rectors to the board. Results are reported in Panels E (12-month returns) and F (36-month returns) of Table 6. While we do not find positive risk-adjusted returns over either period for smaller investments (i.e., Invest<$100m), we do find evidence over the longer period for larger investments (i.e., Invest > $100m): estimated excess returns relative to a Fama-French value-weighted portfolio are25.1%over the three-year window (p <0.05).
7. Firm outcomes
While stock market reaction provides a useful measure for evaluating the impact of activists, it is not without issues. First, we need to identify the time at which the market learned about the prospect of activist involvement. Second, we need the market to estimate the impact of activism in an unbiased manner and impound this estimate into price promptly. Finally, even if these difficulties are addressed, the stock market reaction does not provide insight into how
activists affect corporate policy and firm value.
In this section, we examine the impact of activists, especially activist directors, on a number of outcomes, with a focus on outcomes that are commonly sought by activists.
7.1. Profitability
We first examine the association between activism and operating performance. Our empirical approach follows that of Bebchuk et al. (2013), which is a modification of the approach used in Brav et al. (2008). Thus we measure operating performance as return on assets calculated as earnings before interest, taxes, depreciation, and amortization (Compustat item oibdp)
di-vided by lagged total assets (at). For each firm-yeart, we construct indicators for activism in yeart+swheres2{ 3, . . . ,+5}, where, for example,Activistt 3takes the value1fort= 2004
We estimate three models. Following Bebchuk et al. (2013), all models include year fixed ef-fects, market value, and firm age, and indicators for activism. Following, Bebchuk et al. (2013), models (A) and (B) add industry and firm fixed effects, respectively. To examine a possible
incremental effect of an activist getting board representation, Model (C) refines model (B) by including indicators for activist director appointments in years ranging from three years prior (Activist directort 3) to five years subsequent (Activist directort+5).
Table 7 presents results. The quantities presented in the table represent estimates of the impact of activism and activist directors, and are calculated as the difference between the estimated coefficients on the respective activism indicators for years t +s and t, where s 2 {1, . . . ,5}.
With model (A), we find significant increases inROAfor yearst+ 3throught+ 5. Once we add
firm fixed effects, i.e., in models (B) and (C), we find statistically significant increases in ROA
in all five years. These effects are economically significant, with the five-year increase in ROA
exceeding2%in both models.
Looking at the incremental effect of getting an activist candidate on the board, we do not de-tect a statistically significant effect. While the incremental effects are positive in all years, they are statistically indistinguishable from zero. If an incremental effect does exist, our failure to detect it statistically may be attributed to a lack of power stemming from a small number of observations (e.g., we have just 34 observations withActivist directort+5equal to one) and
mul-ticollinearity between our activism indicators (in many cases, the activist director is appointed in the same year that the activist campaign commences).
7.2. Divestiture and acquisitions
The first set of outcomes we examine relate to mergers and acquisitions. The examples dis-cussed above suggest that one concern activists have is with excessive spending on acquisitions by target firms. Thus, the first outcome we consider isAcquisition, an indicator for whether the firm completed any acquisitions in the three years a given fiscal year. Greenwood and Schor (2009, 362) suggest that announcement returns associated with activism “are largely explained by the ability of activists to force target firms into a takeover.” Thus one outcome we consider,
Acquired, is an indicator for whether the firm was acquired in the three years after a given fiscal year. Finally, often activists urge firms to divest businesses. Thus our third outcome is Divesti-ture, an indicator for whether the firm divested significant assets in the three years after a given fiscal year. We regress these indicators on industry and year dummies as well as the following controls (as described in Section 3),Analyst,Institutional,Market value, Book-to-market,Leverage,
Payout,ROA,Sales growth,Outside percent,Age,Tenure, andStaggered board.
Table 8 presents these results. Examining the first column in Table 8, we see all three categories of activism are associated with significantly lower probability of acquisitions (coefs 0.081 to 0.116, p < 0.01). On the other hand, activism is positively associated with being acquired
(coefs0.044to0.150), but the association is strongest when activism is in the categoryNon-board
activism and lower when an activist director is appointed (the difference between Non-board activismand the other two forms of activism is statistically significant). Finally, divestitures are only associated with activism of the formActivist director(coef.0.058,p < 0.05).
7.3. CEO turnover and compensation
We code the indicator CEO turnoverequal to1if the CEO at the end of year tis no longer the CEO (but the company still exists) in yeart+ 3. For total CEO pay, we regress total CEO
com-pensation in year t+ 3on controls, including CEO compensation in yeart, and indicators for each category of activism. To assess change in performance-based compensation, we regress the proportion of CEO compensation that is variable (i.e., not salary) on its lagged value, con-trols, and activism indicators. We regress these variables on their lagged (year t) values, in-dustry and year dummies as well as the following controls (as described in Section 3),Analyst,
Institutional, Market value, Book-to-market, Leverage, Payout, ROA, Sales growth, Outside percent,
Age,Tenure, andStaggered board.
Results of our analysis are presented in Table 9. We find no statistically significant association between Non-board activism and CEO turnover. We find positive associations between CEO turnover and both Board demand (coef. 0.089, p < 0.05) and Activist director (coef. 0.153, p <
0.01). We find that CEO compensation is negatively associations between CEO compensation
and bothNon-board activism(coef. 0.098,p <0.01) andActivist director(coef. 0.132,p < 0.01).
Finally, we see some evidence of reduction in the proportion of compensation that is non-salary associated with Non-board activism, but not with the other two categories of activism. These results collectively point to a changing pattern of CEO incentives in the presence of activist directors.
7.4. Capital structure and payouts
Among the most common demands activists make are requests for firms to increase the pay-ment of dividends, reduce cash holdings, and to increase leverage. In Table 10, we examine the association between activism and measures of cash holding, leverage, and shareholder pay-out (dividends and share repurchases). We find that only Activist director is associated with reduced cash holdings (coef. 0.029, p < 0.05). We find that leverage is associated with both
Non-board activism(coef.0.018,p <0.01) andActivist director(coef.0.021,p < 0.05). Finally, only
in Table 10 points to activist directors being associated with the kinds of capital structure and payout changes demands frequently demanded by activists.
As outcome variables we consider Cash, calculated as the ratio of total cash and short-term investments to the book value of total assets; Leverage, measured as the ratio of book value of debt to the sum of the book value of debt and equity; and,Payout, measured as the ratio of total dividends and share repurchases to EBITDA for the three years after year t. We regress these variables on their year-tvalues, industry and year dummies as well as the following controls (as described in Section 3), Analyst, Institutional, Market value, Book-to-market, Leverage, Payout,
ROA,Sales growth,Outside percent,Age,Tenure, andStaggered board.
7.5. Investment
Finally, we examine the association between activism and three areas of spending commonly regarded as investment: capital expenditures, research and development (R&D), and adver-tising. We measure investment using the following proxies: CapEx, measured as the ratio of capital expenditure for three years after announcement of activism to the lagged book value of total assets; R&D, measured as the ratio of total R&D expenditure for three years after an-nouncement of activism to the lagged book value of total assets; and, Advertising, measured as the ratio of advertising expenditure for three years after announcement of activism to the lagged book value of total assets. We regress these variables on their year-t values, industry and year dummies as well as the following controls (as described in Section 3), Analyst, Insti-tutional, Market value, Book-to-market, Leverage, Payout, ROA, Sales growth, Outside percent, Age,
Tenure, andStaggered board.
Results are presented in Table 11. We find negative associations between all three categories of activism and capital expenditure, the coefficient on Activist director(coef. 0.054, p < 0.01) is
significantly more negative than that onNon-board activism(coef. 0.020,p < 0.01). Only with
Activist directordo we see a negative associations with R&D spending (coef. 0.024, p < 0.01)
Overall, the evidence in Table 11 is consistent with activist directors playing a significant role in curbing expenditures on capital, research and development (R&D), and advertising. However, it is unclear whether this reflects curtailment of excessive investments or, as critics of activists might suggest, underinvestment and a focus on the short term.
8. Conclusion
In recent years, the phenomenon of hedge fund managers attempting to actively intervene in the governance of firms they invest in has gained prominence. These fund managers often lay-out an investment thesis regarding their target firms and vigorously engage with their targets to realize their thesis. Instead of passively waiting for an investment hypothesis to validate itself (like most institutional fund managers do), activist hedge fund managers often demand seats on the board of their targets as a mechanism to effect change in investee firms and thereby actively control the outcome of their investment. While attaining directorship might not be the end goal, it is perhaps the stick that activists use to force companies to take their demands seriously. Given the importance that the demand for board positions has in the activist game plan, we examine hedge fund activism thorough the lens of activist directors, i.e., cases where candidates sponsored by the activists become directors of the target companies.
We find that activists are more likely to gain board seats at smaller firms and those with weaker stock price performance. As in prior research, we find positive announcement-period returns of around 4–5% when a firm is targeted by activists, including in cases where the activists ex-post gain board seats, and a 2% increase in return on assets over the subsequent one to five years. When they have board seats, activists remain as shareholders long enough to be considered long-term investors by conventional standards, with holding periods averaging three years. The long-term shareholding combined with positive stock-price and operating performance effects suggests that the short-termism concern often expressed in the context of hedge fund activists may be less apparent in cases when activists become directors.
target firms. We find evidence of increased divestiture, decreased acquisition activity, higher probability of being acquired, lower cash balances, higher payout, greater leverage, higher CEO turnover, lower CEO compensation, and reduced investment. With the exception of the probability of being acquired, the estimated effects are generally greater when activists obtain board representation, consistent with board representation being an important mechanism for bringing about the kinds of changes that activists often demand.
References
Bebchuk, L. A.: 2007, The myth of the shareholder franchise,Virginia Law Review93(3), 675–732. Bebchuk, L. A., Brav, A. and Jiang, W.: 2013, The long-term effects of hedge fund activism,
SSRN Electronic Journal.
Becht, M., Franks, J., Mayer, C. and Rossi, S.: 2010, Returns to shareholder activism: Evidence from a clinical study of the Hermes UK Focus Fund,Review of Financial Studies23(3), 3093– 3129.
Beyer, A., Larcker, D. F. and Tayan, B.: 2014, 2014 study on how investment horizon and expec-tations of shareholder base impact corporate decision-making,Technical report.
Bhagat, S. and Bolton, B.: 2008, Corporate governance and firm performance,14(3), 257–273. Brav, A., Jiang, W. and Kim, H.: 2010, Hedge fund activism: A review,Foundations and Trends®
in Finance.
Brav, A., Jiang, W. and Kim, H.: 2013, The real effects of hedge fund activism: Productivity, asset allocation, and industry concentration,Working paperpp. 1–49.
Brav, A., Jiang, W., Partnoy, F. and Thomas, R.: 2008, Hedge fund activism, corporate gover-nance, and firm performance,The Journal of Finance63(4), 1729–1775.
Brav, A., Jiang, W. and Tian, X.: 2014, Shareholder power and corporate innovation: Evidence from hedge fund activism,SSRN Electronic Journal.
Carleton, W. T., Nelson, J. M. and Weisbach, M. S.: 1998, The influence of institutions on cor-porate governance through private negotiations: Evidence from TIAA-CREF,The Journal of Finance53(4).
Cremers, M., Pareek, A. and Sautner, Z.: 2013, Stock duration and misvaluation,Working paper
Dodd, P. and Warner, J. B.: 1983, On corporate governance: A study of proxy contests, Journal of Financial Economics11(1-4), 401–438.
Gantchev, N.: 2013, The costs of shareholder activism: Evidence from a sequential decision model,Journal of Financial Economics107(3), 610–631.
Gow, I. D., Srinivasan, S. and Shin, S.-P. S.: 2014, Consequences to directors of shareholder activism,HBS working paper.
Greenwood, R. and Schor, M.: 2009, Investor activism and takeovers, Journal of Financial Eco-nomics92(3), 362–375.
G ¨uner, A. B., Malmendier, U. and Tate, G.: 2008, Financial expertise of directors, Journal of Financial Economics68(2), 323–354.
Huang, Q., Jiang, F., Lie, E. and Yang, K.: 2014, The role of investment banker directors in M&A,
Journal of Financial Economics112(2), 269–286.
Klein, A. and Zur, E.: 2009, Entrepreneurial shareholder activism: hedge funds and other pri-vate investors,The Journal of Finance64(1), 187–229.
Mulherin, J. H. and Poulsen, A. B.: 1998, Proxy contests and corporate change: Implications for shareholder wealth,Journal of Financial Economics47(3), 279–313.
Portnoy, S.: 2003, Censored regression quantiles, Journal of the American Statistical Association
98(464), 1001–1012.
Pound, J.: 1988, Proxy contests and the efficiency of shareholder oversight, Journal of Financial Economics20, 237–265.
Smith, M. P.: 1996, Shareholder activism by institutional investors: Evidence from CalPERS,
The Journal of Finance51(1), 227–252.
Yermack, D.: 1996, Higher market valuation of companies with a small board of directors,
Table 4: Activist target selection
All regressions in this table include the following controls measured for the prior fiscal year-end: An-alyst, the number of analyst forecasts for each firm-year (I/B/E/S);Institutional, the proportion of the firms outstanding stock held by institutions;Size-adj. ret, twelve-month size-adjusted returns calculated as raw return over a year minus return for the size-matched decile provided by CRSP;Market value, the value of market capitalization; Book-to-market, market capitalization divided by the book value of com-mon equity; Leverage, sum of long-term debt and current liabilities divided by sum of long-term debt, current liabilities and the book value of common equity; Payoutthe ratio of the sum of dividends and repurchases divided to EBITDA);ROA, EBITDA divided by the lagged total assets;Sales growth, Sales divided by lagged sales;Num. directors, the number of directors on the board;Outside percent, the per-centage of outside directors;Age, the average age of directors on the board;Tenure, the average years of directorship on the board;Staggered board, indicator for staggered board. All controls are winsorized at the1%and99%levels. Values in parentheses are standard errors clustered by firm. *** (**, *) indicates
Table 4: Activist target selection
Panel A presents logit regression where the dependent variables are indicators for being targeted for activism in any category (Non-board activism, Board demand, or Activist director, column 1), being the target of an activist demanding or getting board seats (Board demand or Activist director, Column 2) and activists getting board seats (Activist director, Column 3). Sample includes firm-years with and without activism.
Panel A: Activism, board demands and activist directors
Dependent variable:
Activism Board demand Activist director
(1) (2) (3)
Analyst 0.006 0.003 0.008
(0.007) (0.010) (0.012)
Inst 1.640⇤⇤⇤ 1.877⇤⇤⇤ 2.051⇤⇤⇤
(0.082) (0.111) (0.139)
Size-adj. ret 0.296⇤⇤⇤ 0.419⇤⇤⇤ 0.462⇤⇤⇤
(0.059) (0.083) (0.134)
Market value 0.664⇤⇤⇤ 0.912⇤⇤⇤ 0.903⇤⇤⇤
(0.064) (0.074) (0.100)
Book-to-market 0.003 0.060 0.028
(0.049) (0.054) (0.068)
Leverage 0.060 0.278⇤⇤ 0.629⇤⇤⇤
(0.117) (0.138) (0.181)
Payout 0.098 0.232 0.406
(0.159) (0.196) (0.299)
ROA 0.097 0.261 0.474⇤⇤
(0.133) (0.165) (0.237)
Sales growth 0.175⇤ 0.237⇤⇤ 0.255⇤
(0.094) (0.097) (0.133)
Num. directors 0.052⇤⇤⇤ 0.105⇤⇤⇤ 0.135⇤⇤⇤
(0.011) (0.014) (0.016)
Outside percent 1.057⇤⇤⇤ 1.589⇤⇤⇤ 1.511⇤⇤⇤
(0.254) (0.306) (0.334)
Age 0.024⇤⇤⇤ 0.028⇤⇤⇤ 0.021⇤
(0.007) (0.009) (0.011)
Tenure 0.042⇤⇤⇤ 0.056⇤⇤⇤ 0.069⇤⇤⇤
(0.009) (0.011) (0.013)
Staggered board 0.106⇤ 0.105 0.251⇤⇤⇤
(0.055) (0.073) (0.092)
Constant 3.620⇤⇤⇤ 4.254⇤⇤⇤ 4.722⇤⇤⇤
(0.431) (0.520) (0.655)
Pseudo-R2 0.298 0.308 0.288
Observations 35,981 35,153 35,153
Table 4: Activist target selection
Panel B presents logit regression where the dependent variables are indicators for activist demanding or getting board seats (Board demand or Activist director, Column 1) and activists getting board seats (Activist director, Column 2) conditional on the firm being targeted by activists.
Panel B: Activism, board demand and activist director (activism only)
Dependent variable:
Board demand Activist director
(1) (2)
Analyst 0.002 0.006
(0.013) (0.015)
Inst 0.501⇤⇤ 0.733⇤⇤⇤
(0.220) (0.260)
Size-adj. ret 0.160⇤ 0.131
(0.084) (0.107)
Market value 0.507⇤⇤⇤ 0.423⇤⇤⇤
(0.124) (0.137)
Book-to-market 0.034 0.011
(0.085) (0.095)
Leverage 0.409⇤⇤ 0.649⇤⇤⇤
(0.165) (0.195)
Payout 0.215 0.336
(0.304) (0.347)
ROA 0.245 0.510
(0.382) (0.414)
Sales growth 0.126 0.098
(0.112) (0.148)
Num. directors 0.108⇤⇤⇤ 0.123⇤⇤⇤
(0.023) (0.024)
Outside percent 1.393⇤⇤ 0.735
(0.682) (0.601)
Age 0.010 0.001
(0.013) (0.015)
Tenure 0.021 0.029
(0.016) (0.018)
Staggered board 0.023 0.173
(0.106) (0.114)
Constant 0.299 1.057
(0.756) (0.810)
Sample Activism Activism
Pseudo-R2 0.778 0.688
Observations 1,504 1,504
Table 5: Activist holding periods
Table presents results of censored median regression analysis of holding period (days) on activism category. Entry–exit refers to the time (in days) between the record date of the first filing by the activist where the target stock is listed in the activist’s portfolio through to the record date of the first filing where it is not (exit date) Annc–exit refers to the time between announcement of activism and the exit date. Appt–exit refers to the time between the first activist director appointment and the exit date.
Regression coefficients
Entry–exit Annc–exit Intercept 859.721⇤⇤⇤ 446.120⇤⇤⇤
(2.753) (16.282)
Board demand 91.592 1.224 (193.231) (43.946)
Activist director 235.687⇤⇤⇤ 352.040⇤⇤⇤
(56.649) (57.296)
Implied median holding periods (days)
Entry–exit Annc–exit Appt–exit
Non-board activism 860 446
Board demand 768 447
Table 6: Stock returns
Table presents returns by category of activism whereR,RM KT,RSZ denote raw,
market-adjusted, and size-adjusted returns respectively.
Panel A: Days 20to+20around announcement of activism.
Dependent variable:
R RM KT RSZ
(1) (2) (3)
Non-board activism 0.053⇤⇤⇤ 0.048⇤⇤⇤ 0.049⇤⇤⇤ (0.009) (0.008) (0.008)
Board demand 0.044⇤⇤⇤ 0.038⇤⇤⇤ 0.039⇤⇤⇤
(0.014) (0.013) (0.012)
Activist director 0.047⇤⇤ 0.042⇤⇤ 0.041⇤⇤
(0.021) (0.020) (0.020)
Observations 1,892 1,892 1,890
Note: ⇤p<0.1;⇤⇤p<0.05;⇤⇤⇤p<0.01
Panel B: Days 1to+1around appointment.
Dependent variable:
R RM KT RSZ
(1) (2) (3)
Invest. >$100m 0.005 0.005 0.005 (0.005) (0.005) (0.005)
Invest. <$100m 0.008⇤ 0.006 0.006
(0.005) (0.004) (0.004)
Observations 401 401 401
Table 6: Stock returns
Table presents returns by category of activism whereR,RM KT,RSZ denote raw,
market-adjusted, and size-adjusted returns respectively. RF F V (RF F E) denotes
value-weighted (equal-weighted) Fama-French three-factor adjusted returns. Panel C: From activism announcement (montht) to montht+ 12.
Dependent variable:
R RM KT RSZ RF F V RF F E
(1) (2) (3) (4) (5)
Non-board activism 0.127⇤⇤⇤ 0.062⇤⇤⇤ 0.051⇤⇤ 0.029 0.023
(0.027) (0.024) (0.022) (0.019) (0.019)
Board demand 0.874⇤⇤ 0.759⇤ 0.703⇤ 0.114⇤⇤ 0.108⇤⇤ (0.426) (0.424) (0.420) (0.052) (0.052)
Activist director 0.110⇤⇤ 0.021 0.004 0.007 0.014
(0.043) (0.036) (0.039) (0.031) (0.030)
Observations 1,925 1,925 1,916 1,809 1,809
Table 6: Stock returns
Table presents returns by category of activism whereR,RM KT,RSZ denote raw,
market-adjusted, and size-adjusted returns respectively. RF F V (RF F E) denotes
value-weighted (equal-weighted) Fama-French three-factor adjusted returns. Panel D: From activism announcement (montht) to montht+ 36.
Dependent variable:
R RM KT RSZ RF F V RF F E
(1) (2) (3) (4) (5)
Non-board activism 0.676⇤⇤ 0.518⇤⇤ 0.459⇤ 0.010 0.009 (0.267) (0.259) (0.258) (0.032) (0.032)
Board demand 1.352⇤⇤ 1.150⇤⇤ 1.001⇤⇤ 0.064 0.048
(0.528) (0.515) (0.509) (0.062) (0.062)
Activist director 0.241⇤⇤ 0.098 0.001 0.031 0.051
(0.096) (0.088) (0.084) (0.056) (0.055)
Observations 1,657 1,657 1,649 1,586 1,586
Note: ⇤p<0.1;⇤⇤p<0.05;⇤⇤⇤p<0.01
Panel E: From activist appointment date (montht) to montht+ 12.
Dependent variable:
R RM KT RSZ RF F V RF F E
(1) (2) (3) (4) (5)
Invest. >$100m 0.224⇤⇤⇤ 0.121⇤⇤ 0.089⇤ 0.045 0.035
(0.074) (0.057) (0.054) (0.050) (0.048)
Invest. <$100m 0.079⇤ 0.005 0.048 0.007 0.015 (0.047) (0.042) (0.042) (0.043) (0.042)
Observations 411 411 410 397 397
Table 6: Stock returns
Table presents returns by category of activism whereR,RM KT,RSZ denote raw,
market-adjusted, and size-adjusted returns respectively. RF F V (RF F E) denotes
value-weighted (equal-weighted) Fama-French three-factor adjusted returns. Panel F: From activist appointment date (montht) to montht+ 36.
Dependent variable:
R RM KT RSZ RF F V RF F E
(1) (2) (3) (4) (5)
Invest. >$100m 0.497⇤⇤⇤ 0.320⇤⇤⇤ 0.225⇤ 0.251⇤⇤ 0.219⇤
(0.138) (0.117) (0.116) (0.120) (0.121)
Invest. <$100m 0.326⇤⇤⇤ 0.127 0.043 0.082 0.060
(0.114) (0.109) (0.108) (0.101) (0.100)
Observations 321 321 320 315 315
Table 7: Operating performance
Table presents estimates of the impact of activism on return on assets over 5 years after the announce-ment of activism. The empirical approach follows that of Bebchuk et al. (2013). We regress return on assets on indicators for activism events in any of the three categories, including Board demand and
Activist director, ranging from three years prior (Activismt 3) to five years subsequent (Activismt+5). We
estimate three models. Following Bebchuk et al. (2013), all models include year fixed effects, market value, and firm age, and indicators for activism. Models (A) and (B) add industry and firm fixed effects, respectively. Model (C) also adds firm fixed effects, as well as indicators for activist director appointments in years ranging from three years prior (Activist directort 3) to five years subsequent
(Activist directort+5). The quantities presented in the table represent estimates of the impact of activism
and activist directors, and are calculated as the difference between the estimated coefficients on the respective activism indicators for years t+sandt, wheres 2 {1, . . . ,5}. Numbers in parentheses are
heteroskedasticity-robust standard errors. *** (**, *) indicates significance at the 1% (5%, 10%) level.
(1) (2) (3) (4)
Activism Activism Activism Activist director
ROAt+1 ROAt 0.006 0.009⇤⇤ 0.010⇤⇤ 0.003
(0.008) (0.004) (0.004) (0.008)
ROAt+2 ROAt 0.009 0.011⇤⇤ 0.012⇤⇤ 0.004
(0.008) (0.005) (0.006) (0.013)
ROAt+3 ROAt 0.012⇤ 0.015⇤⇤⇤ 0.014⇤⇤ 0.011
(0.009) (0.006) (0.006) (0.013)
ROAt+4 ROAt 0.015⇤⇤ 0.013⇤⇤ 0.013⇤⇤ 0.002
(0.008) (0.006) (0.007) (0.014)
ROAt+5 ROAt 0.020⇤⇤ 0.021⇤⇤⇤ 0.022⇤⇤ 0.001
(0.011) (0.008) (0.009) (0.015)
Model: (A) (B) (C) (C)
Fixed effects: Industry, year Firm, year Firm, year Firm, year
Number of observations with activism indicator equal to1
Activism Activist director
Yeart 3 920 172
Yeart 2 968 177
Yeart 1 999 179
Yeart 1016 183
Yeart+1 841 136
Yeart+2 673 104
Yeart+3 547 82
Yeart+4 420 48
[image:43.612.57.556.539.677.2]Table 8: Divestitures and acquisitions
Table presents regressions of outcome variables on firm-year level activism indicators. Acquisition indi-cates the firm completed acquisitions within three years after yeart.Acquiredindicates delisting within
three years of year twith CRSP delisting code dlstcd 2 [200,399]. Divestitureindicates the firm
com-pleted divestitures and spinoffs within three years of year t. Regressions include industry and year
fixed effects and the following controls (Control variables are measured for the fiscal year-end of yeart):
Total assets, book value of total assets;Analyst, number of analyst forecasts for each firm-year (I/B/E/S);
Institutional, proportion of the firm’s outstanding stock held by institutions;Size-adj. ret, twelve-month size-adjusted returns;Market value, the value of market capitalization;Book-to-market, market capitaliza-tion divided by the book value of common equity; Leverage, ratio of debt to debt plus book value of common equity; Payoutthe ratio of the sum of dividends and repurchases divided to EBITDA; ROA, EBITDA divided by the lagged total assets;Sales growth, sales divided by lagged sales;Num. directors, the number of directors on the board; Outside percent, the percentage of outside directors;Age, the av-erage age of directors; Tenure, the average tenure of directors; Staggered board, indicator for staggered board. All controls andCEO compare winsorized at the1%and99%levels. Values in parentheses are
standard errors clustered by firm. *** (**, *) indicates significance at the 1% (5%, 10%) level.
Dependent variable:
Acquisition Acquired Divestiture
(1) (2) (3)
Non-board activism 0.084⇤⇤⇤ 0.150⇤⇤⇤ 0.024
(0.016) (0.017) (0.018)
Board demand 0.081⇤⇤⇤ 0.081⇤⇤⇤ 0.047
(0.029) (0.027) (0.030)
Activist director 0.116⇤⇤⇤ 0.044⇤⇤ 0.058⇤⇤
(0.024) (0.022) (0.023)
Constant 0.066 0.255⇤⇤⇤ 0.229⇤⇤
(0.086) (0.052) (0.100)
F-tests for equal coefficients (p-values)
Board demand = Activist director 0.310 0.261 0.745
Non-board activism = Activist director 0.202 0.000 0.195
Non-board activism = Board demand 0.937 0.018 0.493
Observations 86,882 86,235 86,882
Table 9: CEO turnover and compensation
Table presents regressions of variables on firm-year level activism categorical variables. CEO exit in-dicates a change in CEO between the end of year t and the end of year t+ 3. CEO compt+3 is log of
total CEO compensation in yeart+ 3Perf compis the percentage of CEO compensation that not salary.
Controls are as described in Table 8. Values in parentheses are standard errors clustered by firm. *** (**, *) indicates significance at the 1% (5%, 10%) level.
Dependent variable:
CEO exit(t+1,t+3) CEO compt+3 Perf compt+3
(1) (2) (3)
Non-board activism 0.023 0.098⇤⇤⇤ 0.063⇤⇤⇤
(0.023) (0.029) (0.023)
Board demand 0.089⇤⇤ 0.017 0.009
(0.042) (0.053) (0.024)
Activist director 0.153⇤⇤⇤ 0.132⇤⇤⇤ 0.029
(0.038) (0.047) (0.018)
Dep. var.t 0.042⇤⇤⇤ 0.426⇤⇤⇤ 0.076⇤⇤⇤
(0.010) (0.010) (0.029)
Constant 0.105 6.557⇤⇤⇤ 0.108
(0.091) (0.189) (0.161)
F-tests for equal coefficients (p-values)
Board demand = Activist director 0.212 0.087 0.136
Non-board activism = Activist director 0.001 0.499 0.210
Non-board activism = Board demand 0.146 0.158 0.026
Observations 39,762 49,757 49,779
Table 10: Capital structure
Cashis calculated as the ratio of total cash and short-term investments to the book value of total assets.
Leverageis measured as the ratio of book value of debt to the sum of the book value of debt and equity.
Payoutis measured as the ratio of total dividends and share repurchases to EBITDA for the three years after yeart. Controls are as described in Table 8. Values in parentheses are standard errors clustered by
firm. *** (**, *) indicates significance at the 1% (5%, 10%) level.
Dependent variable:
Cash Leverage Payout
(1) (2) (3)
Non-board activism 0.008 0.018⇤⇤⇤ 0.052
(0.008) (0.007) (0.061)
Board demand 0.015 0.002 0.050
(0.015) (0.007) (0.064)
Activist director 0.029⇤⇤ 0.021⇤⇤ 0.112⇤⇤
(0.013) (0.010) (0.056)
Dep. var.t 0.876⇤⇤⇤ 0.882⇤⇤⇤ 0.328⇤⇤⇤
(0.018) (0.007) (0.015)
Constant 0.025 0.012 0.120⇤⇤
(0.021) (0.012) (0.053)
F-tests for equal coefficients (p-values)
Board demand = Activist director 0.466 0.060 0.412
Non-board activism = Activist director 0.112 0.773 0.040
Non-board activism = Board demand 0.688 0.034 0.223
Observations 62,226 62,262 59,475
Table 11: Investment
Table presents regressions of variables on firm-year level activism categorical variables. CapExis mea-sured as the ratio of capital expenditure for three years after announcement of activism to the lagged book value of total assets. R&Dis measured as the ratio of total R&D expenditure for three years after announcement of activism to the lagged book value of total assets. Advertisingis measured as the ratio of advertising expenditure for three years after announcement of activism to the lagged book value of total assets. Controls are as described in Table 8. Values in parentheses are standard errors clustered by firm. *** (**, *) indicates significance at the 1% (5%, 10%) level.
Dependent variable:
CapEx R&D Advertising
(1) (2) (3)
Non-board activism 0.020⇤⇤⇤ 0.003 0.002
(0.007) (0.003) (0.002)
Board demand 0.028⇤⇤⇤ 0.001 0.003⇤
(0.009) (0.008) (0.002)
Activist director 0.054⇤⇤⇤ 0.024⇤⇤⇤ 0.005⇤⇤⇤
(0.010) (0.007) (0.001)
Dep. var.t 2.336⇤⇤⇤ 3.273⇤⇤⇤ 3.105⇤⇤⇤
(0.060) (0.053) (0.036)
Constant 0.087⇤⇤⇤ 0.006 0.003
(0.010) (0.007) (0.004)
F-tests for equal coefficients (p-values)
Board demand = Activist director 0.040 0.007 0.268
Non-board activism = Activist director 0.004 0.001 0.124
Non-board activism = Board demand 0.458 0.607 0.689
Observations 62,387 62,387 62,387