SMALLHOLDERS COTTON FARMING SYSTEM IN PARBHANI,
MAHARASHTRA
P. M. Tayade1 and Prema Borkar2
1
Department of Agricultural Economics, Vasantrao Naik Marathwada Agricultural University, Parbhani, 2
Gokhale Institute of Politics and Economics (Deemed to be a University), Pune – 411004
Abstract
Inefficiency in the use and allocation of resources constitute a major problem to increased agricultural production in Parbhani. This study analyzed the efficiency of resource use in smallholders cotton production in Parbhani district, Maharashtra. Data were collected from a random sample of 83 cotton farmers using questionnaire. The study reveals that there is under utilization of farm size and plant protection measures under consideration. In addition seed and hired labour was a significant factor influencing output level of cotton in the area. The result indicates that cotton production has an increasing return to scale. Also, there are different farming systems operated by cotton small holders in the study area. Incorporating policy measures of efficient use of production inputs are also to guard against all bids that may stands as obstacles towards efficient use of these production inputs were suggested.
Keywords: Resource use, Cotton production, efficiency, Parbhani district
I. INTRODUCTION
As the leading natural fiber crop, cotton is an important agricultural commodity, providing income to millions of farmers worldwide. Commercial cotton is grown in more than 80 countries, including Australia, China, Egypt, India, Pakistan, the USA and Uzbekistan; more than 150 countries are involved in import and export of cotton. Cotton fibre can be used for producing a wide range of commodities, ranging from textile fabrics and computer screens to automobile brakes. At the household level, cotton is an important cash crop for millions of farmers worldwide, and the income which it generates contributes to rural household food security, especially in developing countries.
Maharashtra has more area under the cotton crop than China in the current marketing year, but it is still in an unenviable situation as its yield level has been the lowest even among producing states in India. The cotton acreage in Maharashtra is projected to exceed the coverage of the crop in China in the current marketing year. While the cotton coverage in the state remained close to 42 lakh hectares in 2015-16, the entire area under the fibre crop in China could be as low as 38 lakh hectares, according to an estimate by the International Cotton Advisory Committee (ICAC). India beat China for the first time to become the world’s largest cotton producer in 2014-15.
Although the state-run Cotton Advisory Board is yet to firm up estimates of state-wise cotton production and yield for 2015-16, it can be safely assumed that productivity in Maharashtra would be around the same level as last year (337 kg), as the state has witnessed wide-scale dry-spells for a second straight year now. The yield level in the state has been abysmally low, mainly due to poor farm practices, a lack of adequate irrigation network and frequent dry-spells in some regions.
allocation and productivity is an important aspect of increased agricultural production, which is also associated with the management of the farmers, who employ these resources in production. Furthermore, efficiency in the use of available resources is a major pivot for a profitable farm enterprise. Increased production will have to come from increased yield. Production of cotton in Maharashtra is mainly in the hands of small scale farmers who are still using unimproved farming techniques. Actual yields of cotton differ significantly from potential yields, and this has been attributed to low resource productivity. It is, therefore, necessary to examine resource use efficiency among cotton farmers.
In a bid to help farmers increase productivity, the focus is usually on whether farmers are using better and improved technologies. It is however necessary to investigate whether farmers are using better and improved technologies. It is however necessary to investigate whether these farmers are even making maximum use of what is available to them in terms of inputs so that the stakeholders involved in agriculture will be convinced that the new technologies they intend to introduce to farmers will be used efficiently and cost effectively to boost output. Farmers might use resources rationally but not at the economic optimal level. As the aim of every agribusiness firm is to maximize profit while minimizing cost, it is pertinent to determine the efficiency of resource-use.
Notable problems of cotton production include inappropriate decision on how best to allocate resources, inadequate use of corresponding production inputs and inadequate adoption of improved technologies by farmers. Also, farmers might use resources rationally, but not at the economic optimal level. All these contribute to low output. Therefore, it is proper to examine resource productivity in cotton production. This study was undertaken to analyze efficiency of resource-use in cotton production in Parbhani district of Maharashtra state.
II. MATERIALS AND METHODS
The study was conducted in Parbhani district of Maharashtra state. Primary and secondary data were used for the study. The primary data were obtained using well structured questionnaire and administered to cotton farmers. Other information were obtained from journals and other related materials.
Purposive and simple random samplings were used in drawing the sample for the study. The study area was divided into five tahsils. Five tahsils were selected randomly. From the selected tahsils, three were purposively selected because of the large concentration of cotton farmers, where a proportionate size of cotton farmers were selected randomly from the list of the cotton farmers collected from the local gram panchayat. One hundred (100) cotton farmers were served with questionnaires. In all 83 filled questionnaires were finally analyzed. The remaining ones were either returned due to non-response, or reported to have been misplaced by farmers who opted to fill it themselves or wrongly filled therefore found un-usable.
Data analytical technique.
Both descriptive and quantitative analyses were used in the study. The descriptive analysis was used to analyze the socio-demographic characteristics of cotton farming households and the farming system in the study area. Quantitative analytical tool in form of unrestricted Cobb-Douglas production function was used to determine the extent to which the inputs used explained the variability of cotton output. The Cobb-Douglas production function is expressed as follows:
Q = AXi bi (where i ranges from 1 to 4) …….. Equation 1 The specification is log linearised to obtain an estimating equation as:
Ln Qi = Ln A + b1 LnX1i + b2 LnX2i + b3 LnX3i + b4 LnX4i + LnUi …….. Equation 2
Where,
Qi is the output of the ith cotton-based farms (kg)
X3i is the amountof plant protection used on the ith cotton-based farm in litres
X4i is the amountof hired labour employed on the ith cotton-based farm in man-days
A is the intercept term which represents the average physical product (A measure of the efficiency of
technology adopted by the ith farmer);
b1, b2,……, b4 are the slope terms representing the elasticity’s of production for the different
inputs used by the ith farm;
Ui is the error term.
The efficiency of resource use was obtained from the estimated equation by comparing the Marginal Value Product (MVP) of a particular input with the Marginal Factor Cost (MFC) of that input. The MVP of an input was obtained by
MVP xi = MPP xi * P
Where MPP xi is the Marginal Physical Product of xi and
P is the unit price of the output (q). The MFC for an input is defined as:
MFC xi = MPP xi * r xi
Where r xi is the unit price of input xi.
The regression coefficients, which are equal to the elasticity coefficients in Cobb-Douglas
production function was used to measure the return-to-scale in rubber production. When b1 + b2 + ---
+ b5 equal one, there is constant return to scale, above one indicate increasing return to scale, and less
than one indicate decreasing return to scale.
As regards the resource use efficiency, whenever
MVP xi > MFC xi there is under utilization of resource xi
MVP xi < MFC xi there is over utilization of resource xi
MVP xi = MFC xi there is optimum utilization of resource xi
III. RESULTS AND DISCUSSIONS
The summary statistics of a typical cotton based farming household in Parbhani district is presented in Table 1. The table showed that a typical cotton-based farming household have about five members. Besides, an average age of cotton farmers was about 53 years with 29 years of experience in cotton production. 37 per cent of the farmers were educated.
Table 1: Summary of cotton-based farming households in Parbhani
Indicator Average Coefficient of Variation
Age of farmers 53.33 0.81
Household size 4.80 0.63
Farming experience (Years) 29.02 0.73
Education status 36.67 0.67
Farm size (Hectares) 0.78 0.29
Livestock 4.37 0.56
Net cropped area (Hectares) 3.52 0.28
Double cropped area 0.93 0.26
Gross cropped area 4.45 0.29
The average farmland cultivated was about 0.78 hectares whereas the livestock reared was 4. The net cropped area per hectare was 3.52, while the double cropped area and gross cropped area were 0.93 and 4.45 hectares, respectively. The different farming systems operated by the cotton smallholders in the study area were: Cotton, Cotton+Dairy, Cotton+Horticulture, Cotton+Goatary, Cotton+Sericulture.
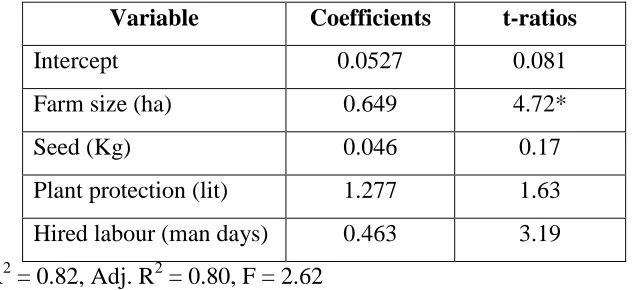
The estimated form of the unrestricted Cobb-Douglas production function is given in Table 2.
Table 2: Estimated Cobb-Douglas production function for cotton smallholders in Parbhani district
Variable Coefficients t-ratios
Intercept 0.0527 0.081
Farm size (ha) 0.649 4.72*
Seed (Kg) 0.046 0.17
Plant protection (lit) 1.277 1.63
Hired labour (man days) 0.463 3.19
R2 = 0.82, Adj. R2 = 0.80, F = 2.62
The R2 of 0.82 is high, thus this explained 82 per cent of the variations in the value of cotton output in the
study area. Moreover, farm size was significant at 1 per cent and this explained that land availability determined the value of cotton output in the study area. However, the result of the scale coefficient masked the resource use efficiency of each input in the production of cotton in the study area. Table 3, shows the MVP and MFC of the individual input used.
Table 3: Marginal Value Product (MVP) and Marginal Factor Cost (MFC) of production inputs in cotton production in
Parbhani district
Input MVP MFC Efficiency ratio
Farm size 15.78 13.59 1.16
Seed 0.42 0.48 0.88
Plant Protection 7.81 6.58 1.19
Hired Labour 0.35 0.41 0.85
From table 3, it is observed that the values of MVPs that for farm size and plant protection are greater than one and positive indicating that the farmers had opportunities to increase per hectare output by using more land and plant protection measures. Again the MVPs for seed and hired labour are positive but less than one. It indicates that there was no scope for spending more for seed and labour which would decrease profit. Farm inputs, especially plant protection should be supplied to farmers at the right time and at cost that is within their reach.
IV. CONCLUSION
Based on the findings from this study, it is recommended that cotton production should be based on technique that will utilize more land. Farm inputs, especially plant protection should be supplied to farmers at the right time and at cost that is within their reach. Similarly, tractor hire services should be made available to farmers for better use of labour and management in production. More financial facilities should be extended to farmers to boost production. Finally, extension services should be provided to enable cotton producers improve their productivity through better use of available resources. Also, any bids that may constrain the increased use of these resources should be guarded against.
BIBLIOGRAPHY
1. Esike, C. S.; Owie, O. E. D. and Okoh, R. N. 2009. Resource-Use Efficiency and Return to Scale in Smallholders Rubber Farming in Edo State, Nigeria. J. Hum Ecol., 28: 183-186.
2. Haque, T, 2006. Resource Use Efficiency in Indian Agriculture. Indian Journal of Agriculture Economics., 61: 65-68. 3. Reddy, E. L. and Reddy, D. R. 2014. A Study on Resource Use Efficiency of Agricultural Input Factors with Reference to
Farm Size in Three Revenue Mandals of Nellore District: Andhra Pradesh., 14: 12-16.
4. Reddy, E. L. and Reddy, D. R. 2013. A Study on Resource Use Efficiency of Input Factors with Reference to Farm Size in Paddy Cultivation in Nellore District., 17: 48-55.